Semiconductor quantum dots (QDs), especially the highly fluorescent CdSe-based core-shell nanostructures, have generated much excitement for their variety of potential applications in optical bioimaging and beyond.[1,2] These QDs are widely considered as being more advantageous over conventional organic dyes as well as genetically engineered fluorescent proteins in terms of optical brightness and photostability.[1,3–5] However, a serious disadvantage with these popular QDs is their containing heavy metals such as cadmium, whose significant toxicity and environmental hazard are well-documented.[6–9] Alternative benign (nontoxic) QD-like fluorescent nanomaterials have therefore been pursued, including the recent finding of fluorescent carbon nanoparticles (dubbed “carbon dots”).[10,11]
Carbon dots are surface-passivated small carbon nanoparticles, where the surface passivation is most effective via functionalization with organic or bio-molecules[10–16] (though other passivation schemes also possible for weaker emissions[17–19]). In addition to sharing some of the major advantageous characteristics with semiconductor QDs, including high photostability,[1,10,13] large two-photon excitation cross-sections,[11,20] and applicability as optical imaging agents in vivo,[20,21] carbon dots are also non-blinking,[10,13] readily water-soluble,[10,11,13–16] and nontoxic according to currently available cytotoxicity and in vivo toxicity evaluation results.[18,22] The as-produced carbon dots have so far exhibited fluorescence quantum yields up to 20% in the green,[22] which are somewhat lower than those of commercially available best-performing CdSe/ZnS QDs for the comparable spectral region.
Here we report that the as-prepared carbon dots sample could be fractionated simply on an aqueous gel column. The most fluorescent fractions could achieve emission yields close to 60%, thus comparable to those of the best commercial CdSe/ZnS QDs in solution and brighter at the individual dot level (due to the carbon dots being significantly higher in absorptivities). Interestingly, both the absorption and fluorescence results of the carbon dots resembled those of bandgap transitions typically found in nanoscale semiconductors. The prospect for carbon particles at the nanoscale to acquire essentially semiconductor-like properties, which are enhanced by the surface functionalization, is discussed.
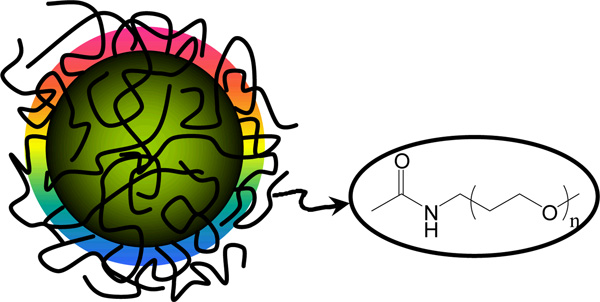
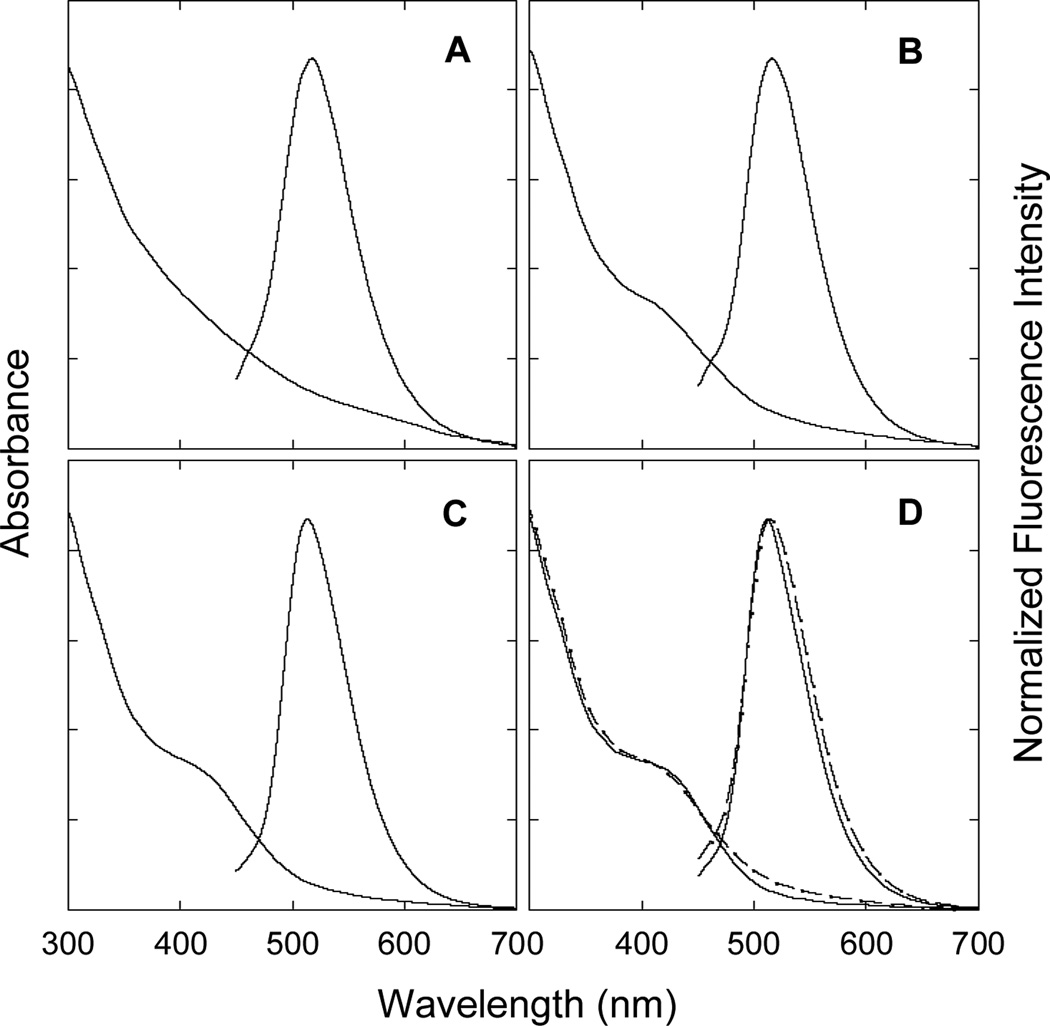
The synthesis of carbon dots with oligomeric PEG diamine (PEG1500N) as surface passivation agent (Scheme 1) was based largely on the previously reported procedure,[10,22] except for a more rigorous control of the functionalization reaction conditions (critical to the enhanced fluorescence performance in the resulting carbon dots). The precursor carbon nanoparticles treated with thionyl chloride (to generate acyl chlorides on the particle surface) were reacted in the melt of PEG1500N at 110 °C, for which the temperature control was found to be necessary to yielding more fluorescent carbon dots. The carbon dots sample was processed from aqueous solution, and the resulting colored aqueous solutions at various concentrations remained stable indefinitely. The optical absorption shoulder in the blue (around 450 nm, Figure 1) was characteristic for sample solutions thus obtained, where the excitation resulted in equally characteristic green fluorescence emissions (centered around 510 nm, Figure 1) with quantum yields ΦF of 16–20% (representing variations from batch to batch).
Scheme 1.
Figure 1.
Absorption and fluorescence (440 nm excitation) spectra of the fractions 1 (A), 3 (B), 5 (C), and the most fluorescent 7 (D). Also shown in (D) with dashed lines are the spectra of the as-prepared sample for comparison.
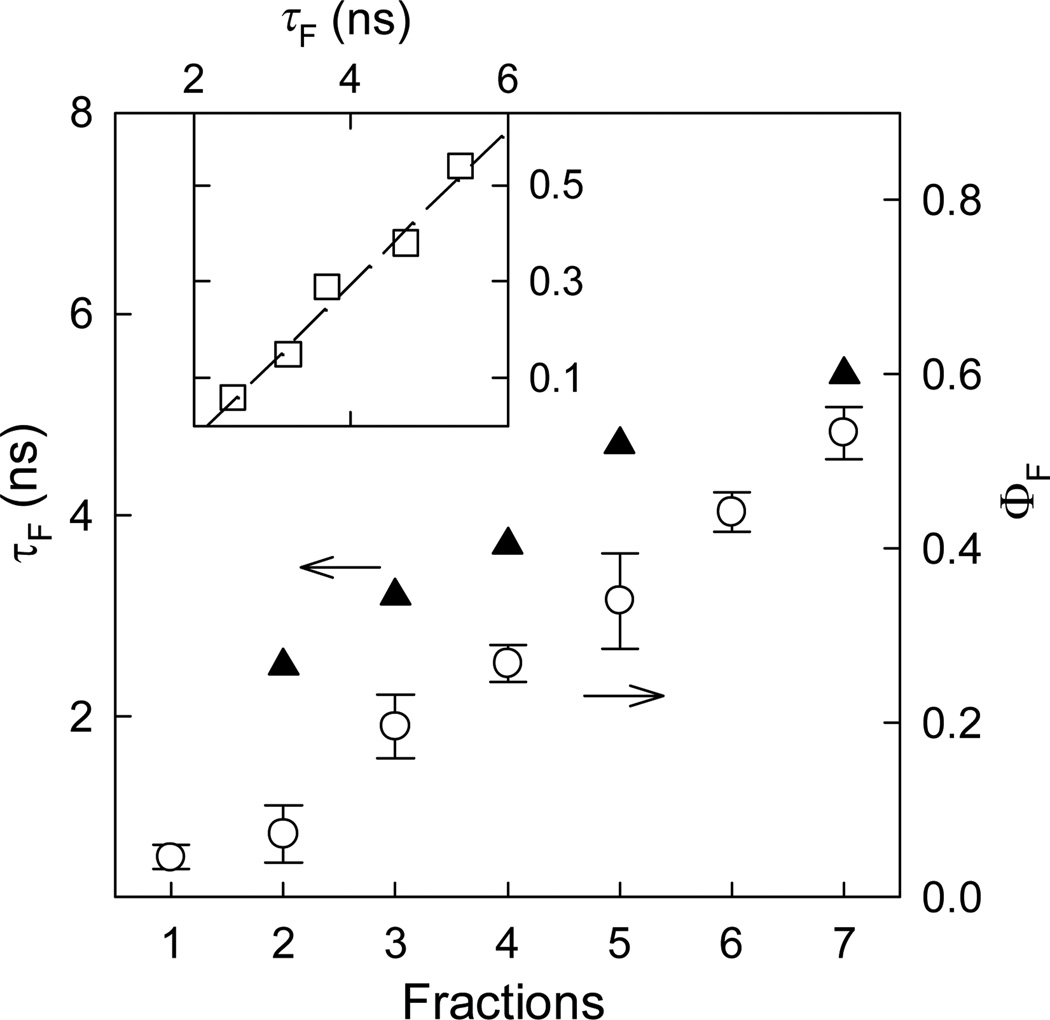
The as-prepared sample of carbon dots was loaded onto an aqueous gel column packed with Sephadex™ G-100 (supplied by GE Healthcare)[23] for fractionation. With water as eluent, the fractions were collected and measured for their optical absorption spectra. As in the pre-fractionation sample, later fractions featured an increasingly well-defined absorption shoulder in the blue (Figure 1, in the first fraction the shoulder, relatively weaker, masked by other broad absorptions), into which the excitation resulted in strong green fluorescence emissions. While the observed fluorescence spectra were all rather similar (Figure 1), their quantum yields were significantly different, progressively higher in later fractions, reaching ΦF of 55–60% in the most fluorescent last fraction (Figure 2).
Figure 2.
Fluorescence quantum yields (〇) and lifetimes (▲) of the different fractions, and the linear relationship between the observed yields and lifetimes (inset).
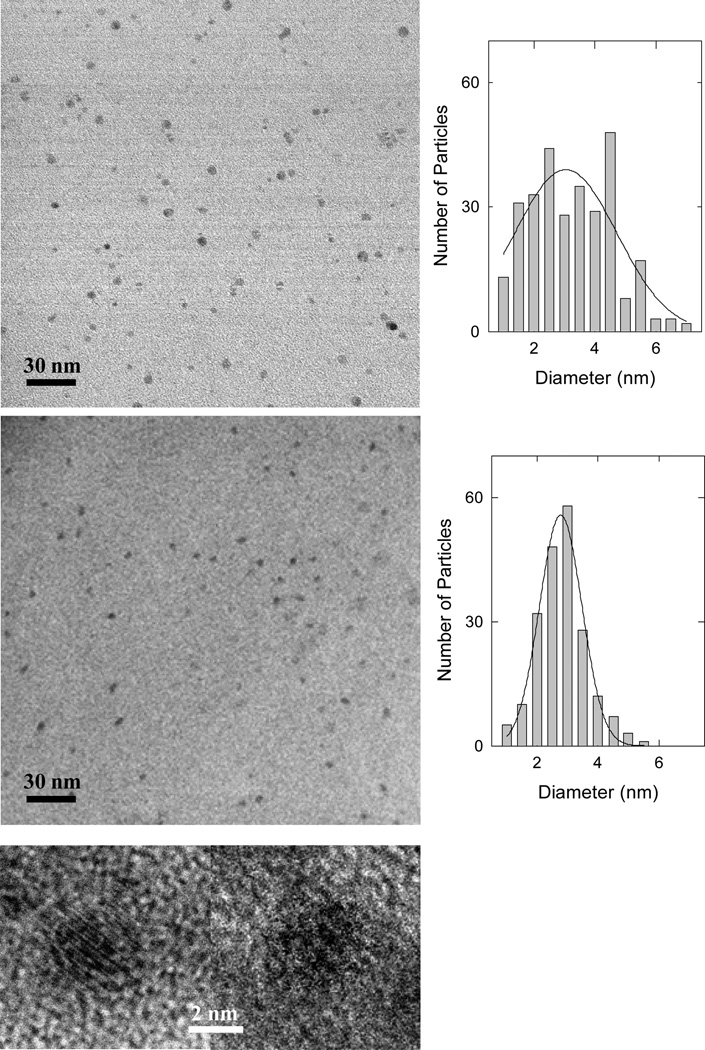
For comparative analyses at the nanoscale, the pre-fractionation sample and the most fluorescent fraction were deposited onto substrates for imaging by using transmission electron microscopy (TEM) and atomic force microscopy (AFM) techniques. The TEM images suggested no major differences between the two samples under comparison, except for the latter being size-wise slightly smaller on average and narrower in size distribution according to statistical analyses (Figure 3). These were generally supported by the AFM imaging results and the associated height analyses (see Supporting Information).
Figure 3.
Representative TEM images of carbon dots in the as-produced sample (upper) and in the most fluorescent fraction (lower, and also the attached high-resolution images of two dots), with the corresponding statistical size analysis results based on multiple images.
The fluorescence decays of the fractions could only be deconvoluted with a multi-exponential function,[24] yielding an average fluorescence lifetime for each of the fractions. The variation in the lifetime values thus obtained generally tracked that in the observed fluorescence quantum yields among different fractions (Figure 2), suggesting a relatively uniform fluorescence radiative process throughout the fractions (namely that the observed fluorescence quantum yield variations were due predominantly to changes in competing nonradiative processes from fraction to fraction). The fluorescence radiative rate constants thus calculated (kF = ΦF/τF) were very large throughout the fractions, on average 1 × 10⁸ s−1, suggesting very strong electronic transitions.[25,26] For reference, anthracene as a strongly fluorescent organic dye has a radiative rate constant kF of less than 5 × 10⁷ s−1, to which the corresponding molar absorptivity of the 0–0 transition is more than 8,000 M−1cm−1.[26] Also for comparison, the commercially supplied best-performing CdSe/ZnS QDs for the similar spectral region (“QD525PEG” from Invitrogen) were found to have a kF value of ~0.3 × 10⁸ s−1 (ΦF ~ 0.6 and τF ~ 18.5 ns determined experimentally under the same conditions as those for the carbon dots).
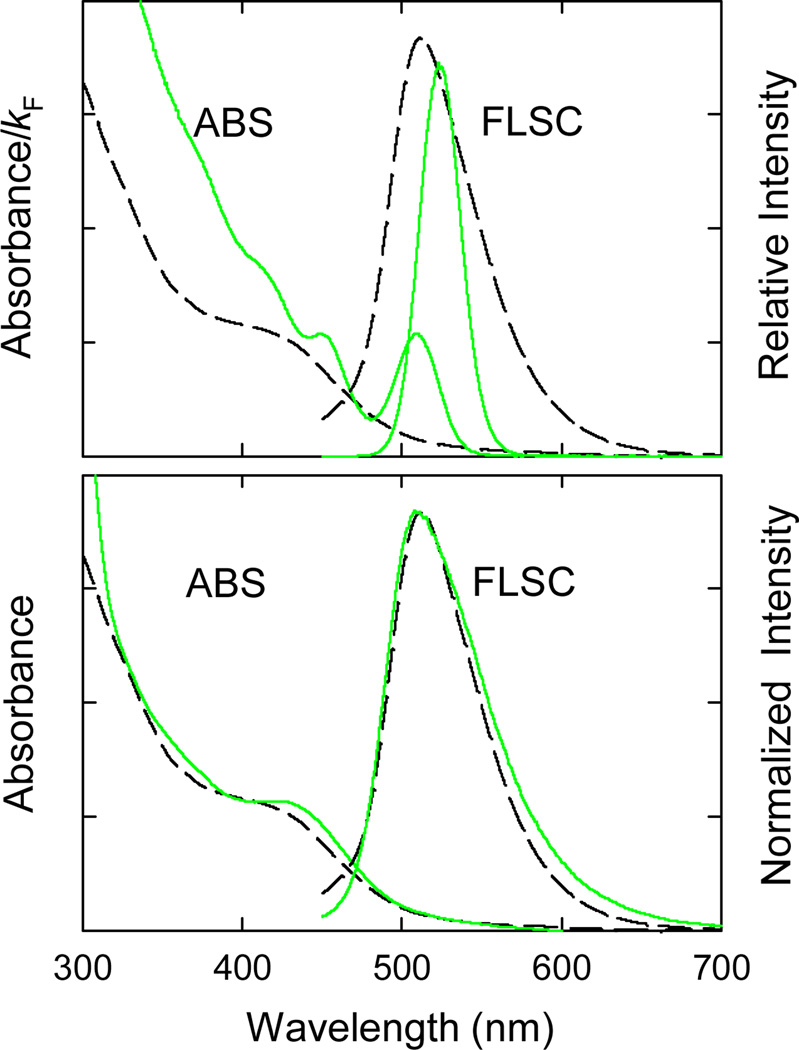
According to well-established photophysical principles,[24–26] the radiative rate constant is proportional to the integrated molar absorptivities under the concerned absorption band, and in the first approximation proportional to the molar absorptivity at the band maximum.[26] Therefore, the absorbance at the band maximum Amax to kF ratio is approximately proportional to the numbers of dots in the solution, namely that in a comparison between solutions of carbon dots and QDs the same Amax/kF value essentially represents the same number of dots in both solutions. Shown in Figure 4 is such a comparison, which suggests that at the individual dot level the carbon dots in the most fluorescent fraction could be more than double in fluorescence brightness than the reference CdSe/ZnS QDs for the similar spectral region. This was supported by results from the single-dot fluorescence imaging experiments described as follows.
Figure 4.
Absorption (ABS) and fluorescence (FLSC) spectra of carbon dots in the most fluorescent fraction (- - -) are compared with those of Invitrogen QD525PEG QDs (—) in aqueous solutions (upper, FLSC intensities corresponding to excitations at matching first band maximum A/kF values), and with those of ZnS-doped carbon dots[34] (lower).
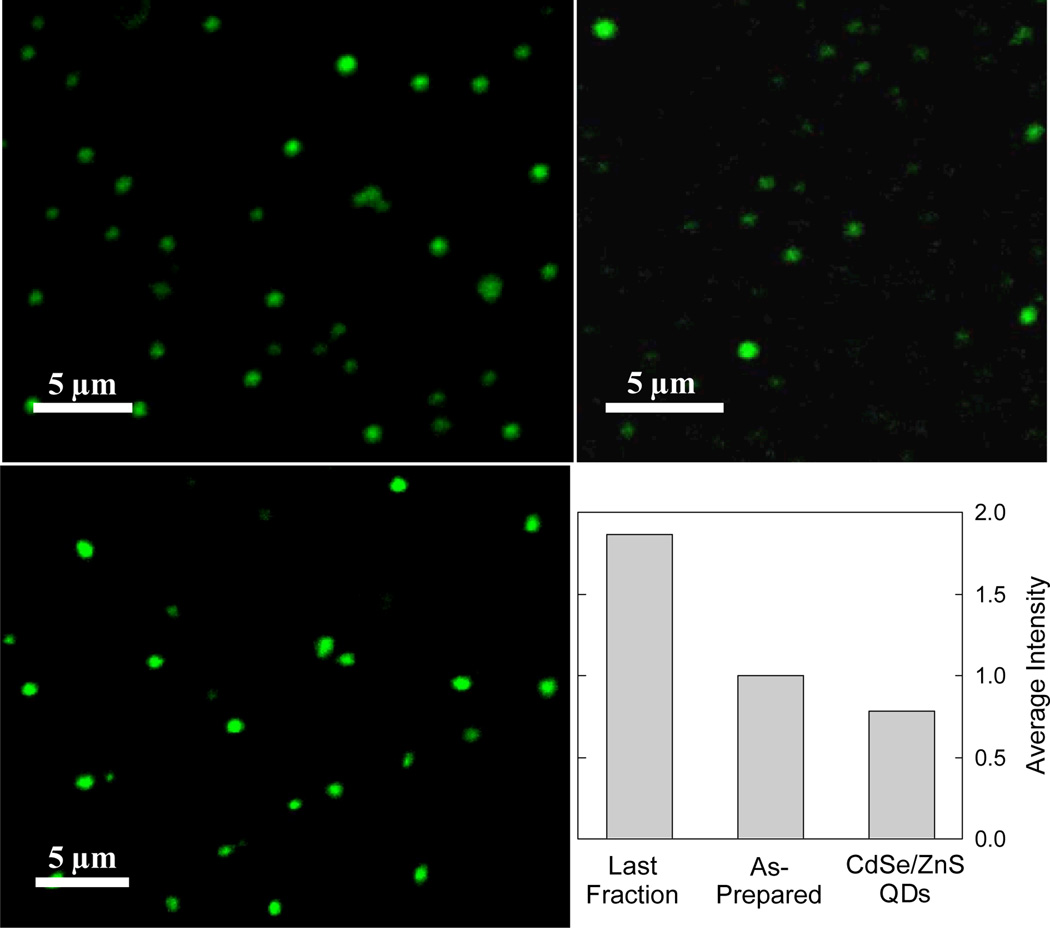
The carbon dots were dispersed on cover-glass as substrate in terms of an infinite dilution to allow confocal microscopy imaging of individual dots. The deposition conditions for the preparation of the specimens were essentially the same as those for TEM and AFM imaging, where the results confirmed the dispersion of individual dots in the specimens. For the specimen from the pre-fractionation sample, fluorescence images of carbon dots in relatively wider varying brightness were observed (Figure 5), consistent with the fact that the sample contained fractions of different fluorescence quantum yields. The carbon dots in the specimen from the mostly fluorescent fraction were more uniform in terms of fluorescence brightness, as expected (Figure 5). Also as expected from the conclusion in the comparison discussed above between bulk solutions of the same Amax/kF ratio, the individual carbon dots in this fraction were obviously brighter in fluorescence than the CdSe/ZnS QDs (mostly by 2 – 2.5 fold, Figure 5).
Figure 5.
Fluorescence microscopy images (458 nm excitation) of carbon dots in as-prepared sample (upper left) and in the most fluorescent fraction (lower left), and images of Invitrogen QD525PEG QDs (upper right). The bar-chart comparison was based on averaging 300 most fluorescent dots in each of the three samples.
The carbon dots are size-wise comparable with or somewhat smaller than the aqueous compatible CdSe/ZnS QDs supplied commercially (especially when the surface capping agents are included in the dot sizes). Therefore, the brighter fluorescence emissions in individual carbon dots make these dots particularly valuable to optical bioimaging in vitro and in vivo, especially to the emerging needs for molecular probes in high-resolution cellular imaging.[27,28]
Mechanistically, the fluorescence in carbon dots was thought to be associated with passivated surface defects of the core carbon particles.[10,11] In other well-known cases on excited state energy trapping by surface defects in nanoparticles, the emissive states are generally different from the initially excited state.[29,30] For nanoscale semiconductors such as CdS, as a classical example, the excitation into the bandgap absorption band results in exciton fluorescence and, in most cases, surface defect emissions.[29–32] The latter may even be overwhelming in the observed fluorescence spectra of many CdS nanoparticles.[30,33] In carbon dots, on the other hand, there are no classical bandgap absorptions, so that the surface defect states must be accessed directly from the ground state. Therefore, the excited state energy trapping is probably between the defects responsible for absorptions and those for emissions (instead of between the excitonic state and emissive defect states found in CdS and other semiconductor nanoparticles). One may thus expect a broad distribution of excitations, corresponding to mostly featureless absorption spectra, as observed in many preparations of carbon dots.[10,13,14] Interestingly and importantly, however, the spectroscopic results reported here suggest that the electronic transitions in carbon dots are not necessarily broadly distributed.
The absorption shoulder in the blue (Figure 1) is in fact surprisingly well-defined and specific in all of the more fluorescent later fractions (and in the pre-fractionation sample as well, where the more rigorously controlled reaction conditions in the carbon dots synthesis apparently enhanced the absorption shoulder at the expense of the broad absorptions at other colors). The same absorption feature was also observed previously in the “doped” carbon dots (Figure 4), in which the carbon core was doped with an insoluble inorganic salt such as ZnO or ZnS.[34] Of particular interest is the fact that the ZnO or ZnS doping also resulted in substantially more fluorescent carbon dots,[34] rather similar to the fractionated carbon dots here in both optical absorption and fluorescence properties (Figure 4). It seems that the absorption shoulder around 450 nm and the corresponding fluorescence band around 510 nm represent “sweet spots” in the electronic transitions, because they are apparently shared by the carbon dots of different surface functionalities. These obviously preferred transitions in the carbon dots are almost as specific as the bandgap transitions characteristic of quantum-confined nanoscale semiconductors. Phenomenologically at least, nanoscale carbon particles with appropriate surface functionalization (as in the later fractions reported here) or other forms of surface passivation (such as a combination of doping with inorganic salt and organic functionalization)[34] could become semiconductor-like to exhibit bandgap-like electronic transitions. In terms of the optical properties at least, the surface-passivated small carbon nanoparticles seem no different from quantum-confined semiconductors.
An interesting question of potentially far-reaching implications is whether such specific electronic transitions in the carbon dots in this work could be found or even tuned in other colors. The currently available experimental results are insufficient to provide an affirmative answer to such a question, though the broad absorption and fluorescence spectra (covering the entire visible spectral region and extending into the near-IR) observed in other preparations of carbon dots do suggest that carbon dots are at least in principle capable of direct electronic transitions at many other wavelengths.
The changes in fluorescence quantum yields and lifetimes among different factions might be explained by varying degrees of surface passivation by PEG1500N molecules, both covalently via amide linkages and noncovalently in terms of strong surface adsorption, with also influence from the difference in particle sizes. Because on the gel column free PEG1500N molecules eluted at last, a speculation is such that the later fractions probably consisted of those carbon dots that were somewhat smaller in sizes and well-passivated with PEG1500N molecules (thus making the dots behave a little closer to free PEG1500N molecules). However, efforts on experimentally verifying the speculation have not yielded the kind of quantitative results required for a conclusion, since structural elucidations of the carbon dots based on NMR and FT-IR characterizations have proven to be rather difficult. For example, 13C-NMR spectra were generally simple but not informative, exhibiting only the expected weak carbonyl signals (other particle surface carbons not detected for their being too diverse). Further investigations are necessary and will be pursued.
Even without a clear structural understanding of the carbon dots in the most fluorescent fraction, the existence of these dots itself is very important fundamentally and mechanistically, and the successful isolation of these brightly fluorescent carbon dots reported here may prove highly valuable technologically. The fact that these carbon dots are individually much brighter than comparable semiconductor QDs, coupled with their being nontoxic (at least on the basis of presently available results),[18,22] should lead to significant applications in bioimaging and beyond.
Experimental Section
The preparation of precursor carbon nanoparticles and the synthesis of carbon dots were based on the previously reported procedures,[10,22] with slight modifications and more rigorous controls of the experimental conditions for improved fluorescence properties. Briefly, the carbon soot was refluxed in aqueous nitric acid solution (2.6 M) for 12 h, dialyzed against fresh water, and then centrifuged at 1,000g to retain the supernatant. The recovered sample was refluxed in neat thionyl chloride for 6 h, followed by the removal of excess thionyl chloride on a rotovap. The treated carbon particle sample (100 mg) was mixed well with carefully dried PEG1500N (1 g) in a flask, heated to 110 °C, and vigorously stirred under nitrogen protection for 3 days. The reaction mixture was cooled to room temperature, dispersed in water, and then centrifuged at 25,000g to retain the supernatant.
The gel column for the fractionation of carbon dots was prepared with the commercially supplied Sephadex G-100™ gel.[23] Briefly, the gel (15 g) was soaked in water for 3 days, and the supernatant (including the suspended ultrafine gel) was discarded. The remaining gel was washed until no gel was suspended in the supernatant. Air bubbles were removed with vacuum. Separately, a glass column (25 mm inner diameter) was filled with water to remove air bubbles, and then closed. The gel suspension described above was poured into the column. As the gel precipitation to reach about 2 cm in height, the column was opened for the continuous addition of the gel suspension. The gel-filled column was washed until no changes in height (36 cm), followed by the testing and calibration of the column.[23] In the fractionation, an aqueous solution of the as-prepared carbon dots was added to the gel column and eluted with water. Colored fractions were collected for characterization and further investigations.
Supplementary Material
Footnotes
This work was made possible by a grant from NIH. L.C. was supported by a Susan G. Komen for the Cure Postdoctoral Fellowship. S.-T.Y. was a visiting student from Peking University (the group of Prof. Haifang Wang and Prof. Yuanfang Liu) in Beijing, China. K.W.S. and M.A.B. were research participants supported by Palmetto Academy, an education-training program managed by South Carolina Space Grant Consortium.
Supporting information for this article is available on the WWW under http://www.angewandte.org or from the author
References
- 1.Resch-Genger U, Grabolle M, Cavaliere-Jaricot S, Nitschke R, Nann T. Nat. Methods. 2008;5:763–775. doi: 10.1038/nmeth.1248. [DOI] [PubMed] [Google Scholar]
- 2.Kamat PV. J. Phys. Chem. C. 2008;112:18737–18753. [Google Scholar]
- 3.Alivisatos AP. Science. 1996;271:933–937. [Google Scholar]
- 4.Hines MA, Guyot-Sionnest P. J. Phys. Chem. 1996;100:468–471. [Google Scholar]
- 5.Wu X, Liu H, Liu J, Haley KN, Treadway JA, Larson JP, Ge N, Peale F, Bruchez MP. Nat. Biotechnol. 2003;21:41–46. doi: 10.1038/nbt764. [DOI] [PubMed] [Google Scholar]
- 6.Lovric J, Cho SJ, Winnik FM, Maysinger D. Chem. Biol. 2005;12:1227–1234. doi: 10.1016/j.chembiol.2005.09.008. [DOI] [PubMed] [Google Scholar]
- 7.Hardman RA. Environ. Health Perspect. 2006;114:165–172. doi: 10.1289/ehp.8284. [DOI] [PMC free article] [PubMed] [Google Scholar]
- 8.Lin P, Chen J-W, Chang LW, Wu J-P, Redding L, Chang H, Yeh T-K, Yang C, Tsai M-H, Wang H-J, Kuo Y-C, Yang RSH. Environ. Sci. Technol. 2008;42:6264–6270. doi: 10.1021/es800254a. [DOI] [PubMed] [Google Scholar]
- 9.Geys J, Nemmar A, Verbeken E, Smolders E, Ratoi M, Hoylaerts MF, Nemery B, Hoet PHM. Environ. Health Perspect. 2008;116:1607–1613. doi: 10.1289/ehp.11566. [DOI] [PMC free article] [PubMed] [Google Scholar]
- 10.Sun Y-P, Zhou B, Lin Y, Wang W, Fernando KAS, Pathak P, Meziani MJ, Harruff BA, Wang X, Wang HF, Luo PJG, Yang H, Kose ME, Chen B, Veca LM, Xie S-Y. J. Am. Chem. Soc. 2006;128:7756–7757. doi: 10.1021/ja062677d. [DOI] [PubMed] [Google Scholar]
- 11.Cao L, Wang X, Meziani MJ, Lu FS, Wang HF, Luo PJG, Lin Y, Harruff BA, Veca LM, Murray D, Xie S-Y, Sun Y-P. J. Am. Chem. Soc. 2007;129:11318–11319. doi: 10.1021/ja073527l. [DOI] [PMC free article] [PubMed] [Google Scholar]
- 12.Mochalin VN, Gogotsi Y. J. Am. Chem. Soc. 2009;131:4594–4595. doi: 10.1021/ja9004514. [DOI] [PubMed] [Google Scholar]
- 13.Liu R, Wu D, Liu S, Koynov K, Knoll W, Li Q. Angew. Chem. Int. Ed. 2009;48:4598–4601. doi: 10.1002/anie.200900652. [DOI] [PubMed] [Google Scholar]
- 14.Peng H, Travas-Sejdic J. Chem. Mater. 2009;21:5563–5565. [Google Scholar]
- 15.Zhu H, Wang X, Li Y, Wang Z, Yang F, Yang X. Chem. Commun. 2009:5118–5120. doi: 10.1039/b907612c. [DOI] [PubMed] [Google Scholar]
- 16.Hu S-L, Niu K-Y, Sun J, Yang J, Zhao N-Q, Du X-W. J. Mater. Chem. 2009;19:484–488. [Google Scholar]
- 17.Zhou J, Booker C, Li R, Zhou X, Sham T-K, Sun X, Ding Z. J. Am. Chem. Soc. 2007;129:744–745. doi: 10.1021/ja0669070. [DOI] [PubMed] [Google Scholar]
- 18.Zhao Q-L, Zhang Z-L, Huang B-H, Peng J, Zhang M, Pang D-W. Chem. Commun. 2008;113:5116–5118. doi: 10.1039/b812420e. [DOI] [PubMed] [Google Scholar]
- 19.Ray SC, Saha A, Jana NR, Sarkar R. J. Phys. Chem. C. 2009;113:18546–18551. [Google Scholar]
- 20.Larson DR, Zipfel WR, Williams RM, Clark SW, Bruchez MP, Wise FW, Webb WW. Science. 2003;300:1434–1436. doi: 10.1126/science.1083780. [DOI] [PubMed] [Google Scholar]
- 21.Yang S-T, Cao L, Luo PJG, Lu FS, Wang X, Wang HF, Meziani MJ, Liu Y, Qi G, Sun Y-P. J. Am. Chem. Soc. 2009;131:11308–11309. doi: 10.1021/ja904843x. [DOI] [PMC free article] [PubMed] [Google Scholar]
- 22.Yang S-T, Wang X, Wang HF, Lu FS, Luo PJG, Cao L, Meziani MJ, Liu J-H, Liu Y, Chen M, Huang Y, Sun Y-P. J. Phys. Chem. C. 2009;113:18110–18114. doi: 10.1021/jp9085969. [DOI] [PMC free article] [PubMed] [Google Scholar]
- 23.Andrews P. Biochem. J. 1964;91:222–233. doi: 10.1042/bj0910222. [DOI] [PMC free article] [PubMed] [Google Scholar]
- 24.Lakowicz JR. Principles of Fluorescence Spectroscopy. 2nd Ed. Kluwer Academic/Plenum Publishers; New York: 1999. [Google Scholar]
- 25.(a) Perrin F. J. Phys. Radium. 1926;7:390–401. [Google Scholar]; (b) Berlman IB. Mol. Cryst. 1968;4:157–163. [Google Scholar]
- 26.Turro NJ. Modern Molecular Photochemistry. Sausalito, CA: University Science Books; 1991. [Google Scholar]
- 27.Gao X, Yang L, Petros JA, Marshall FF, Simons JW, Nie S. Curr. Opin. Biotechnol. 2005;16:63–72. doi: 10.1016/j.copbio.2004.11.003. [DOI] [PubMed] [Google Scholar]
- 28.(a) Michalet X, Pinaud FF, Bentolila LA, Tsay JM, Doose S, Li JJ, Sundaresan G, Wu AM, Gambhir SS, Weiss S. Science. 2005;307:538–544. doi: 10.1126/science.1104274. [DOI] [PMC free article] [PubMed] [Google Scholar]; (b) Courty S, Luccardini C, Bellaiche Y, Cappello G, Dahan M. Nano. Lett. 2006;6:1491–1495. doi: 10.1021/nl060921t. [DOI] [PubMed] [Google Scholar]; (c) Chang Y-P, Pinaud F, Antelman J, Weiss S. J. Biophoton. 2008;1:287–298. doi: 10.1002/jbio.200810029. [DOI] [PMC free article] [PubMed] [Google Scholar]
- 29.Wang Y, Suna A, McHugh J, Hilinski EF, Lucas PA, Johnson RD. J. Chem. Phys. 1990;92:6927–6939. [Google Scholar]
- 30.Brus L. J. Phys. Chem. 1986;90:2555–2560. [Google Scholar]
- 31.Chestnoy N, Harris TD, Hull R, Brus L. J. Phys. Chem. 1986;90:3393–3399. [Google Scholar]
- 32.Spanhel L, Haase M, Weller H, Henglein A. J. Am. Chem. Soc. 1987;109:5649–5655. [Google Scholar]
- 33.Bunker CE, Harruff BA, Pathak P, Payzant A, Allard LF, Sun Y-P. Langmuir. 2004;20:5642–5644. doi: 10.1021/la049607+. [DOI] [PubMed] [Google Scholar]
- 34.Sun Y-P, Wang X, Lu FS, Cao L, Meziani MJ, Luo PJG, Gu L, Veca LM. J. Phys. Chem. C. 2008;112:18295–18298. doi: 10.1021/jp8076485. [DOI] [PMC free article] [PubMed] [Google Scholar]
Associated Data
This section collects any data citations, data availability statements, or supplementary materials included in this article.


