

Abstract
C-reactive protein (CRP) is a systemic inflammation marker that predicts future cardiovascular risk. CRP levels are higher in African Americans and Hispanic Americans than in European Americans, but the genetic determinants of CRP in these admixed United States minority populations are largely unknown. We performed genome-wide association studies (GWASs) of 8,280 African American (AA) and 3,548 Hispanic American (HA) postmenopausal women from the Women's Health Initiative SNP Health Association Resource. We discovered and validated a CRP-associated variant of triggering receptors expressed by myeloid cells 2 (TREM2) in chromosomal region 6p21 (p = 10−10). The TREM2 variant associated with higher CRP is common in Africa but rare in other ancestral populations. In AA women, the CRP region in 1q23 contained a strong admixture association signal (p = 10−17), which appears to be related to several independent CRP-associated alleles; the strongest of these is present only in African ancestral populations and is associated with higher CRP. Of the other genomic loci previously associated with CRP through GWASs of European populations, most loci (LEPR, IL1RN, IL6R, GCKR, NLRP3, HNF1A, HNF4A, and APOC1) showed consistent patterns of association with CRP in AA and HA women. In summary, we have identified a common TREM2 variant associated with CRP in United States minority populations. The genetic architecture underlying the CRP phenotype in AA women is complex and involves genetic variants shared across populations, as well as variants specific to populations of African descent.
Introduction
C-reactive protein (CRP) is a systemic inflammation marker that predicts future cardiovascular risk.1–3 Plasma CRP levels increase with age and are higher in women than in men.4–9 African American (AA) and Hispanic American (HA) individuals have higher concentrations of CRP than do European American (EA) individuals.4–9 Chronic low-grade inflammation might contribute to increased cardiovascular disease risk and other health disparities among these minority United States populations.10 CRP levels are also correlated with obesity and other metabolic and atherosclerotic risk factors.11–13 The correlation between CRP and adiposity does not appear to completely explain the higher CRP levels in populations of African descent.12–15 Therefore, other factors, both genetic and nongenetic, most likely contribute to CRP differences between racial and ethnic groups.
Family and twin studies suggest that additive genetic factors account for 25%–40% of the variance in plasma CRP levels in Europeans16–18 and 45% in AA individuals.19 Recent large genome-wide association studies (GWASs) conducted on Europeans and Japanese have identified approximately 20 CRP-associated loci that together explain ∼5% of the variance.20–23 Many of these genes involve pathways related to either innate immunity (these are CRP [MIM 123260], IL6R [MIM 147880], IL6 [MIM 147620], NLRP3 [MIM 606416], IL1RN [MIM 147679], and IRF1 [MIM 147575]) or lipid and glucose metabolism (these are APOC1 [MIM 107710], HNF1A [MIM 142410], LEPR [MIM 601007], GCKR [MIM 600842], HNF4A [MIM 600281], RORA [MIM 600825], PPP1R3B [MIM 610541]).
No large CRP GWAS performed to date has included participants of African or Hispanic ancestry. Recently, a GWAS was performed on ∼800 AA individuals, but no new loci were discovered.24 Using genotype and phenotype data from the Women's Health Initiative SNP Health Association Resource (WHI-SHARe), we therefore undertook a GWAS and local-ancestry analysis of 8,280 AA participants and a GWAS of 3,548 HA participants. Our goals were to identify new and possibly ancestry-specific genetic variants associated with CRP in AA and HA women and to assess the genetic architecture of CRP association in these women at inflammatory and metabolism loci previously identified in CRP GWASs of European and Asian populations.
Subjects and Methods
Our overall approach can be summarized as follows. (1) The GWAS discovery stage consisted of 8,280 WHI-SHARe AA samples and 3,548 HA samples and also included admixture mapping of the AA population. Because of issues related to heterogeneous ethnicity within Latinos,25 the lack of availability of an adequately-sized Native American reference panel (which impacts estimation accuracy), and the smaller Women's Health Initiative (WHI) HA sample size (compared to the larger AA sample), we did not perform admixture mapping in the HA sample. (2) Validation of the CRP-associated locus, as well as functional validation with expression quantitative trait locus (eQTL) analysis, was performed for independent cohorts including Candidate Gene Association Resource (CARe) AA individuals (n = 6,300) and whites from the Atherosclerosis Risk in Communities (ARIC) study (n = 5,656). (3) Assessment of transferability of other previously published loci associated with CRP was performed with the WHI-SHARe AA and HA samples.
Study Subjects
Recruitment for the WHI began in 1993 and ended in 1998 and was conducted by 40 clinical centers in 24 states and the District of Columbia.26 At the time of enrollment, all women were required to be between 50 and 79 years old, postmenopausal, and expected to remain in the area for at least 3 years. Enrollment of racial or ethnic minority groups proportionate to the total minority population of women between 50 and 79 years of age was a high priority of the WHI. Ten of the 40 WHI clinical centers with expertise and access to specific minority groups (American Indian, black, Asian American or Pacific Islander, and Hispanic) were selected to serve as minority recruitment sites. At the end of the recruitment period, 161,808 women had joined the WHI, and about 17% represented racial or ethnic minority groups. Clinical information was collected by self-report and physical examination. Certified staff obtained fasting blood samples at the baseline clinic visit by venipuncture and deposited these samples into tubes containing ethylenediaminetetraacetic acid. There were 12,151 self-identified AA and 5,469 self identified HA WHI subjects who had consented to genetic research and were eligible for WHI-SHARe. Because of budget constraints, we randomly selected a subsample of 12,157 of these women: 8,515 (70.1%) AA and 3,642 (66.6%) HA women. DNA was extracted by the Specimen Processing Laboratory at the Fred Hutchinson Cancer Research Center from specimens that were collected at the time of enrollment. All participants provided written informed consent as approved by local human subjects committees.
CRP Measurement
High-sensitivity CRP was measured in serum from a total of 11,962 WHI-SHARe participants on a Roche Modular P Chemistry analyzer at the University of Minnesota with the use of a latex-particle enhanced immunoturbidimetric assay kit (Roche Diagnostics, Indianapolis, IN) The results were reported in mg/l. Median CRP was 3.50 and the interquartile range was 1.58–7.40. The assay coefficient of variation was 2.3%. All CRP values were natural-log transformed for normalizing the distributions of the phenotypic data.
Genotyping and Quality Control
Genome-wide genotyping was performed at Affymetrix on the Affymetrix 6.0 array with 2 μg of DNA at a concentration of 100 ng/μl. Approximately 1% (n = 99) of samples could not be genotyped. We excluded samples that had a call rate below 95% (n = 16), that were duplicates of subjects other than monozygotic twins (n = 34), or that had a Y chromosome (n = 1). SNPs on the Y chromosome and Affymetrix quality-control (QC) probes were excluded from analysis (n = 3,280). We also flagged SNPs that had call rates, calculated separately for AA and HA individuals, < 95% and concordance rates < 98%, leaving 871,309 unflagged SNPs. After exclusions, there were 12,007 unique subjects (8,421 AA and 3,586 HA), and there was an average call rate of 99.8% over the unflagged SNPs. We analyzed 188 pairs of blind duplicate samples. The overall concordance rate was 99.8% (the ranges were 94.5%–100% over samples, 98.3%–100% over samples with call rates > 98%, and 98.1%–100% over unflagged SNPs).
Genotype Imputation
Imputation was carried out with MaCH.27 After some more stringent filtering, 829,370 genotyped SNPs were used for imputation. For the imputation in AA samples, we used 240 HapMap 2 (release 22) phased haplotypes from the CEU (Utah residents with ancestry from northern and western Europe from the CEPH collection) and YRI (Yoruba in Ibadan, Nigeria) reference panels and were left with a total of 2,203,609 SNPs. To augment the size of the reference panel and aid imputation accuracy in the remaining individuals in the study,27 we estimated parameters on a subset of 200 WHI AA subjects and then imputed all WHI AA subjects. For 2,190,779 SNPs, we obtained imputations with a minor allele frequency (MAF) > 1% and an estimated R2 > 0.3. On a small test sample (2% of the markers on three chromosomes), the average R2 was 0.88 and the allelic discordance rate was 2.3%. For imputation in HA samples, we used a larger reference panel of HapMap III CEU + MEX (Mexican ancestry in Los Angeles, California) + YRI samples for a total of 1,387,466 SNPs (MAF > 1%), of which 1,368,178 SNPs met the quality threshold of R2 > 0.3.
Relatedness
We used a random subset of 100,000 SNPs from autosomal chromosomes and the method-of-moments approach to a three-parameter identity-by-descent (IBD) model28 to compute IBD coefficients between all pairs of 12,008 subjects. On the basis of these coefficients, we identified pairs of parents and offspring (22 pairs and 2 trios), monozygotic twins (five pairs), and siblings (192 pairs and 5 trios). A more thorough confirmatory analysis with a pairwise kinship-coefficient estimator,29 as well as the aforementioned method-of-moments approach, was performed separately for AA and HA individuals, and it validated these relationships and identified half siblings (73 pairs). In CRP association analyses, we included one individual from each relative pair, typically the one with the higher call rate.
Admixture Estimation and Principal-Component Analysis
Separately for the AA and the HA samples, we computed eigenvectors by using Eigenstrat30 at 178,101 markers that were in common between our samples and the reference panels. We also determined individual ancestral proportions by using Frappe31 at 656,852 autosomal markers. For both of these calculations, we included 475 publically available samples from ancestral populations (YRI, CEU, East Asians, and Native Americans).32,33 On the basis of the Frappe estimates, we identified 56 subjects who were self-identified as AA but who appeared to have less than 10% African ancestry. We also flagged one participant with questionable estimates of both ancestry and relatedness. Because we cannot exclude the possibility of either a sample mishandling or a data-entry error, we flagged these 57 samples for exclusion.
Local-Ancestry Estimation
For each AA individual in the sample, locus-specific ancestry (the probability of whether an individual has 0, 1, or 2 alleles of African ancestry at each locus) was estimated with the program SABER+, an extension of the model described in Tang et al.34 In brief, SABER+ uses a graphical-model approach to adaptively capture local haplotype structure within each ancestral population and thereby more accurately accounts for background linkage disequilibrium (LD). In simulation studies, this method compares favorably to existing methods in terms of the accuracy and computational efficiency; its error rate is less than 1.5%. In the current analysis, phased haplotype data from the HapMap3 CEU and YRI individuals were augmented as the reference panels. In simulation studies, SABER+ achieves accuracy similar to that of HapMix; based on analysis of simulated and real AA genotypes, the correlation between local-ancestry estimates produced by the two methods is very high.35
GWAS Data Analysis
GWASs for ln-transformed CRP (excluding the WHI-SHARe study participants with raw CRP values > 100 mg/dl) were performed under an additive genetic model with the use of covariate-adjusted linear regression implemented in either PLINK v.1.0728 or MACH2QTL v.1.08.27 Analyses were conducted separately for self-identified AA and HA individuals. For direct or imputed genotypes, allelic dosage at each SNP was used as the independent variable, adjusted for primary covariates of age and geographic region. In sensitivity analyses, we additionally adjusted for body mass index (BMI), hormone therapy, diabetes, and hypertension. To adjust for population stratification and global admixture, we also incorporated the first four principal components (PCs) as covariates in the regression models. Eigenvectors 5–10 showed no evidence of association with CRP levels. To maintain an overall type 1 error rate of 5%, we used a threshold of α = 2.5 × 10⁻⁸ to declare genome-wide statistical significance. This threshold has been suggested for African ancestry populations on the basis of estimates of approximately two million independent common-variant tests in African genomes.36
To further assess the potential existence of multiple, independent variants influencing a trait at the same locus (allelic heterogeneity), we repeated regression analyses, conditional on the most strongly associated (index) SNP in that region. To assess in the WHI-SHARe AA and HA individuals trait-associated loci previously reported in Europeans or Japanese, we evaluated the AA and HA results (including consistency of direction of effect) for each index SNP in the regions reported and assessed statistical significance by a simple Bonferroni adjustment based on the total number of SNPs assessed with a two-sided hypothesis test.
Admixture Mapping
Using the local-ancestry estimates, we performed an admixture-mapping analysis to detect variants that are present at different frequencies among the European and African ancestral populations. Adjusting for age and genome-wide ancestry proportions by using the first four PCs, we regressed ln-CRP on locus-specific ancestry. We performed the admixture scan with and without additional adjustment for BMI. The critical value for genome-wide significance level of admixture mapping is substantially lower than that for the genotype test because the recent history of admixture gives rise to extensive correlation in local ancestry. On the basis of previous theoretical analysis and simulation results, a nominal p value of 7 × 10⁻⁶ yielded a genome-wide type I error of 0.05.34
Validation of New CRP Association Signals in Independent Samples
Replication of novel association findings in WHI AA individuals was performed with GWAS data from 3,548 HA women from WHI-SHARe, 6,300 AA men and women from the CARe consortium, and 5,656 whites from the ARIC study. Both genotyped and imputed SNP data were available in the CARe AA, WHI-SHARe HA, and ARIC white samples. We used a p value of < 0.05 to declare statistical significance in the replication samples. We conducted meta-analyses combining data from our discovery and replication cohorts by using inverse-variance weighted fixed-effects models to combine beta coefficients and standard errors from study-level regression results for each SNP to derive effect estimates and a combined p value. Meta-analyses were implemented in the software METAL.37
Analysis of eQTLs
We assessed the functional effects of newly identified CRP-associated SNPs on gene expression by querying a publically accessible database containing genome-wide analysis of 22,305 genes expressed in peripheral-blood monocytes of 1,467 European individuals.38
Results
Assessment of Global and Local Ancestry in Relation to CRP in Admixed Populations
WHI participant characteristics are summarized by self-reported ethnicity in Table 1. Among AA individuals, mean estimates of genome-wide ancestry proportions were 76% African, 21% European, <2% Asian, and <2% Native American. Among HA participants, the mean estimates were 60% European, 32% Native American, 6% African, and <2% East Asian. European ancestry was negatively correlated with age-adjusted CRP in both AA (p < 10 × 10−5) and HA (p = 0.001) individuals; the correlation with European ancestry was attenuated upon adjustment for BMI (p = 0.3 in AA samples and p = 0.05 in HA samples). In HA individuals, Native American ancestry was associated with higher age-adjusted CRP (p = 0.0001) and East Asian ancestry was associated with lower age-adjusted CRP (p = 0.007); these associations were largely robust to BMI adjustment (p = 0.001 for Native American ancestry and p = 0.005 for East Asian ancestry).
Table 1.
Characteristics of WHI-SHARe AA and HA Participants
| Study | AA Women | HA Women |
|---|---|---|
| Sample size | 8,280 | 3,548 |
| Age (SD) | 61.6 years (7.0) | 60.2 years (6.7) |
| Female | 100% | 100% |
| BMI (SD) | 31.0 kg/m2 (6.7) | 28.9 kg/m2 (5.6) |
| Current smoker | 11.6% | 6.8% |
| Diabetes | 13.9% | 8.3% |
| Hypertension | 55.1% | 29.3% |
| High cholesterol | 15.6% | 13.7% |
| Current hormone use | 53.5% | 61.2% |
| Median CRP (SD) | 3.68 mg/l (7.85) | 3.16 mg/l (7.22) |
| Admixture Proportions | ||
| African (SD) | 75.9% (15.3) | 6.2% (11.9) |
| European (SD) | 20.7% (15.2) | 60.1% (20.2) |
| East Asian (SD) | 2.2% (2.7) | 1.8% (5.3) |
| Native American (SD) | 1.2% (1.8) | 31.9% (20.1) |
The following abbreviations are used: AA, African American; HA, Hispanic American; SD, standard deviation; and BMI, body mass index.
In the genome-wide admixture scan, we observed for CRP a strong admixture signal spanning a 15 Mb region of chromosome 1q (151.5–166.7 Mb; GRCh37/hg19) and found the peak association (p = 1.45 × 10⁻¹⁷) at CRP (159.7 Mb) (Figure 1). In this region, local African ancestry is associated with higher CRP. A second, albeit much weaker, ancestry-association peak is present on chromosome 13q at 108.2 Mb (rs9514697–rs9514698), which is located within an intron of a large gene designated FAM155A (family with sequence similarity 155, member A). The function of FAM155A is unknown, and there are no other biologically plausible candidate genes in the region. The p value was borderline significant (6.6 × 10⁻⁶) and was only present in the BMI-adjusted analysis.
Figure 1.
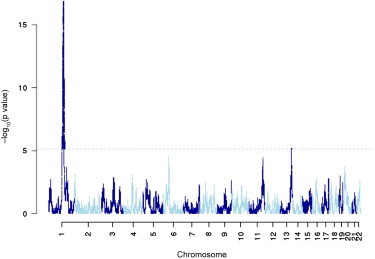
Admixture Mapping Scan of CRP in WHI AA Women
Admixture mapping −log10 p values are shown on the y axis, and SNPs are ordered by chromosomal position on the x axis. The dotted line represents a genome-wide p value significance level less than approximately 7 × 10⁻⁶ (under the assumption of 7,000 independent tests). There is one strongly genome-wide significant peak centered around CRP on chromosome 1, indicating that local African ancestry in this region is associated with CRP.
GWAS of CRP in AA and HA Individuals
The results of the GWAS for CRP in AA and HA individuals under an additive genetic model are shown in Figures 2 and 3. Quantile-quantile plots are shown in Figure S1, available online. The lead or index SNPs associated with the CRP phenotype in each genomic region are summarized in Tables 2 and 3, and LD association plots for each region are shown in Figures S2 and S3. In AA participants, the strongest GWAS signal includes CRP, corresponding to the 1q23 peak observed in the CRP admixture scan. Four other regions reached genome-wide significance in the GWAS: 2q13 (IL1F10-IL1RN), 6p21 (TREM2 [MIM 605086]), 12q24 (HNF1A), and 19q13 (TOMM40-APOE [MIM 608061]). In HA individuals, three regions reached genome-wide significance: 1p31 (LEPR), 1q23 (CRP), and 12q24 (HNF1A). Repeating the GWAS with additional covariate adjustments for BMI, hormone therapy, diabetes, and hypertension did not appreciably alter the results.
Figure 2.
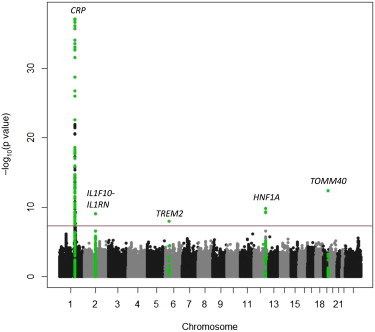
Manhattan Plot of CRP in WHI AA Women
Gene regions containing genome-wide significant SNPs (p < 2.5 × 10⁻⁸) are highlighted in green.
Figure 3.
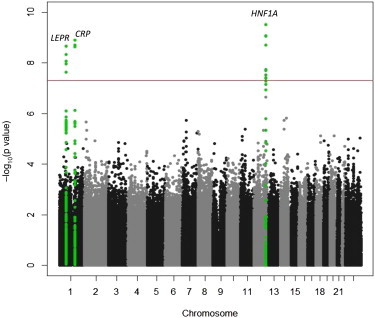
Manhattan Plot of CRP in WHI HA Women
Gene regions containing genome-wide significant SNPs (p < 2.5 × 10⁻⁸) are highlighted in green.
Table 2.
Genome-wide Significant SNPs for CRP in AA Women
| Chromosomal Region | Number of SNPS with p < 2.5 × 10⁻⁸ | Top SNP in Region | Position Hg18 | Candidate Gene | Minor/Major Allele | Minor Allele Frequency | Effect Size (Standard Error) | p Value |
|---|---|---|---|---|---|---|---|---|
| 1q23 | 131 | rs16827466 | 159,649,700 | CRP, APCS, DARC, FCER1A, DUSP23, OR10J1, OR10J5, OR10J3, OLFML2B, IFI16, FCRL6 | T/C | 0.178 | 0.4199 (0.023) | 4.149 × 10−73 |
| 2q13 | 1 | rs6734238 | 113,557,501 | IL1F10, IL1RN | G/A | 0.446 | −0.108 (0.018) | 9.3 × 10⁻¹⁰ |
| 6p21 | 1 | rs7748513 | 41,235,950 | TREM2 | G/A | 0.432 | 0.106 (0.018) | 8.39 × 10⁻⁹ |
| 12q24 | 5 | rs7979473 | 119,904,643 | HNF1A | A/G | 0.443 | −0.119 (0.019) | 1.45 × 10⁻¹⁰ |
| 19q13 | 1 | rs1160985 | 50,095,252 | TOMM40 | C/T | 0.366 | −0.1343 | 4.19 × 10⁻¹³ |
For each locus, the lead SNP with the smallest p values among the genotyped or imputed SNPs is indicated. Effect size represents the effect of a minor allele on natural-log-transformed CRP. Positions of the SNPs were derived from dbSNP build 136. Novel CRP associations are shown in bold.
Table 3.
Genome-wide Significant SNPs for CRP in HA Women
| Chromosomal Region | Number of SNPs with p < 5 × 10⁻⁸ | Top SNP in Region | Position Hg18 | Candidate Gene | Minor/Major Allele | Minor Allele Frequency | Effect Size (Standard Error) | p Value |
|---|---|---|---|---|---|---|---|---|
| 1p31 | 5 | rs1805096 | 65,874,845 | LEPR | A/G | 0.451 | −0.113 (0.025) | 2.2 × 10⁻⁹ |
| 1q23 | 3 | rs7553007 | 157,965,173 | CRP | G/A | 0.344 | 0.129 (0.026) | 1.2 × 10⁻⁹ |
| 12q24 | 16 | rs2259816 | 119,919,970 | HNF1A, OASL, C12orf43 | T/G | 0.379 | 0.141 (0.025) | 3.0 × 10⁻¹⁰ |
For each locus, the lead SNP with the smallest p values among the genotyped or imputed SNPs is indicated. Effect size represents the effect of a minor allele on natural-log-transformed CRP. Positions of the SNPs were derived from dbSNP build 136.
Assessment of Allelic Heterogeneity at the CRP Locus
The magnitude and breadth of the CRP association signal spanning chromosomal region 1q23 in both the admixture scan and GWAS suggest the possibility of allelic heterogeneity at this locus. We therefore performed a series of conditional analyses in which we initially adjusted for the index SNP rs16827466 and then successively adjusted the CRP association signal for the most strongly associated SNP remaining at each step. As shown in Table 4, there was evidence of at least three independent CRP-associated alleles. The African-ancestry-specific rs16827466 T allele is associated with higher CRP and appears to account for ∼50% of the local-ancestry association signal in this region. rs7553007 and rs2808634 are associated with lower CRP, and the CRP-lowering alleles at each SNP are more common in European populations than in African populations. After a simultaneous adjustment for rs16827466, rs7553007, and rs2808634, the p value for association between local ancestry and CRP is 0.047. Therefore, these three CRP variants appear to account for much, but perhaps not all, of local-ancestry association signal in chromosomal region 1q23.
Table 4.
Association between CRP SNPs or Local Ancestry and CRP Phenotype in WHI AA Individuals with and without Simultaneous Adjustment for the Remaining CRP SNPs
| SNP | Position Hg18 | Minor/Major Allele | Minor Allele Frequency | Effect Allele Frequency in HapMap YRI/CEU/CHB Samples |
Without Simultaneous Adjustment (Age and PCs Only) |
With Simultaneous SNP Adjustment |
||
|---|---|---|---|---|---|---|---|---|
| Effect Size (Standard Error) | p Value | Effect Size (Standard Error) | p Value | |||||
| rs16827466 | 157,916,324 | T/C | 0.178 | 0.20/0/0 | 0.4199 (0.023) | 4.149 × 10−73 | 0.324 (0.025) | 2.35 × 10−39 |
| rs7553007 | 157,965,173 | T/C | 0.228 | 0.20/0.34/0.556 | −0.272 (0.021) | 1.1 × 10−37 | −0.229 (0.022) | 2.82 × 10⁻²⁴ |
| rs2808634 | 157,959,197 | T/C | 0.156 | 0.137/0.305/0.220 | −0.153 (0.024) | 3.9 × 10⁻¹⁰ | −0.143 (0.026) | 2.28 × 10⁻⁸ |
| Local ancestry | 157,916,324 | European/African | 0.228 | N/A | −0.174 (0.024) | 1.45 × 10⁻¹⁷ | −0.048 (0.024) | 0.047 |
The following abbreviations are used: YRI, Yoruba in Ibadan, Nigeria; CEU, Utah residents with ancestry from northern and western Europe from the CEPH collection; CHB, Han Chinese in Beijing, China; PC, principal component; and N/A, not available.
Interestingly, local African ancestry in chromosomal region 1q23 is also strongly associated with lower white blood cell count (WBC) (another inflammation-sensitive phenotype) in African Americans as a result of a common African-ancestry-specific null DARC (MIM 613665) variant, FY∗O (rs2814778). In a recent GWAS from Sardinia,20 DARC rs3845624 was reported to be independently associated with CRP. In the initial WHI AA GWAS, rs3845624 (MAF = 0.15; imputation R2 = 0.94) was nominally associated with CRP (p = 2 × 10⁻⁷). However, in the conditional GWAS (with an adjustment for the three independently associated CRP variants rs16827466, rs7553007, and rs2808634), the p value for this SNP was 0.30. Because of the correlation between CRP and WBC (which accounts for ∼5% of CRP phenotypic variation), we repeated the CRP association analysis in AA individuals by adjusting for WBC. The FY∗O allele at DARC showed statistically significant association (when we adjusted for both the three CRP SNPs and WBC; p = 2.4 × 10⁻³⁰). However, upon adjustment for local ancestry at CRP, the association disappeared. We emphasize that these results do not exclude the DARC locus as a functional locus but rather are constrained by the population genetic structure. The apparent association between the FY∗O allele and CRP level might represent functional involvement of DARC, or FY∗O might simply tag additional undiscovered CRP-associated variants in chromosomal region 1q23. In AA individuals, admixture generates strong LD between DARC and CRP; therefore, it is difficult to statistically disentangle the contribution of the two loci.
To assess allelic heterogeneity at additional CRP-associated loci, we repeated the GWAS in AA individuals by conditioning on all eight independent, genome-wide significant CRP-associated SNPs (three from CRP, one from LEPR, one from IL1RN, one from TREM2, one from HNF1A, and one from APOE). There were no additional association signals.
Discovery and Validation of the CRP-Associated Locus in Chromosomal Region 6p21
Of the six genomic regions significantly associated with CRP in either AA or HA individuals or both, only chromosomal region 6p21 has not been previously associated with CRP in any population. The CRP signal in this region is located within a cluster of genes that encode the triggering receptors expressed by myeloid cells (TREM) family of leukocyte receptors, which are involved in the regulation of proinflammatory cytokines and chemokine production by neutrophils, monocytes, macrophages, and dendritic cells. The index SNP rs7748513 is located within the second intron of TREM2. The rs7748513 variant G allele associated with higher CRP is common in AA individuals (MAF = 0.43) but is much less common in other populations (MAF < 0.05 in HapMap European and Asian populations). Additional adjustment for local African ancestry did not alter the association between TREM2 rs7748513 and CRP (beta = 0.102 ± 0.020; p = 3.8 × 10⁻⁷). When stratified by local ancestry and adjusted for global ancestry, the association between rs7748513 and CRP was present in the 7,722 AA individuals who carried two (beta = 0.100 ± 0.0232; p < 0.0001) or one (beta = 0.122 ± 0.041; p < 0.0001) African chromosomes at the TREM2 locus, but not in the 557 AA individuals who carried two European chromosomes (beta = −0.222 ± 0.190; p = 0.25). However, not surprisingly, the MAF of rs7748513 is considerably lower (0.04) among those women carrying two European chromosomes at this locus; therefore, there is limited power for detecting an association in this stratum.
No other SNPs in the TREM cluster reached genome-wide significance in AA individuals. However, another African-ancestry-specific coding variant of TREM2, rs2234253 (MAF = 0.11), was associated with 0.12 ± 0.023 higher ln-CRP (p = 3 × 10⁻⁵). Within TREM2 exon 2, rs2234253 encodes a p.Thr96Lys substitution that is predicted to be deleterious.39 The r2 between rs2234253 and rs7748513 in WHI-SHARe AA participants was 0.41. Upon adjustment for rs7748513, the CRP association with rs2234253 was greatly attenuated but still nominally significant (beta = 0.063 ± 0.030; p = 0.04). Haplotype analysis showed that the minor allele of rs2234253 (the p.Lys96 variant) is only present in combination with the African G variant of rs7748513; thus, these two SNPs define three common TREM2 haplotypes that are associated with lower (A/Thr), intermediate (G/Thr), and higher (G/Lys) CRP (Table 5).
Table 5.
Association between TREM2 Haplotypes and CRP in WHI-SHARe AA Women
| Haplotype | rs7748513 | rs2234253 | Frequency | Beta [95% CI] | p Value |
|---|---|---|---|---|---|
| H1 | A | C | 0.564 | referent | – |
| H2 | G | C | 0.319 | 0.0642 [0.026, 0.102] | 0.00098 |
| H3 | G | A | 0.116 | 0.1107 [0.056, 0.166] | 7.86 × 10⁻⁵ |
The overall p value for TREM2 haplotype association with CRP = 6.97 × 10⁻⁹. The following abbreviation is used: CI, confidence interval.
To validate the newly discovered TREM2 CRP association in an independent sample of AA individuals, we performed association analysis for rs7748513 and rs2234253 in 6,272 AA men and women from the CARe GWAS consortium. rs7748513 met the significance threshold for association (0.044 ± 0.021 increased ln-CRP; p = 0.037), whereas rs2234253 did not (0.053 ± 0.031 increased ln-CRP; p = 0.09). When stratified by sex, the rs7748513 association was present among the 3,787 AA women (beta = 0.070; p = 0.011), but not among the 2,488 AA men (beta = 0.0013; p = 0.97). The p value for interaction between TREM2 rs7748513 genotype and sex in CARe AA individuals was 0.06. Because the association between the TREM2 genotype and CRP appears to be confined to women, we meta-analyzed the WHI-SHARe AA discovery results with the CARe AA validation results in women only. The combined discovery and validation p values were 1 × 10⁻¹⁰ for rs7748513 and 3 × 10⁻⁶ for rs2234253.
We further assessed the association between TREM2 and CRP in the 3,548 WHI-SHARe HA women, in whom the frequency of the rs7748513 G allele was 0.08. In HA women, the rs7748513 G allele was associated with 0.095 natural-log units higher CRP (p = 0.035), whereas the rs2234253 coding variant showed a nonsignificant trend in the same direction (beta = 0.168; p = 0.12). In 5,656 white ARIC study participants, there was no evidence of association between CRP and rs7748513 (MAF = 0.04; p = 0.96). When stratified by sex, the results for rs7748513 were somewhat stronger, though not statistically significant, in white women (0.0614 higher ln-CRP in 3,046 white women [p = 0.18]) compared to men (0.00177 higher ln-CRP in 2,694 white men [p = 0.97]).
Given that TREM-2 has been associated with autoimmune and inflammatory diseases40 and that autoimmune diseases (MIM 109100) are more prevalent in women, we stratified the WHI-SHARe AA results by autoimmune-disease status. In the 2,505 women reporting a history of autoimmune disease, the rs7748513 G allele was associated with 0.132 natural-log units higher CRP (p = 3.8 × 10⁻⁴). In the 5,732 women without autoimmune disease, the rs7748513 G allele was associated with 0.083 natural-log units higher CRP (p = 2.2 × 10⁻⁵). The p value for interaction was 0.31.
To assess the effect of the TREM2 rs7748513 G allele on gene expression, we queried a human monocyte eQTL database derived from 1,467 European subjects.38 Monocytes are one of the white blood cell subtypes that express the TREM receptors on their surface. We did not find evidence for a cis-eQTL in TREM2. Nonetheless, a cis-eQTL was observed in this region of chromosome 6 for association with monocyte mRNA levels of TREML4 (MIM 614664) (p = 8.43 × 10⁻⁶), which is located 68 kb downstream of rs7748513 and is between TREM2 and TREM1. No additional significant cis- or trans-effects were observed for TREM2 rs7748513 with the use of a p threshold of <10−5.
Assessment of Other Previously Discovered WBC-Associated Loci in AA Individuals
Eighteen CRP loci have been identified previously in European or Japanese GWASs.20–23 Table S1 shows the association results of the originally reported index SNP from these loci in our WHI-SHARe AA and HA populations. In AA individuals, seven loci met the strict Bonferroni-corrected significance threshold (p < 0.0028), whereas 12 of 16 loci tested (75%) had p < 0.05 and the same direction of effect. Notably, in several instances (HNF1A, IL6R, HNF4A, RORA, SALL1 [MIM 602218], PSMG1 [MIM 605296], and BCL7B [MIM 605846]), the allele associated with higher CRP is more common among Africans than among Europeans. In HA individuals, six loci met the Bonferroni significance criteria for replication, whereas 9 of 13 (69%) were nominally associated with CRP at p < 0.05 and showed consistent direction of effect. Eight (CRP, APOC1, LEPR, IL6R, GCKR, NLRP3, IL1F10, and HNF4A) of 12 loci (67%) showed consistency of CRP association across white, AA, and HA individuals.
Discussion
In the largest reported GWAS of CRP in United States minority populations, we have identified and validated in chromosomal region 6p21 an African TREM2 variant associated with higher CRP in AA women. We also demonstrate in AA individuals a strong admixture association signal due to several polymorphisms (located within the CRP region) that are independently associated with CRP. As previously reported, the most significant of these is specific to African ancestral populations and is associated with higher CRP. Most loci (CRP, LEPR, IL1RN, IL6R, GCKR, NLRP3, HNF1A, HNF4A, and APOC1) previously associated with CRP through GWASs of European populations showed consistent patterns of association with CRP in AA and HA individuals. Of the CRP loci identified through GWASs of European, Japanese, or AA individuals, the index SNPs at CRP, IL6R, HNF1A, GCKR, TREM2, RORA, and HNF4A showed differences in allele frequency between ancestral populations; the African ancestral allele generally was associated with higher CRP.
TREM2 Is a Genetic Locus Associated with CRP in AA Women
TREMs belong to a family of membrane-bound and soluble receptors encoded by a gene cluster centromeric to the HLA region on human chromosome 6.40,41 TREM-1 activates neutrophils and monocytes in response to bacterial and fungal pathogens by signaling through the adaptor protein DAP12, triggering secretion of proinflammatory chemokines and cytokines, neutrophil degranulation, and phagocytosis. TREM-2 is present on macrophages, microglia, and monocyte-derived dendritic cells and is thought to negatively regulate macrophage cytokine production and autoimmunity. TREM-2 deficiency in humans (Nasu-Hakola syndrome [MIM 221770]) is characterized by bone cysts and CNS demyelination, which leads to dementia.42 TREM-1 and TREM-2 are also expressed constitutively by hepatic macrophages and endothelial cells, and they might have an important role in the inflammatory response to bacterial infection.43 Given the influence of gender and ethnicity on CRP, it is noteworthy that the TREM2 variant associated with higher CRP is common only among African ancestral populations and appears to be confined to women only. Why this association would be sex specific is unclear. All WHI-SHARe participants were postmenopausal, and there was no evidence of interaction between exogenous sex-hormone use and the TREM2 genotype on CRP (data not shown). Further evaluation of the TREM2 genotype in larger samples of AA men and women is needed for confirming the gender specificity of the CRP effect.
Allelic Heterogeneity at the CRP Locus
Allelic heterogeneity at the CRP locus has been previously demonstrated in single-cohort studies of EA and AA adults.15 Of the common CRP SNPs identified by resequencing, several in the CRP promoter region are strongly associated with CRP levels and are correlated with the independently associated CRP index SNPs observed in WHI-SHARe. The CRP-increasing allele of rs16827466 is in LD with a common African CRP promoter haplotype tagged by rs3093058 (CRP-790 T allele), associated with increased basal CRP transcriptional activity in human hepatocytes.15 By contrast, rs7553007 is in LD with a haplotype tagged by rs1205, located in the CRP 3′ flanking region (CRP-3872). The same CRP-lowering haplotype tagged by rs1205 has been associated with lower CRP in AA and HA individuals44 and with lower promoter activity.15 In Europeans, rs1205 is in perfect LD (r2 = 1.0) with the index SNP rs2794520 at the 1q23 CRP locus previously reported in European GWASs.21 The CRP-lowering allele of rs1205 (or rs287994520) is less common in African populations than in Europeans and Hispanics (see Table S1). A third CRP-lowering SNP rs1800947 (CRP-2667) is a synonymous coding variant15 that is present in European, Asian, and Hispanic, but not African, populations.15,44 Thus, interpopulation differences in CRP might be attributable to allele-frequency differences at several CRP SNPs, in which the allele associated with lower CRP levels is more frequent in EA or HA individuals than in AA individuals.
Population Genetic Analysis of the 1q23 Region Containing CRP and DARC
The admixture mapping evidence in chromosomal region 1q23 suggests that this region harbors CRP-associated alleles, which occur at disparate frequencies between the European and African ancestral populations. Indeed, the CRP-increasing variant rs16827466 occurs almost exclusively in Africans, whereas alleles at rs16827466, rs7553007, and rs2808634 also exhibit frequency difference between the HapMap CEU and YRI populations. It is therefore reasonable to ask whether this pattern of divergence is influenced by evolutionary forces other than random drift.
CRP is located ∼500 kb downstream of DARC, a locus that represents a target of natural selection.45,46 In Africa, homozygosity for a null allele (FY∗O or rs2814778) is known to confer resistance to vivax malaria; the null allele is essentially fixed in sub-Saharan African populations but is virtually absent in other parts of the world. Could some of the CRP alleles have reached higher frequency in Africans by hitchhiking on the FY∗O haplotypes? Contradicting this hypothesis, we found that LD between CRP and DARC is low in both HapMap CEU and YRI populations (Figure S4). In contrast to FY∗O, both rs7553007 and rs2808634 are polymorphic in HapMap CEU, YRI, East Asian, and other populations, suggesting that these variations predate the adaptive selection of the FY∗O allele ∼10,000 years ago.47 These observations suggest that evolution at the CRP locus is most likely independent of that at the DARC locus. Although methods based on homozygosity or Fst do not present unambiguous signature of selection in CRP in any continental population, the possibility of adaptive evolution cannot be excluded. This is because most existing methods for detecting signature of selection focus on classic sweeps, in which a beneficial mutation is rapidly driven toward fixation.48 Variation in CRP shows a more complex pattern: multiple variants influence the phenotype. Additionally, the complex population genetic structure within Africa and the admixing history of AA individuals require selection studies for carefully modeling the demographic history.
Although the strong correlation between CRP and obesity accounts for some of the differences in CRP across populations,12,15 genetic factors also appear to contribute to the interethnic phenotypic differences. Intriguingly, almost all CRP-increasing variants occur at a higher frequency in African populations than they do in European populations (see Table S1).This is consistent with a model in which standing variation is subjected to population-specific directional selection: CRP-increasing variants become adaptive in Africans while CRP-decreasing variants spread in Europeans.
CRP Genetic Loci and the Role of Inflammation in Cardiovascular and Metabolic Disease
Of the approximately 20 loci associated with CRP, many of these genes involve pathways related to either innate immunity (e.g., CRP, IL6R, IL6, NLRP3, IL1RN, IRF1, and TREM2) or lipid and glucose metabolism (e.g., APOC1, HNF1A, LEPR, GCKR, HNF4A, RORA, and PTPN2), highlighting the connection between inflammation and metabolic dysregulation. Interethnic differences in CRP and the underlying genetic architecture of CRP have potential implications for cardiovascular-risk stratification, prediction, and treatment, such as statin eligibility. AA individuals have higher CVD risk than do non-Hispanic whites despite higher high-density lipoprotein (HDL) cholesterol and lower triglyceride levels.49–51 Chronic low-grade inflammation might contribute to increased cardiovascular-disease risk and other health disparities among these minority United States populations.11 The metabolic syndrome paradoxically has a lower prevalence in AA individuals than in EA individuals, but there is a greater difference in CRP among AA individuals with and without the metabolic syndrome than there is among EA individuals with and without metabolic syndrome.52
CRP biosynthesis is largely under the control of IL-6, which together with IL-1β activates transcription factors that induce CRP transcription. The IL-6-receptor p.Asp358Ala polymorphism encoded by IL6R rs8192284 is known to dampen the inflammatory effect of IL-6 and lower CRP and has been associated with a lower risk of coronary heart disease (CHD).53 These results suggest not only a causal role of IL-6-receptor signaling in CHD pathogenesis but also that IL-6-receptor blockade with agents such as tocilizumab might provide a novel therapeutic approach to CHD prevention. Notably, the cardioprotective IL-6-receptor p.Asp358Ala variant is considerably less common among AA individuals than it is among whites and HA individuals (Table S1). Therefore, IL-6-receptor blockade might represent a particularly important therapeutic target for CHD prevention in AA individuals.
Acknowledgments
The Women's Health Initiative (WHI) program is funded by the National Heart, Lung, and Blood Institute, National Institutes of Health, and the United States Department of Health and Human Services through contracts HHSN268201100046C, HHSN268201100001C, HHSN268201100002C, HHSN268201100003C, HHSN268201100004C, and HHSN271201100004C. The authors thank the WHI investigators and staff for their dedication and the study participants for making the program possible. A listing of WHI investigators can be found at http://www.whiscience.org/publications/WHI_investigators_shortlist_2010-2015.pdf.
Supplemental Data
Web Resources
The URLs for data presented herein are as follows:
Frappe, http://med.stanford.edu/tanglab/software/frappe.html
International HapMap Project, http://hapmap.ncbi.nlm.nih.gov/
Monocyte eQTL database, http://genecanvas.ecgene.net/uploads/ForReview/
NHLBI CARe Consortium, http://www.broadinstitute.org/gen_analysis/care/index.php/
Online Mendelian Inheritance in Man (OMIM), http://www.omim.org
USCS Genome Browser, http://genome.ucsc.edu/
References
- 1.Pearson T.A., Mensah G.A., Alexander R.W., Anderson J.L., Cannon R.O., 3rd, Criqui M., Fadl Y.Y., Fortmann S.P., Hong Y., Myers G.L., Centers for Disease Control and Prevention. American Heart Association Markers of inflammation and cardiovascular disease: Application to clinical and public health practice: A statement for healthcare professionals from the Centers for Disease Control and Prevention and the American Heart Association. Circulation. 2003;107:499–511. doi: 10.1161/01.cir.0000052939.59093.45. [DOI] [PubMed] [Google Scholar]
- 2.Ridker P.M., Buring J.E., Rifai N., Cook N.R. Development and validation of improved algorithms for the assessment of global cardiovascular risk in women: the Reynolds Risk Score. JAMA. 2007;297:611–619. doi: 10.1001/jama.297.6.611. [DOI] [PubMed] [Google Scholar]
- 3.Ridker P.M., Paynter N.P., Rifai N., Gaziano J.M., Cook N.R. C-reactive protein and parental history improve global cardiovascular risk prediction: The Reynolds Risk Score for men. Circulation. 2008;118:2243–2251. doi: 10.1161/CIRCULATIONAHA.108.814251. 4p, 2251. [DOI] [PMC free article] [PubMed] [Google Scholar]
- 4.Ford E.S., Giles W.H., Myers G.L., Rifai N., Ridker P.M., Mannino D.M. C-reactive protein concentration distribution among US children and young adults: Findings from the National Health and Nutrition Examination Survey, 1999-2000. Clin. Chem. 2003;49:1353–1357. doi: 10.1373/49.8.1353. [DOI] [PubMed] [Google Scholar]
- 5.Albert M.A., Ridker P.M. C-reactive protein as a risk predictor: do race/ethnicity and gender make a difference? Circulation. 2006;114:e67–e74. doi: 10.1161/CIRCULATIONAHA.106.613570. [DOI] [PubMed] [Google Scholar]
- 6.Lakoski S.G., Cushman M., Criqui M., Rundek T., Blumenthal R.S., D'Agostino R.B., Jr., Herrington D.M. Gender and C-reactive protein: Data from the Multiethnic Study of Atherosclerosis (MESA) cohort. Am. Heart J. 2006;152:593–598. doi: 10.1016/j.ahj.2006.02.015. [DOI] [PubMed] [Google Scholar]
- 7.Khera A., McGuire D.K., Murphy S.A., Stanek H.G., Das S.R., Vongpatanasin W., Wians F.H., Jr., Grundy S.M., de Lemos J.A. Race and gender differences in C-reactive protein levels. J. Am. Coll. Cardiol. 2005;46:464–469. doi: 10.1016/j.jacc.2005.04.051. [DOI] [PubMed] [Google Scholar]
- 8.Cushman M., McClure L.A., Howard V.J., Jenny N.S., Lakoski S.G., Howard G. Implications of increased C-reactive protein for cardiovascular risk stratification in black and white men and women in the US. Clin. Chem. 2009;55:1627–1636. doi: 10.1373/clinchem.2008.122093. [DOI] [PMC free article] [PubMed] [Google Scholar]
- 9.Albert M.A., Glynn R.J., Buring J., Ridker P.M. C-reactive protein levels among women of various ethnic groups living in the United States (from the Women's Health Study) Am. J. Cardiol. 2004;93:1238–1242. doi: 10.1016/j.amjcard.2004.01.067. [DOI] [PubMed] [Google Scholar]
- 10.Mensah G.A., Mokdad A.H., Ford E.S., Greenlund K.J., Croft J.B. State of disparities in cardiovascular health in the United States. Circulation. 2005;111:1233–1241. doi: 10.1161/01.CIR.0000158136.76824.04. [DOI] [PubMed] [Google Scholar]
- 11.Miller M., Zhan M., Havas S. High attributable risk of elevated C-reactive protein level to conventional coronary heart disease risk factors: The Third National Health and Nutrition Examination Survey. Arch. Intern. Med. 2005;165:2063–2068. doi: 10.1001/archinte.165.18.2063. [DOI] [PubMed] [Google Scholar]
- 12.Wee C.C., Mukamal K.J., Huang A., Davis R.B., McCarthy E.P., Mittleman M.A. Obesity and C-reactive protein levels among white, black, and hispanic US adults. Obesity (Silver Spring) 2008;16:875–880. doi: 10.1038/oby.2008.7. [DOI] [PMC free article] [PubMed] [Google Scholar]
- 13.Shah T., Newcombe P., Smeeth L., Addo J., Casas J.P., Whittaker J., Miller M.A., Tinworth L., Jeffery S., Strazzullo P. Ancestry as a determinant of mean population C-reactive protein values: Implications for cardiovascular risk prediction. Circ Cardiovasc Genet. 2010;3:436–444. doi: 10.1161/CIRCGENETICS.110.957431. [DOI] [PubMed] [Google Scholar]
- 14.Rodriguez F., Peralta C.A., Green A.R., López L. Comparison of C-reactive protein levels in less versus more acculturated Hispanic adults in the United States (from the National Health and Nutrition Examination Survey 1999-2008) Am. J. Cardiol. 2012;109:665–669. doi: 10.1016/j.amjcard.2011.10.020. [DOI] [PMC free article] [PubMed] [Google Scholar]
- 15.Carlson C.S., Aldred S.F., Lee P.K., Tracy R.P., Schwartz S.M., Rieder M., Liu K., Williams O.D., Iribarren C., Lewis E.C. Polymorphisms within the C-reactive protein (CRP) promoter region are associated with plasma CRP levels. Am. J. Hum. Genet. 2005;77:64–77. doi: 10.1086/431366. [DOI] [PMC free article] [PubMed] [Google Scholar]
- 16.Retterstol L., Eikvar L., Berg K. A twin study of C-Reactive Protein compared to other risk factors for coronary heart disease. Atherosclerosis. 2003;169:279–282. doi: 10.1016/s0021-9150(03)00192-8. [DOI] [PubMed] [Google Scholar]
- 17.Pankow J.S., Folsom A.R., Cushman M., Borecki I.B., Hopkins P.N., Eckfeldt J.H., Tracy R.P. Familial and genetic determinants of systemic markers of inflammation: The NHLBI family heart study. Atherosclerosis. 2001;154:681–689. doi: 10.1016/s0021-9150(00)00586-4. [DOI] [PubMed] [Google Scholar]
- 18.Dupuis J., Larson M.G., Vasan R.S., Massaro J.M., Wilson P.W., Lipinska I., Corey D., Vita J.A., Keaney J.F., Jr., Benjamin E.J. Genome scan of systemic biomarkers of vascular inflammation in the Framingham Heart Study: evidence for susceptibility loci on 1q. Atherosclerosis. 2005;182:307–314. doi: 10.1016/j.atherosclerosis.2005.02.015. [DOI] [PubMed] [Google Scholar]
- 19.Fox E.R., Benjamin E.J., Sarpong D.F., Rotimi C.N., Wilson J.G., Steffes M.W., Chen G., Adeyemo A., Taylor J.K., Samdarshi T.E., Taylor H.A., Jr. Epidemiology, heritability, and genetic linkage of C-reactive protein in African Americans (from the Jackson Heart Study) Am. J. Cardiol. 2008;102:835–841. doi: 10.1016/j.amjcard.2008.05.049. [DOI] [PMC free article] [PubMed] [Google Scholar]
- 20.Naitza S., Porcu E., Steri M., Taub D.D., Mulas A., Xiao X., Strait J., Dei M., Lai S., Busonero F. A genome-wide association scan on the levels of markers of inflammation in Sardinians reveals associations that underpin its complex regulation. PLoS Genet. 2012;8:e1002480. doi: 10.1371/journal.pgen.1002480. [DOI] [PMC free article] [PubMed] [Google Scholar]
- 21.Dehghan A., Dupuis J., Barbalic M., Bis J.C., Eiriksdottir G., Lu C., Pellikka N., Wallaschofski H., Kettunen J., Henneman P. Meta-analysis of genome-wide association studies in >80 000 subjects identifies multiple loci for C-reactive protein levels. Circulation. 2011;123:731–738. doi: 10.1161/CIRCULATIONAHA.110.948570. [DOI] [PMC free article] [PubMed] [Google Scholar]
- 22.Okada Y., Takahashi A., Ohmiya H., Kumasaka N., Kamatani Y., Hosono N., Tsunoda T., Matsuda K., Tanaka T., Kubo M. Genome-wide association study for C-reactive protein levels identified pleiotropic associations in the IL6 locus. Hum. Mol. Genet. 2011;20:1224–1231. doi: 10.1093/hmg/ddq551. [DOI] [PubMed] [Google Scholar]
- 23.Ridker P.M., Pare G., Parker A., Zee R.Y., Danik J.S., Buring J.E., Kwiatkowski D., Cook N.R., Miletich J.P., Chasman D.I. Loci related to metabolic-syndrome pathways including LEPR,HNF1A, IL6R, and GCKR associate with plasma C-reactive protein: The Women's Genome Health Study. Am. J. Hum. Genet. 2008;82:1185–1192. doi: 10.1016/j.ajhg.2008.03.015. [DOI] [PMC free article] [PubMed] [Google Scholar]
- 24.Doumatey A.P., Chen G., Tekola Ayele F., Zhou J., Erdos M., Shriner D., Huang H., Adeleye J., Balogun W., Fasanmade O. C-reactive protein (CRP) promoter polymorphisms influence circulating CRP levels in a genome-wide association study of African Americans. Hum. Mol. Genet. 2012;21:3063–3072. doi: 10.1093/hmg/dds133. [DOI] [PMC free article] [PubMed] [Google Scholar]
- 25.Johnson N.A., Coram M.A., Shriver M.D., Romieu I., Barsh G.S., London S.J., Tang H. Ancestral components of admixed genomes in a Mexican cohort. PLoS Genet. 2011;7:e1002410. doi: 10.1371/journal.pgen.1002410. [DOI] [PMC free article] [PubMed] [Google Scholar]
- 26.Hays J., Hunt J.R., Hubbell F.A., Anderson G.L., Limacher M., Allen C., Rossouw J.E. The Women's Health Initiative recruitment methods and results. Ann. Epidemiol. 2003;13(9, Suppl):S18–S77. doi: 10.1016/s1047-2797(03)00042-5. [DOI] [PubMed] [Google Scholar]
- 27.Li Y., Willer C.J., Ding J., Scheet P., Abecasis G.R. MaCH: Using sequence and genotype data to estimate haplotypes and unobserved genotypes. Genet. Epidemiol. 2010;34:816–834. doi: 10.1002/gepi.20533. [DOI] [PMC free article] [PubMed] [Google Scholar]
- 28.Purcell S., Neale B., Todd-Brown K., Thomas L., Ferreira M.A., Bender D., Maller J., Sklar P., de Bakker P.I., Daly M.J., Sham P.C. PLINK: A tool set for whole-genome association and population-based linkage analyses. Am. J. Hum. Genet. 2007;81:559–575. doi: 10.1086/519795. [DOI] [PMC free article] [PubMed] [Google Scholar]
- 29.Thornton T., McPeek M.S. ROADTRIPS: Case-control association testing with partially or completely unknown population and pedigree structure. Am. J. Hum. Genet. 2010;86:172–184. doi: 10.1016/j.ajhg.2010.01.001. [DOI] [PMC free article] [PubMed] [Google Scholar]
- 30.Price A.L., Patterson N.J., Plenge R.M., Weinblatt M.E., Shadick N.A., Reich D. Principal components analysis corrects for stratification in genome-wide association studies. Nat. Genet. 2006;38:904–909. doi: 10.1038/ng1847. [DOI] [PubMed] [Google Scholar]
- 31.Tang H., Peng J., Wang P., Risch N.J. Estimation of individual admixture: Analytical and study design considerations. Genet. Epidemiol. 2005;28:289–301. doi: 10.1002/gepi.20064. [DOI] [PubMed] [Google Scholar]
- 32.Cann H.M., de Toma C., Cazes L., Legrand M.F., Morel V., Piouffre L., Bodmer J., Bodmer W.F., Bonne-Tamir B., Cambon-Thomsen A. A human genome diversity cell line panel. Science. 2002;296:261–262. doi: 10.1126/science.296.5566.261b. [DOI] [PubMed] [Google Scholar]
- 33.International HapMap Consortium The International HapMap Project. Nature. 2003;426:789–796. doi: 10.1038/nature02168. [DOI] [PubMed] [Google Scholar]
- 34.Tang H., Coram M., Wang P., Zhu X., Risch N. Reconstructing genetic ancestry blocks in admixed individuals. Am. J. Hum. Genet. 2006;79:1–12. doi: 10.1086/504302. [DOI] [PMC free article] [PubMed] [Google Scholar]
- 35.Johnson, N.A. (2011). Efficient models and algorithms for problems in genomics. PhD thesis, Stanford University, Stanford, CA.
- 36.Pe'er I., Yelensky R., Altshuler D., Daly M.J. Estimation of the multiple testing burden for genomewide association studies of nearly all common variants. Genet. Epidemiol. 2008;32:381–385. doi: 10.1002/gepi.20303. [DOI] [PubMed] [Google Scholar]
- 37.Willer C.J., Li Y., Abecasis G.R. METAL: Fast and efficient meta-analysis of genomewide association scans. Bioinformatics. 2010;26:2190–2191. doi: 10.1093/bioinformatics/btq340. [DOI] [PMC free article] [PubMed] [Google Scholar]
- 38.Zeller T., Wild P., Szymczak S., Rotival M., Schillert A., Castagne R., Maouche S., Germain M., Lackner K., Rossmann H. Genetics and beyond—the transcriptome of human monocytes and disease susceptibility. PLoS ONE. 2010;5:e10693. doi: 10.1371/journal.pone.0010693. [DOI] [PMC free article] [PubMed] [Google Scholar]
- 39.González-Pérez A., López-Bigas N. Improving the assessment of the outcome of nonsynonymous SNVs with a consensus deleteriousness score, Condel. Am. J. Hum. Genet. 2011;88:440–449. doi: 10.1016/j.ajhg.2011.03.004. [DOI] [PMC free article] [PubMed] [Google Scholar]
- 40.Ford J.W., McVicar D.W. TREM and TREM-like receptors in inflammation and disease. Curr. Opin. Immunol. 2009;21:38–46. doi: 10.1016/j.coi.2009.01.009. [DOI] [PMC free article] [PubMed] [Google Scholar]
- 41.Allcock R.J., Barrow A.D., Forbes S., Beck S., Trowsdale J. The human TREM gene cluster at 6p21.1 encodes both activating and inhibitory single IgV domain receptors and includes NKp44. Eur. J. Immunol. 2003;33:567–577. doi: 10.1002/immu.200310033. [DOI] [PubMed] [Google Scholar]
- 42.Paloneva J., Manninen T., Christman G., Hovanes K., Mandelin J., Adolfsson R., Bianchin M., Bird T., Miranda R., Salmaggi A. Mutations in two genes encoding different subunits of a receptor signaling complex result in an identical disease phenotype. Am. J. Hum. Genet. 2002;71:656–662. doi: 10.1086/342259. [DOI] [PMC free article] [PubMed] [Google Scholar]
- 43.Sharif O., Knapp S. From expression to signaling: Roles of TREM-1 and TREM-2 in innate immunity and bacterial infection. Immunobiology. 2008;213:701–713. doi: 10.1016/j.imbio.2008.07.008. [DOI] [PubMed] [Google Scholar]
- 44.Crawford D.C., Sanders C.L., Qin X., Smith J.D., Shephard C., Wong M., Witrak L., Rieder M.J., Nickerson D.A. Genetic variation is associated with C-reactive protein levels in the Third National Health and Nutrition Examination Survey. Circulation. 2006;114:2458–2465. doi: 10.1161/CIRCULATIONAHA.106.615740. [DOI] [PubMed] [Google Scholar]
- 45.Livingstone F.B. The Duffy blood groups, vivax malaria, and malaria selection in human populations: A review. Hum. Biol. 1984;56:413–425. [PubMed] [Google Scholar]
- 46.Hamblin M.T., Thompson E.E., Di Rienzo A. Complex signatures of natural selection at the Duffy blood group locus. Am. J. Hum. Genet. 2002;70:369–383. doi: 10.1086/338628. [DOI] [PMC free article] [PubMed] [Google Scholar]
- 47.Hamblin M.T., Di Rienzo A. Detection of the signature of natural selection in humans: evidence from the Duffy blood group locus. Am. J. Hum. Genet. 2000;66:1669–1679. doi: 10.1086/302879. [DOI] [PMC free article] [PubMed] [Google Scholar]
- 48.Hernandez R.D., Kelley J.L., Elyashiv E., Melton S.C., Auton A., McVean G., Sella G., Przeworski M., 1000 Genomes Project Classic selective sweeps were rare in recent human evolution. Science. 2011;331:920–924. doi: 10.1126/science.1198878. [DOI] [PMC free article] [PubMed] [Google Scholar]
- 49.Roger V.L., Go A.S., Lloyd-Jones D.M., Benjamin E.J., Berry J.D., Borden W.B., Bravata D.M., Dai S., Ford E.S., Fox C.S., American Heart Association Statistics Committee and Stroke Statistics Subcommittee Heart disease and stroke statistics—2012 update: A report from the American Heart Association. Circulation. 2012;125:e2–e220. doi: 10.1161/CIR.0b013e31823ac046. [DOI] [PMC free article] [PubMed] [Google Scholar]
- 50.Chambless L.E., Folsom A.R., Sharrett A.R., Sorlie P., Couper D., Szklo M., Nieto F.J. Coronary heart disease risk prediction in the Atherosclerosis Risk in Communities (ARIC) study. J. Clin. Epidemiol. 2003;56:880–890. doi: 10.1016/s0895-4356(03)00055-6. [DOI] [PubMed] [Google Scholar]
- 51.Chambless L.E., Heiss G., Shahar E., Earp M.J., Toole J. Prediction of ischemic stroke risk in the Atherosclerosis Risk in Communities Study. Am. J. Epidemiol. 2004;160:259–269. doi: 10.1093/aje/kwh189. [DOI] [PubMed] [Google Scholar]
- 52.DeBoer M.D., Gurka M.J., Sumner A.E. Diagnosis of the metabolic syndrome is associated with disproportionately high levels of high-sensitivity C-reactive protein in non-Hispanic black adolescents: An analysis of NHANES 1999-2008. Diabetes Care. 2011;34:734–740. doi: 10.2337/dc10-1877. [DOI] [PMC free article] [PubMed] [Google Scholar]
- 53.Hingorani A.D., Casas J.P., Interleukin-6 Receptor Mendelian Randomisation Analysis (IL6R MR) Consortium The interleukin-6 receptor as a target for prevention of coronary heart disease: A mendelian randomisation analysis. Lancet. 2012;379:1214–1224. doi: 10.1016/S0140-6736(12)60110-X. [DOI] [PMC free article] [PubMed] [Google Scholar]
Associated Data
This section collects any data citations, data availability statements, or supplementary materials included in this article.