

Abstract
DNA methylation is a pervasive epigenetic DNA modification that strongly affects chromatin regulation and gene expression. To date, it remains largely unknown how patterns of DNA methylation differ between closely related species and whether such differences contribute to species-specific phenotypes. To investigate these questions, we generated nucleotide-resolution whole-genome methylation maps of the prefrontal cortex of multiple humans and chimpanzees. Levels and patterns of DNA methylation vary across individuals within species according to the age and the sex of the individuals. We also found extensive species-level divergence in patterns of DNA methylation and that hundreds of genes exhibit significantly lower levels of promoter methylation in the human brain than in the chimpanzee brain. Furthermore, we investigated the functional consequences of methylation differences in humans and chimpanzees by integrating data on gene expression generated with next-generation sequencing methods, and we found a strong relationship between differential methylation and gene expression. Finally, we found that differentially methylated genes are strikingly enriched with loci associated with neurological disorders, psychological disorders, and cancers. Our results demonstrate that differential DNA methylation might be an important molecular mechanism driving gene-expression divergence between human and chimpanzee brains and might potentially contribute to the evolution of disease vulnerabilities. Thus, comparative studies of humans and chimpanzees stand to identify key epigenomic modifications underlying the evolution of human-specific traits.
Introduction
DNA methylation is a crucial epigenetic modification of genomic DNA found in many taxa. Studies on mammalian model organisms have established several critical functional roles of DNA methylation. In the human and mouse genomes, DNA methylation is involved in developmental and regulatory processes, such as genomic imprinting, X chromosome inactivation, chromatin compaction, and transcriptional silencing.1 Impairment of DNA-methylation patterns results in devastating phenotypic consequences: the knockout of enzymes responsible for DNA methylation results in embryonic lethality in mice.2,3 In humans, aberrant DNA methylation is implicated in several neurodevelopmental syndromes and cancers.4,5 DNA methylation is also phylogenetically widespread. In particular, although some animal taxa lack DNA methylation (most notably the model invertebrates Drosophila melanogaster and Caenorhabditis elegans), emerging genome projects have increasingly demonstrated the conservation of basic DNA-methylation machineries and the presence of DNA methylation in diverse animal lineages.6–9 Moreover, comparative studies of DNA methylation show that some targets of DNA methylation are conserved over extraordinarily long evolutionary timescales, indicating potentially conserved evolutionary roles of DNA methylation in different genomes.10
Despite its functional importance and the widespread conservation of some of its features, recent studies of detailed DNA-methylation maps have begun to reveal important phyletic variations in genomic DNA methylation as well.11,12 For example, vertebrate and invertebrate genomes exhibit dramatic differences in the genomic distribution and levels of DNA methylation, as well as the functional roles of DNA methylation.11–13
An important and presently unanswered question is how patterns of DNA methylation differ between closely related species and whether such differences contribute to the evolution of species-specific phenotypes. It has long been hypothesized that regulatory evolution (evolution of gene expression), rather than evolution of protein-coding sequences, is the major evolutionary force underlying divergence of species.14,15 However, elucidating the nature of molecular mechanisms underlying regulatory evolution has been a challenge. DNA methylation is well known to affect regulation of gene expression on several fronts, the most well known of which is the link between promoter methylation and silencing of transcription.1 DNA methylation is also implicated in other aspects of regulation, including transcript composition.16,17 Given the significance of DNA methylation for the regulation of gene expression, we hypothesize that DNA methylation serves as an important determinant of regulatory evolution underlying species divergence.
To explore this hypothesis, we investigate here the differences in nucleotide-resolution, genome-wide methylation maps of the prefrontal cortex of multiple humans and chimpanzees by using the whole-genome sequencing of bisulfite-converted DNA (“methyl-C-seq”). The methyl-C-seq method represents a vast improvement from previous methods that are low resolution (such as high-performance liquid chromatography [HPLC]) or that focus on specific genomic regions, such as CpG islands, (e.g., array-based methods or enrichments) because it provides an unbiased, comprehensive, and highest-resolution map of genome-wide DNA methylation.18–21 This method is also a superior choice for comparative studies for several reasons; for example, using methylation arrays designed for the human genome is potentially problematic when applied to other species because of the divergence of underlying genomic sequences. In comparison, the methyl-C-seq method does not depend on underlying sequences, thus making it ideal to be used in comparisons of genome-wide patterns of DNA methylation between species. In addition, because the methyl-C-seq approach enables the methylation frequency of each cytosine to be estimated independently, we can evaluate global differences between methylation maps of different tissues and species.
Indeed, using the methyl-C-seq method, we discovered several significant patterns in the brain methylation maps, and we infer potential global-level differences between the brain DNA-methylation maps of humans and chimpanzees. Integrating data on DNA methylation with newly generated data on gene expression, we show that changes in DNA methylation at least partially explain the divergence of gene-expression patterns in human and chimpanzee brains. Furthermore, differentially methylated genes show striking associations with specific neurological and psychological disorders and cancers, suggesting that changes of DNA methylation might be linked to the evolution of human-specific disease vulnerabilities.
Materials and Methods
Generating Methyl-C-Seq Libraries
Regions of prefrontal cortex were dissected out of postmortem brains of three humans (Homo sapiens) and three chimpanzees (Pan troglodytes) (Table S1, available online). Chimpanzee samples came from animals that died of natural causes or were euthanized for humane reasons at the Yerkes National Primate Research Center, and all procedures involving these animals conformed to guidelines established by the Yerkes Institutional Animal Care and Use Committee. Human brain samples were obtained from the Maryland Brain and Tissue Bank from individuals who died of causes unrelated to neurological disorders.
Methyl-C-seq libraries for Illumina sequencing were custom constructed (Alpha Biolaboratory, Burlingame, CA) according to Lister et al.21 with minor modifications. In brief, ∼1 μg of genomic DNA was fragmented by sonication, end repaired, and ligated to custom-synthesized methylated adapters (Eurofins MWG Operon, Huntsville, AL) according to the manufacturer’s (Illumina, San Diego, CA) instructions. Adaptor-ligated libraries were subjected to two successive treatments of sodium bisulfite conversion with the EpiTect Bisulfite kit (QIAGEN, Valencia, CA) as outlined in the manufacturer’s instructions. Five to ten nanograms of bisulfite-converted libraries was PCR amplified with the following condition: 2.5 U of ExTaq DNA polymerase (Takara), 5 μl of 10X Extaq reaction buffer, 25 μM dNTPs, 1 μl Primer 1.1, and 1 μl Primer 2.1 (50 μl final). The thermocyling was as follows: 95°C for 3 min and then 14–16 cycles each of 95°C for 30 s, 65°C for 30 s, and 72°C for 60 s. The enriched libraries were purified twice with the solid-phase reversible immobilization (SPRI) method with AMPure beads (Beckman Coulter, Brea, CA). We assessed the library quality by randomly subcloning and sequencing ∼20–30 colonies to check for proper library construction and bisulfite conversion. The quality-controlled bisulfite-converted methyl-C-Seq libraries were then sequenced at the UC Berkeley Genome Center and Emory Genome Sequencing Laboratory with the Illumina Genome Analyzer II and the Illumina Hi-Seq, respectively. After quality control, the reads per lane ranged between 15 and 70 million reads. The average phred quality score for each read was 37.
Mapping and Annotation
We first converted all C’s to T’s both in the reads and in the reference genomes, and we then aligned the converted reads to the converted reference genomes by using the Bowtie algorithm.22 The assembly versions of the reference genome we used for mapping are GRCh37/HG19 for humans and CGSC2.1/panTro2 for chimpanzees. Total mapped reads accounted for 1.03 × 10¹¹ (humans) and 9.80 × 10¹⁰ (chimpanzees) nucleotides, providing 34.3× and 32.6× species-level coverages for human and chimpanzee haploid genomes, respectively.
For comparative analyses of human and chimpanzee methylation profiles, we utilized the data sets from the Chimpanzee Sequencing and Analysis Consortium,23 consisting of 13,454 human-chimpanzee orthologous gene pairs. The orthology of these gene alignments was considered unambiguous and covered the whole coding region. On the basis of these ortholog RefSeq gene IDs, we downloaded the genomic coordinates from the UCSC genome browser. Promoters were defined as regions 1.5 kb upstream and 0.5 kb downstream of the transcription start sites. Gene bodies were defined as those encompassing the region from the transcription start site to the transcription end site. GeneTrail24 and the DAVID tools25 were used for the functional annotation enrichment and disease association tests.
Identification of Methylated Cytosines Accounting for False-Positive Rates
We estimated the error rate (nonconversion rate plus sequencing-error frequency), p, from the number of cytosine bases sequenced in reference cytosine positions in the unmethylated Lambda genome. Error rates estimated from these were between 0.0013 and 0.0017. We controlled the number of false-positive methylcytosine calls below 0.1% of the total number of methylcytosines as follows: the minimum threshold number of cytosines sequenced at each reference cytosine position at which the position could be called as methylated is equal to (n × p) / (α(1 − p) + p), where n is the read depth for that site, p is the error rate, and α is a predefined false-discovery value (0.001 for our case).
Levels of DNA methylation were calculated by two methods. First, in a false-discovery rate (FDR) method, each reference cytosine was examined and labeled as methylated or unmethylated according to the criterion that the number of false-positive methylcytosine calls should be below 0.1% (see above). In the second method, we calculated the “fractional methylation” values of each cytosine;12,21 these values are defined as the total number of “C” reads / (total number of “C” reads + total number of “T” reads). Results from these two methods were highly similar, and the results from the latter method are shown in the main text unless otherwise specified. We discarded those sites with read depths of less than 3. Results from before or after duplicates were removed with the Rmdup tool in the Samtools package26 were highly similar.
Digital Gene-Expression Profiling Data
Frozen tissue samples from postmortem brains of six humans and six chimpanzees were used (Table S2). Human and chimpanzee individuals died of causes unrelated to neurological disorders. Samples were dissected either from fresh tissue at the time of brain procurement or later on dry ice from frozen tissue pieces from the prefrontal cortex region of the frontal pole. Total RNA was extracted with QIAGEN’s RNeasy or miRNeasy kits according to the manufacturer’s instructions. All RNA samples were examined for quantity and quality by NanoDrop and Bioanalyzer (Agilent). Sequencing libraries were generated from DpnII-digested poly-A enriched RNA according to the manufacturer’s (Illumina) instructions. BFAST27 was used for aligning 20 bp reads to both the genome and RefSeq of the respective species. We allowed up to one mismatch with the reference genome in any location within the read. Only reads that aligned to one location in the genome were used for analysis. Alignments to multiple isoforms of a gene were collapsed across gene symbol, and the maximum number of reads for a given isoform was used. A gene was considered “present” if every individual of a species for a given brain region had at least two reads aligned to the gene. For differential expression analysis, a gene had to be present in at least one of the species being compared. Reads were normalized with quantile normalization.
To examine whether there were any underlying batch effects in our data, we processed all samples from both species together. Analysis of variance28 of sample traits via univariate linear regression analysis with the first principal component as outcome revealed that species was the most significant sample covariate and was followed by individual and then age. Technical variation sources, including postmortem interval, RNA batch, run batch, and library batch, were not significant, similar to a previous study.29 Statistical significance of differentially expressed genes was determined with a Bayesian t test.30 We also performed a two-sample permutation test between human and chimpanzee expression values and compared it to the p value from our original method. At the 5% significance level, approximately 92% of genes showed a concordant pattern between these two methods. For the inconsistent genes, most were significant from the permutation test and weakly significant from our original method.
Comparative Human Methylome Analysis among Different Tissues
We compared the human prefrontal cortex (brain) methylome that had the highest mean read depth and lowest duplicate read count (Hs1570) to methylomes generated from human embryonic stem cells (ESCs),18 human neonatal foreskin fibroblasts,18 and human peripheral-blood mononuclear cells (PBMCs).19 Methylation data from other tissues and cell lines were obtained from respective publications. In brief, the ESCs were derived from a WA09 hESC line,31 were cultured feeder free on Matrigel (Becton Dickinson) in StemPro medium (Lifetech), and were passaged with Accutase (Lifetech). The neonatal fibroblast cell lines were obtained from GlobalStem (newborn human foreskin fibroblasts, untreated) and were harvested for analysis at passage 13. The human PBMCs were obtained from the same individual as in the YanHuang project, which is the first finished diploid genome sequence of an Asian individual.19
Methylome data on ESCs, neonatal fibroblasts, and PBMCs were downloaded from the Gene Expression Omnibus, and coordinates were converted from human genome build hg18 to hg19 with the UCSC liftover tool. Bisulfite-converted sequence data were merged for all CG dinucleotides and CH dinucleotides (H = A, C, or T) that had at least three strand-specific reads in each of the four methylomes being compared. Mean fractional methylation of annotated elements was calculated as the mean of fractional methylation values for each site within the annotated element.
Results
Genome-wide DNA-Methylation Patterns Reveal Extremely Heavily Methylated Brains
We generated whole-genome, nucleotide-resolution DNA-methylation maps (methylomes) from prefrontal cortex samples of three humans and three chimpanzees by sequencing bisulfite-converted genomic DNA (Materials and Methods and Table S1). Bisulfite conversion rates estimated from unmethylated lambda DNA controls indicate that our method faithfully captures patterns of genomic DNA methylation in these samples (Materials and Methods).
Prefrontal cortex methylation maps from both species reveal extremely heavy CpG methylation—between 79.4% and 82.5% of CpGs are methylated. In comparison, only minor fractions of non-CpG sites (1.3%–2.2%) are methylated (Figure 1). Consistent with other tissues and species,11,12,21 DNA-methylation levels across transcription units in the prefrontal cortex exhibit distinctive patterns: there are low methylation levels in DNA surrounding the transcription start site, higher levels along the transcribed unit (gene body), and decreased levels near the transcription termination site (Figure S1). Among genomic regions, promoters and CpG islands are generally hypomethylated (Figure 1 and Figures S2 and S3). Transposable elements are the most heavily methylated in both species (Figure 1C), supporting the idea that DNA methylation suppresses proliferation of transposons in these genomes.32
Figure 1.
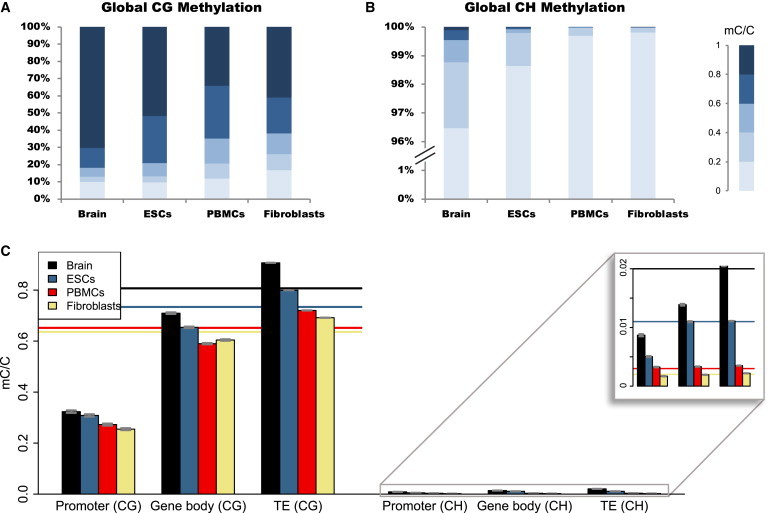
Differences in DNA-Methylation Levels among Human Tissues and Genomic Features
(A) Proportional representation of genome-wide DNA-methylation levels for individual CG dinucleotides in the human prefrontal cortex (brain), ESCs,18 neonatal fibroblasts,18 and PBMCs.19
(B) Same analyses as in (A) but for CH dinucleotide context (H = A, T, or C).
(C) Mean methylation levels in each tissue for gene promoters (CG context, n = 18,416; CH context, n = 18,584), gene bodies (CG context, n = 18,477; CH context, n = 18,656), and transposable elements (CG context, n = 1,837,431; CH context, n = 2,989,765). Horizontal lines indicate global means of methylation levels for individual CG sites (main panel) or CH sites (inset). Error bars indicate 95% confidence intervals of the mean.
To gauge tissue-specific differences in levels of DNA methylation, we compared the methylation maps of the human prefrontal cortex to those from three other tissues, including ESCs, neonatal fibroblasts, and PBMCs (Figure 1). These methylomes were generated with similar methods, facilitating a direct comparison of overall levels of DNA methylation among tissues.18,19 Our analysis reveals that the prefrontal cortex is the most heavily methylated of these four tissues (Figure 1). A high level of methylation in the prefrontal cortex is consistent throughout different genomic regions and across different cytosine classes (Figure 1 and Figures S4 and S5).
Interspecies and Intraspecies Variation of Genome-wide Patterns of DNA Methylation
Genome-wide brain methylation maps of humans and chimpanzees exhibit intriguing intraspecies and interspecies variations (Figure 2). In terms of intraspecies variation, we found that the prefrontal cortex samples from younger individuals exhibit generally higher levels of DNA methylation in both species (Figure 2C and 2D). For example, the chimpanzee individuals are 24, 27, and 43 years of age. At the genome-wide level, the third (43-year-old) individual exhibits slightly but significantly lower methylation than the other individuals. In human samples, a younger (31-year-old) individual is overall more heavily methylated than the other two individuals of ages 47 and 48 years. However, given the small sample size, these results should be taken with caution and need to be validated in a study with a larger number of individuals spanning greater variation of ages. Furthermore, the within-species variation of methylation is also confounded by the methylation difference between genders. It has been demonstrated that methylation levels on the X chromosome exhibit a significant gender effect.33 We observed similar results (Figure S6 and S7). However, our results do not change when data from the X chromosome are excluded (Figure S8 and S9).
Figure 2.

Between- and Within-Species Variation of Genomic DNA Methylation in Human and Chimpanzee Prefrontal Cortex Regions
Principal-component analyses of (A) promoters and (B) gene bodies of human-chimpanzee orthologs23 demonstrate that the patterns of DNA methylation are distinct between humans and chimpanzees. For promoters, the first principal component, which explains 46.1% of variation, distinguishes samples from human and chimpanzees. The second principal component, explaining 27.7% of total variation, separates two human samples from the third one. For gene bodies, the first principal component (explaining 42.8% of total variation) separates the third human from the rest, whereas the second principal component (explaining 22.6% of total variation) separates the human and chimpanzee brains. Hierarchical clustering analyses of (C) promoters and (D) gene bodies demonstrate that the overall levels of methylation are lower in human brains than in the chimpanzee brains. The youngest human individual (H3) exhibits the most distinctive pattern of DNA methylation. The error bars indicate 95% confidence intervals of the mean.
Despite the substantial intraspecies variation of DNA methylation, we detected interesting divergence between the human and chimpanzee prefrontal methylation maps. Principal-component analyses of DNA-methylation levels of promoters and gene bodies of human-chimpanzee orthologs demonstrate that major principal components separate humans and chimpanzees (Figures 2A and 2B). A previous study reported that human brains are more heavily methylated than chimpanzee brains on the basis of a limited number of CpG dinucleotides (145 CpGs from 36 genes).34 Our data do not support this finding (Figures 2C and 2D). In our data, there is higher methylation in the chimpanzee brains than in the human brains (the average fractional methylation levels of CpG dinucleotides in the human and chimpanzee genomes are 80.9% (±0.036% standard error [SE]) and 82.1% (±0.034% SE), respectively (Mann-Whitney test, p < 10−15). An analysis of the specific CpG sites included in the previous study34 revealed no difference between the two species in our data (Table S3). The difference might in part be due to the fact that the previous study used a low-resolution methylation array developed specifically for the human genome.34
Distinctive Patterns of Promoter Methylation, Functional Enrichment, and Disease Association
Previous studies determined that DNA methylation in vertebrate promoters occurs in a discrete fashion—these promoters can be classified as hypermethylated and hypomethylated.35,36 In accordance with these studies, promoter DNA methylation in human and chimpanzee brains falls into distinct hypermethylated and hypomethylated classes (Figure 3A). In comparison, gene bodies are generally heavily methylated in the prefrontal cortex of both species (Figure 3B), which is expected under “global” patterns of genomic DNA methylation.13,35 Levels of DNA methylation in promoters and gene bodies are clearly lower in the human brain than in the chimpanzee brain (Figure 3A and 3B), a difference that is especially marked for promoters (Figures 3A and 3C and Figure S2), which on average exhibit 23% less methylation in humans than in chimpanzees (Figure S2).
Figure 3.
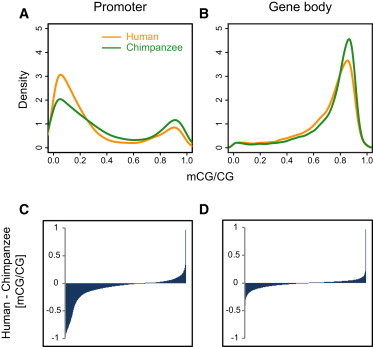
Patterns of DNA Methylation in Genic Regions Influence Gene Expression
Density plots of (A) promoter and (B) gene-body DNA methylation from humans and chimpanzees. Promoter DNA methylation exhibits distinctive “bimodal” patterns previously observed.35,36 In comparison, gene bodies of both species are heavily methylated (B). DNA-methylation-level differences, measured as the mean of human methylation levels minus the mean of chimpanzee methylation levels, show that promoters particularly exhibit lower levels of DNA methylation in the human brain than in the chimpanzee brain (C). In contrast, gene bodies show similar levels of DNA methylation between species (D).
To identify significantly differentially methylated promoters between human and chimpanzee brains, we performed the following tests. First, we performed a Fisher’s exact test by using the total numbers of methylated and unmethylated CpG sites in all samples and calculated adjusted p values by the FDR method for multiple testing.37,38 Then, from the pool of significantly differentially methylated promoters obtained by this test, we further classified genes into those with hypermethylated (defined as fractional methylation levels > 0.8) or hypomethylated (fractional methylation levels < 0.2) promoters35,36 (Figure 3). From these gene sets, we identified 474 genes whose promoters had “switched” between the hypermethylated and hypomethylated classes between the human and chimpanzee brains. In the majority (n = 468) of these promoters, human brains exhibit conspicuously lower levels of DNA methylation than do chimpanzee brains (Table S4). Interestingly, these genes are significantly enriched in molecular functions such as protein binding and phosphotransferase activity (Table 1). Moreover, they exhibit striking associations with several disorders, including neurological and psychological disorders and cancers. For example, genes whose variants are associated with autism are 3.5-fold enriched in this group of genes (although not significantly so because of the small number of genes [Table 2]). The six genes exhibiting hypermethylation of human promoters compared to the chimpanzee promoters also include several genes whose variants are linked to disease (Table S5).
Table 1.
Genes Whose Promoters Are Hypomethylated in the Human Brain but Hypermethylated in the Chimpanzee Brain Are Enriched in Specific Gene Ontology Terms
| GO Terms | GO Accession Number | p Value (FDR) |
|---|---|---|
| Cellular process | GO:0009987 | 7.2 × 10⁻⁵ |
| Protein binding | GO:0005515 | 1.8 × 10⁻⁴ |
| Cellular macromolecule metabolic process | GO:0044260 | 1.9 × 10⁻³ |
| Cellular metabolic process | GO:0044237 | 4.3 × 10⁻³ |
| Transferase activity, transferring phosphorus-containing groups | GO:0016772 | 1.0 × 10⁻² |
The number of genes analyzed is 468. The following abbreviations are used: GO, Gene Ontology; and FDR, false-discovery rate.
Table 2.
Disease-Associated Genes Are Enriched among Genes Whose Promoters Are Hypomethylated in the Human Brain but Hypermethylated in the Chimpanzee Brain
| Category | Count | Fold Enrichment | Genes |
|---|---|---|---|
| Neural-tube defects | 5 | 4.7 | PDGFRA (MIM 173490), SHMT1 (MIM 182144), TYMS (MIM 188350), DHFR (MIM 126060), CXCL6 (MIM 138965) |
| Autism | 6 | 3.5 | GABRA2 (MIM 137140), GSTM1 (MIM 138350), SLC6A4 (MIM 182138), ACCN1 (MIM 601784), CLOCK (MIM 601851), GABRG1 (MIM 137166) |
| Alcohol dependence | 4 | 5.0 | GABRA2 (MIM 137140), SLC6A4, GABRB1 (MIM 137190), GABRG1 |
| Chemodependency | 9 | 2.0 | GABRA2, GSTM1, SLC6A4, GABRB1, CLOCK, SCN5A (MIM 600163), HOMER1 (MIM 604798), GABRG1, CRTC1 (MIM 607536) |
| Cancer | 27 | 1.3 | HPSE (MIM 604724), IRAK4 (MIM 606883), TES (MIM 606085), KIT (MIM 164920), RECQL (MIM 600537), DHFR, KDR (MIM 191306), IKZF3 (MIM 606221), RAD51D (MIM 602954), CDK4 (MIM 123829), CSF1 (MIM 120420), LIG3 (MIM 600940), SUOX (MIM 606887), CXCL5 (MIM 600324), NRAS (MIM 164790), PDGFRA, GHR, RASSF8 (MIM 608231), TYMS, POLR2B (MIM 180661), VDR (MIM 601769), SLC6A4, GSTM1, SHMT1 (MIM 182144), STARD3 (MIM 607048), IGFBP7, POLK (MIM 605650) |
The total number of genes is 468.
The above-described method for identifying differentially methylated promoters is perhaps overly stringent. Thus, we developed a second method, based on the relative difference in promoter methylation, to identify differentially methylated promoters. Beginning with genes for which Fisher’s exact test with the FDR method was significant, we first defined genes whose relative methylation levels had changed more than 50%; in other words, genes for which |(chimp fractional methylation level − human fractional methylation level)/(chimp fractional methylation level + human fractional methylation level)| is greater than 0.5. We further restricted analysis to genes for which the absolute difference between the fractional methylation levels of humans and chimpanzees is greater than 0.2. Using this method, we identified 1,055 genes that are significantly less methylated in the human brain than in the chimpanzee brain. Analyses of these promoters again demonstrate patterns of functional enrichment and disease association similar to the above results (Tables S6 and S7).
DNA Methylation and Gene Expression in the Human and Chimpanzee Brains
A well-known consequence of DNA methylation is its effect on the regulation of gene expression.36,39 Furthermore, differential expression of genes in humans and chimpanzees might drive lineage-specific patterns of evolution.15,40,41 Given the profound influence of promoter DNA methylation on the regulation of gene expression, we asked whether changes of DNA methylation might underlie gene-expression divergence between human and chimpanzee brains. To address this question, we integrated data on DNA methylation with data on gene expression from the human and chimpanzee prefrontal cortex; these latter data were generated with a next-generation sequencing method, digital gene-expression profiling (DGEP [Material and Methods]).
Levels of DNA methylation from promoters and gene bodies are each significantly negatively correlated with levels of gene expression (Spearman’s correlation coefficients range between −0.18 and approximately −0.24, as shown in Figure 4). Several recent studies demonstrated a “bell shape” relationship between gene expression and methylation—the most heavily methylated gene bodies are often expressed at intermediate levels, and genes expressed at high and low levels are moderately methylated.11,12 However, in the prefrontal cortex samples, gene-body methylation decreases roughly linearly with increasing levels of gene expression in both species (Figures 4B and 4D). This finding is similar to a recent study in which a linear and negative relationship between gene expression and DNA methylation in the brain (both the occipital lobe and whole brain) was reported.39 Thus, the effect of gene-body DNA methylation on gene expression is not universal across different tissues.39
Figure 4.

DNA Methylation Is Negatively Correlated with Gene-Expression Level in Both Promoters and Gene Bodies in the Prefrontal Cortex
Integrating levels of DNA methylation with levels of gene expression measured by digital gene-expression profiling, we observe a negative correlation between human gene-expression level and both (A) human promoter methylation (Spearman’s correlation coefficient r = −0.24, p < 10−15) and (B) human gene-body methylation (r = −0.18, p < 10−15). The x axis represents increasing levels of gene expression from left to right. We also observe a negative correlation between chimpanzee gene-expression level and both (C) chimpanzee promoter methylation (r = −0.19, p < 10−15) and (D) chimpanzee gene-body methylation (r = −0.20, p < 10−15).
Among the genes whose promoters are hypomethylated in the human brain but hypermethylated in the chimpanzee brain, expression-level data are available for 273 genes. A majority of these exhibit higher expression in the human brain than in the chimpanzee brain (168 out of 273, p < 10−4, binomial test). In comparison, none of the three genes whose promoters are hypermethylated in humans compared to chimpanzees exhibit increased expression in humans. When we restrict our analyses to genes with expression patterns that are significantly different between human and chimpanzee brains (Bayesian t test, p < 0.05),42 the same pattern is observed: 41 out of 58 genes with significantly hypomethylated promoters in humans compared to chimpanzees exhibit higher levels of expression in humans (p < 10−4). Thus, differential promoter methylation between humans and chimpanzees manifests in different transcriptional levels (Figure 5A).
Figure 5.
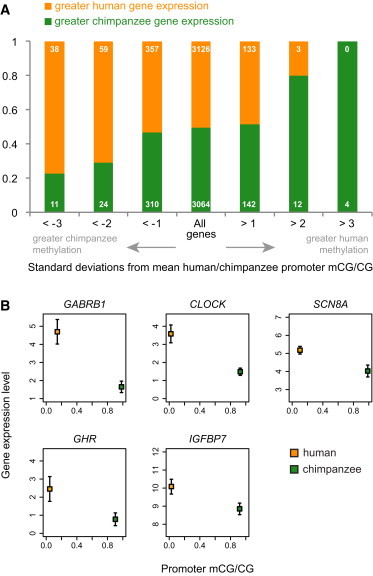
Differences in Promoter Methylation Are Associated with Differences in Gene Expression between the Human and Chimpanzee Prefrontal Cortex
(A) The proportion of genes with higher or lower expression values in humans, as compared to chimpanzees, in the prefrontal cortex. Each bar represents a class of genes and is based on the number of standard deviations from the mean of methylation measures in human versus chimpanzee promoters in the prefrontal cortex.
(B) Selected genes with hypomethylated promoters in humans, hypermethylated promoters in chimpanzees, and significantly higher expression in humans than in chimpanzees. Error bars represent 95% confidence intervals of the mean (n = 6). Gamma-aminobutyric acid (GABA) A receptor, beta 1 (GABRB1 [MIM 137190]) is involved in neurotransmission of the CNS. Clock homolog (mouse) (CLOCK [MIM 601851]) encodes a transcription factor essential to the circadian rhythm. SCN8A facilitates the generation of action potentials in neurons and other cells. Growth hormone receptor (GHR [MIM 600946]) is integral to activating insulin-like growth-factor production, leading to growth. IGFBP7 regulates insulin-like growth-factor availability and receptor binding.
Again, we find that many of these genes are implicated in neurological functions and disorders (Figure 5B). For example, insulin-like growth-factor binding protein 7 (IGFBP7 [MIM 602867]) regulates insulin-like growth-factor availability and receptor binding and is implicated in the extinction of fear memories and neurogenesis.43 Methylation levels of IGFBP7 promoters are dramatically different between the human and chimpanzee brains, and the expression of this gene exhibits a pattern concordant with the methylation pattern (Figure 5). In another example, the sodium channel, voltage gated, type VIII alpha subunit (SCN8A [MIM 600702]) is implicated in wide-ranging neurological and behavioral disorders and cognitive impairment44,45 and is also hypomethylated and significantly more strongly expressed in the human brain than in the chimpanzee brain (Figure 5).
Discussion
Recent technical advances have enabled us to examine genomic variation of DNA methylation at the nucleotide level,18–20 allowing us to see highly complex and dynamic tissue- and cell-type-specific patterns of genomic DNA methylation. In parallel, new functional studies are illuminating multifaceted connections between DNA methylation and regulation of gene expression. In addition to being involved in the well-known effect of promoter methylation in silencing gene expression,36 DNA methylation is also implicated in the regulation of alternative splicing16,17 and the regulation of miRNA.46 Thus, DNA methylation harbors a strong potential to influence regulatory divergence between species.
To elucidate the evolutionary significance of DNA methylation, in this study we examined the differences in genome-wide DNA-methylation maps of human and chimpanzee brains and their consequences on gene-expression divergence. A few studies have previously investigated methylation difference between humans and nonhuman primates, but these studies either examined an extremely limited number of sites or used methods that are low resolution and potentially biased because of underlying sequence differences.34,47,48 In contrast, we used the methyl-C-seq method to resolve detailed patterns of genomic DNA methylation at individual nucleotide resolution.
One of the advantages of the methyl-C-seq method is that it allows us to infer methylation frequencies of individual CpGs quantitatively.18 Our DNA-methylation maps reveal the prefrontal cortex to be the most heavily methylated tissue investigated so far (Figure 1). Our results stand in contrast to the hypothesis that DNA methylation decreases in conjunction with cellular differentiation.18 Rather, our study suggests that DNA-methylation patterns undergo dynamic reprogramming in a tissue- and cell-type-specific manner. The striking enrichment of DNA methylation in the brain (Figure 1) also has important evolutionary implications. It has been shown repeatedly that genes expressed in the brain are, on average, the most evolutionarily constrained in terms of both sequence evolution and gene–expression patterns.41,49 The observation that the brain is the most heavily methylated among the tissues investigated so far suggests that DNA methylation might contribute to the constraints on sequence and expression evolution possibly by suppressing gene-expression noise.13,16 Similarly, heavy methylation of transposable elements in the brain might indicate particularly strong silencing of transposable elements.32
We observed intriguing within- and between-species variation of DNA methylation in the brains of humans and chimpanzees. In both species, samples from younger individuals (31 years old versus 47 and 48 years old in humans; 24 and 27 years old versus 43 years old in chimpanzees) tend to exhibit heavier DNA methylation than do older individuals (Figure 2). Previous studies investigating limited numbers of CpG sites or genes reported both increases and decreases of DNA methylation with aging.33,50–53 Our data, although representing genome-wide analyses of CpG sites, consist of only three individuals with relatively similar ages per species and thus should be considered with caution. Nevertheless, it is interesting to note that studies analyzing CpG islands have generally reported increased DNA methylation with increasing age,33,53 whereas other studies reported that CpGs that are not in a CpG-island context tend to lose DNA methylation with aging.52
The overall patterns of DNA methylation differ between human and chimpanzee brains: notably, the chimpanzee brains exhibited higher DNA methylation levels than did human brains. Our results are in accord with an earlier study that used HPLC to quantify the levels of methylcytosines from the brains of humans, macaques, African green monkeys, and squirrel monkeys and showed that the human brain exhibited the least amount of methylcytosines among these species.47 However, the facts that DNA methylation varies with age and that it is not straightforward to “match” ages between human and chimpanzee samples caution against drawing a general conclusion from the limited number of samples used in this study. Nevertheless, it is notable that the species-level difference between humans and chimpanzees is the most pronounced in promoters (Figure 3 and Figure S2). Given the observation that human promoters are generally hypomethylated when compared to chimpanzee promoters, the increase of gene expression in the human brains compared to the brains of chimpanzees54–56 might be partially mediated by an overall decrease of DNA methylation, particularly in promoters. Future analyses of outgroup primates, such as Old World monkeys, will help elucidate lineage-specific changes in these epigenetic modifications.
Furthermore, promoters that are significantly differentially methylated between the brains of humans and chimpanzees (most of these promoters are hypomethylated in human brains compared to chimpanzee brains) are enriched in several functional categories, including protein binding and cellular metabolic processes. Strikingly, the list of genes harboring differentially methylated promoters includes disproportionately high numbers of those associated with human diseases (Table 2). In particular, this list of disease includes neurodevelopmental and psychological disorders, such as neural-tube defects, autism, and alcohol and other chemical dependencies. Interestingly, they represent a characteristic set of diseases to which modern humans are particularly susceptible.57 This suggests that methylation differences between human and chimpanzee brains might have significant functional consequences and potentially bear relevance to the evolution of human-specific disease vulnerabilities. Given that DNA methylation functions as a modulator of environmental signals to cellular regulatory machineries,58,59 comparative epigenomic studies like ours will allow us to better understand both the genetic and environmental contributions to species differences. Thus, our results highlight the utility of comparative studies in identifying key epigenomic modifications underlying human-specific phenotypes, including disease vulnerabilities.
Acknowledgments
We thank the Georgia Tech Office of Information and Technology and the Emory Genome Core for technical assistance. Human tissue was obtained from the National Institute of Child Health and Human Development (NICHD) Brain and Tissue Bank for Developmental Disorders at the University of Maryland (NICHD contract numbers N01-HD-4-3368 and N01-HD-4-3383). The role of the NICHD Brain and Tissue Bank is to distribute tissue, and it therefore cannot endorse the studies performed or the interpretation of results. This study was supported by the Yerkes National Primate Research Center funded by the National Center for Research Resources P51RR165, and it is currently supported by the Office of Research Infrastructure Programs/OD P51OD11132, by NIH/NIA (5P01 AG026423-03), by the James S. McDonnell Foundation’s 21st Century Science Initiative (JSMF 21002093) to T.P. and D.H.G., by National Institute of Mental Health grants MH060233:05 and MH094714-01 to D.H.G., and by the Georgia Tech Fund for Innovation in Research and Education (GT-FIRE) and National Science Foundation grants (MCB-0950896 and BCS-0751481) to S.V.Y.
Supplemental Data
Web Resources
The URL for data presented herein is as follows:
Online Mendelian Inheritance in Man (OMIM), http://www.omim.org
Accession Numbers
Data are available at the Gene Expression Omnibus. The accession number for methyl-C-seq data is GSE37202. The accession number for DGEP is GSE33588. Processed data are available from the corresponding author’s website (http://www.yilab.gatech.edu).
References
- 1.Jones P.A., Takai D. The role of DNA methylation in mammalian epigenetics. Science. 2001;293:1068–1070. doi: 10.1126/science.1063852. [DOI] [PubMed] [Google Scholar]
- 2.Li E., Bestor T.H., Jaenisch R. Targeted mutation of the DNA methyltransferase gene results in embryonic lethality. Cell. 1992;69:915–926. doi: 10.1016/0092-8674(92)90611-f. [DOI] [PubMed] [Google Scholar]
- 3.Okano M., Bell D.W., Haber D.A., Li E. DNA methyltransferases Dnmt3a and Dnmt3b are essential for de novo methylation and mammalian development. Cell. 1999;99:247–257. doi: 10.1016/s0092-8674(00)81656-6. [DOI] [PubMed] [Google Scholar]
- 4.Portela A., Esteller M. Epigenetic modifications and human disease. Nat. Biotechnol. 2010;28:1057–1068. doi: 10.1038/nbt.1685. [DOI] [PubMed] [Google Scholar]
- 5.Robertson K.D. DNA methylation and human disease. Nat. Rev. Genet. 2005;6:597–610. doi: 10.1038/nrg1655. [DOI] [PubMed] [Google Scholar]
- 6.Grbić M., Van Leeuwen T., Clark R.M., Rombauts S., Rouzé P., Grbić V., Osborne E.J., Dermauw W., Ngoc P.C., Ortego F. The genome of Tetranychus urticae reveals herbivorous pest adaptations. Nature. 2011;479:487–492. doi: 10.1038/nature10640. [DOI] [PMC free article] [PubMed] [Google Scholar]
- 7.Wang Y., Jorda M., Jones P.L., Maleszka R., Ling X., Robertson H.M., Mizzen C.A., Peinado M.A., Robinson G.E. Functional CpG methylation system in a social insect. Science. 2006;314:645–647. doi: 10.1126/science.1135213. [DOI] [PubMed] [Google Scholar]
- 8.Werren J.H., Richards S., Desjardins C.A., Niehuis O., Gadau J., Colbourne J.K., Werren J.H., Richards S., Desjardins C.A., Niehuis O., Nasonia Genome Working Group Functional and evolutionary insights from the genomes of three parasitoid Nasonia species. Science. 2010;327:343–348. doi: 10.1126/science.1178028. [DOI] [PMC free article] [PubMed] [Google Scholar]
- 9.Wurm Y., Wang J., Riba-Grognuz O., Corona M., Nygaard S., Hunt B.G., Ingram K.K., Falquet L., Nipitwattanaphon M., Gotzek D. The genome of the fire ant Solenopsis invicta. Proc. Natl. Acad. Sci. USA. 2011;108:5679–5684. doi: 10.1073/pnas.1009690108. [DOI] [PMC free article] [PubMed] [Google Scholar]
- 10.Sarda S., Zeng J., Hunt B.G., Yi S.V. The evolution of invertebrate gene body methylation. Mol. Biol. Evol. 2012;29:1907–1916. doi: 10.1093/molbev/mss062. [DOI] [PubMed] [Google Scholar]
- 11.Feng S., Cokus S.J., Zhang X., Chen P.-Y., Bostick M., Goll M.G., Hetzel J., Jain J., Strauss S.H., Halpern M.E. Conservation and divergence of methylation patterning in plants and animals. Proc. Natl. Acad. Sci. USA. 2010;107:8689–8694. doi: 10.1073/pnas.1002720107. [DOI] [PMC free article] [PubMed] [Google Scholar]
- 12.Zemach A., McDaniel I.E., Silva P., Zilberman D. Genome-wide evolutionary analysis of eukaryotic DNA methylation. Science. 2010;328:916–919. doi: 10.1126/science.1186366. [DOI] [PubMed] [Google Scholar]
- 13.Suzuki M.M., Bird A. DNA methylation landscapes: Provocative insights from epigenomics. Nat. Rev. Genet. 2008;9:465–476. doi: 10.1038/nrg2341. [DOI] [PubMed] [Google Scholar]
- 14.Carroll S.B. Evolution at two levels: On genes and form. PLoS Biol. 2005;3:e245. doi: 10.1371/journal.pbio.0030245. [DOI] [PMC free article] [PubMed] [Google Scholar]
- 15.King M.-C., Wilson A.C. Evolution at two levels in humans and chimpanzees. Science. 1975;188:107–116. doi: 10.1126/science.1090005. [DOI] [PubMed] [Google Scholar]
- 16.Maunakea A.K., Nagarajan R.P., Bilenky M., Ballinger T.J., D’Souza C., Fouse S.D., Johnson B.E., Hong C., Nielsen C., Zhao Y. Conserved role of intragenic DNA methylation in regulating alternative promoters. Nature. 2010;466:253–257. doi: 10.1038/nature09165. [DOI] [PMC free article] [PubMed] [Google Scholar]
- 17.Shukla S., Kavak E., Gregory M., Imashimizu M., Shutinoski B., Kashlev M., Oberdoerffer P., Sandberg R., Oberdoerffer S. CTCF-promoted RNA polymerase II pausing links DNA methylation to splicing. Nature. 2011;479:74–79. doi: 10.1038/nature10442. [DOI] [PMC free article] [PubMed] [Google Scholar]
- 18.Laurent L., Wong E., Li G., Huynh T., Tsirigos A., Ong C.T., Low H.M., Kin Sung K.W., Rigoutsos I., Loring J., Wei C.L. Dynamic changes in the human methylome during differentiation. Genome Res. 2010;20:320–331. doi: 10.1101/gr.101907.109. [DOI] [PMC free article] [PubMed] [Google Scholar]
- 19.Li Y., Zhu J., Tian G., Li N., Li Q., Ye M., Zheng H., Yu J., Wu H., Sun J. The DNA methylome of human peripheral blood mononuclear cells. PLoS Biol. 2010;8:e1000533. doi: 10.1371/journal.pbio.1000533. [DOI] [PMC free article] [PubMed] [Google Scholar]
- 20.Lister R., Ecker J.R. Finding the fifth base: Genome-wide sequencing of cytosine methylation. Genome Res. 2009;19:959–966. doi: 10.1101/gr.083451.108. [DOI] [PMC free article] [PubMed] [Google Scholar]
- 21.Lister R., Pelizzola M., Dowen R.H., Hawkins R.D., Hon G., Tonti-Filippini J., Nery J.R., Lee L., Ye Z., Ngo Q.-M. Human DNA methylomes at base resolution show widespread epigenomic differences. Nature. 2009;462:315–322. doi: 10.1038/nature08514. [DOI] [PMC free article] [PubMed] [Google Scholar]
- 22.Langmead B., Trapnell C., Pop M., Salzberg S.L. Ultrafast and memory-efficient alignment of short DNA sequences to the human genome. Genome Biol. 2009;10:R25. doi: 10.1186/gb-2009-10-3-r25. [DOI] [PMC free article] [PubMed] [Google Scholar]
- 23.Sequencing C., Chimpanzee Sequencing and Analysis Consortium Initial sequence of the chimpanzee genome and comparison with the human genome. Nature. 2005;437:69–87. doi: 10.1038/nature04072. [DOI] [PubMed] [Google Scholar]
- 24.Backes C., Keller A., Kuentzer J., Kneissl B., Comtesse N., Elnakady Y.A., Müller R., Meese E., Lenhof H.-P. GeneTrail—advanced gene set enrichment analysis. Nucleic Acids Res. 2007;35(Web Server issue):W186–W192. doi: 10.1093/nar/gkm323. [DOI] [PMC free article] [PubMed] [Google Scholar]
- 25.Dennis G., Jr., Sherman B.T., Hosack D.A., Yang J., Gao W., Lane H.C., Lempicki R.A. DAVID: Database for Annotation, Visualization, and Integrated Discovery. Genome Biol. 2003;4:3. [PubMed] [Google Scholar]
- 26.Li H., Handsaker B., Wysoker A., Fennell T., Ruan J., Homer N., Marth G., Abecasis G., Durbin R., 1000 Genome Project Data Processing Subgroup The Sequence Alignment/Map format and SAMtools. Bioinformatics. 2009;25:2078–2079. doi: 10.1093/bioinformatics/btp352. [DOI] [PMC free article] [PubMed] [Google Scholar]
- 27.Homer N., Merriman B., Nelson S.F. BFAST: An alignment tool for large scale genome resequencing. PLoS ONE. 2009;4:e7767. doi: 10.1371/journal.pone.0007767. [DOI] [PMC free article] [PubMed] [Google Scholar]
- 28.Shi L., Campbell G., Jones W.D., Campagne F., Wen Z., Walker S.J., Su Z., Chu T.M., Goodsaid F.M., Pusztai L., MAQC Consortium The MicroArray Quality Control (MAQC)-II study of common practices for the development and validation of microarray-based predictive models. Nat. Biotechnol. 2010;28:827–838. doi: 10.1038/nbt.1665. [DOI] [PMC free article] [PubMed] [Google Scholar]
- 29.Miller J.A., Oldham M.C., Geschwind D.H. A systems level analysis of transcriptional changes in Alzheimer’s disease and normal aging. J. Neurosci. 2008;28:1410–1420. doi: 10.1523/JNEUROSCI.4098-07.2008. [DOI] [PMC free article] [PubMed] [Google Scholar]
- 30.Smyth G.K., Michaud J., Scott H.S. Use of within-array replicate spots for assessing differential expression in microarray experiments. Bioinformatics. 2005;21:2067–2075. doi: 10.1093/bioinformatics/bti270. [DOI] [PubMed] [Google Scholar]
- 31.Thomson J.A., Itskovitz-Eldor J., Shapiro S.S., Waknitz M.A., Swiergiel J.J., Marshall V.S., Jones J.M. Embryonic stem cell lines derived from human blastocysts. Science. 1998;282:1145–1147. doi: 10.1126/science.282.5391.1145. [DOI] [PubMed] [Google Scholar]
- 32.Yoder J.A., Walsh C.P., Bestor T.H. Cytosine methylation and the ecology of intragenomic parasites. Trends Genet. 1997;13:335–340. doi: 10.1016/s0168-9525(97)01181-5. [DOI] [PubMed] [Google Scholar]
- 33.Numata S., Ye T., Hyde T.M., Guitart-Navarro X., Tao R., Wininger M., Colantuoni C., Weinberger D.R., Kleinman J.E., Lipska B.K. DNA methylation signatures in development and aging of the human prefrontal cortex. Am. J. Hum. Genet. 2012;90:260–272. doi: 10.1016/j.ajhg.2011.12.020. [DOI] [PMC free article] [PubMed] [Google Scholar]
- 34.Enard W., Fassbender A., Model F., Adorján P., Pääbo S., Olek A. Differences in DNA methylation patterns between humans and chimpanzees. Curr. Biol. 2004;14:R148–R149. [PubMed] [Google Scholar]
- 35.Elango N., Yi S.V. DNA methylation and structural and functional bimodality of vertebrate promoters. Mol. Biol. Evol. 2008;25:1602–1608. doi: 10.1093/molbev/msn110. [DOI] [PubMed] [Google Scholar]
- 36.Weber M., Hellmann I., Stadler M.B., Ramos L., Pääbo S., Rebhan M., Schübeler D. Distribution, silencing potential and evolutionary impact of promoter DNA methylation in the human genome. Nat. Genet. 2007;39:457–466. doi: 10.1038/ng1990. [DOI] [PubMed] [Google Scholar]
- 37.Benjamini Y., Yekutieli D. The control of the false discovery rate in multiple testing under dependency. Ann. Stat. 2001;29:1165–1188. [Google Scholar]
- 38.Storey J.D. A direct approach to false discovery rates. J. R. Stat. Soc. Series B Stat. Methodol. 2002;64:479–498. [Google Scholar]
- 39.Aran D., Toperoff G., Rosenberg M., Hellman A. Replication timing-related and gene body-specific methylation of active human genes. Hum. Mol. Genet. 2011;20:670–680. doi: 10.1093/hmg/ddq513. [DOI] [PubMed] [Google Scholar]
- 40.Gilad Y., Oshlack A., Smyth G.K., Speed T.P., White K.P. Expression profiling in primates reveals a rapid evolution of human transcription factors. Nature. 2006;440:242–245. doi: 10.1038/nature04559. [DOI] [PubMed] [Google Scholar]
- 41.Khaitovich P., Hellmann I., Enard W., Nowick K., Leinweber M., Franz H., Weiss G., Lachmann M., Pääbo S. Parallel patterns of evolution in the genomes and transcriptomes of humans and chimpanzees. Science. 2005;309:1850–1854. doi: 10.1126/science.1108296. [DOI] [PubMed] [Google Scholar]
- 42.Smyth G.K. Limma: Linear Models for Microarray Data. In: Gentleman R., Carey V.J., Dudoit S., Irizarry R., Huber W., editors. Bioinformatics and Computational Biology Solutions Using R and Bioconductor. Springer; New York: 2005. pp. 397–420. [Google Scholar]
- 43.Agis-Balboa R.C., Arcos-Diaz D., Wittnam J., Govindarajan N., Blom K., Burkhardt S., Haladyniak U., Agbemenyah H.Y., Zovoilis A., Salinas-Riester G. A hippocampal insulin-growth factor 2 pathway regulates the extinction of fear memories. EMBO J. 2011;30:4071–4083. doi: 10.1038/emboj.2011.293. [DOI] [PMC free article] [PubMed] [Google Scholar]
- 44.Hawkins N.A., Martin M.S., Frankel W.N., Kearney J.A., Escayg A. Neuronal voltage-gated ion channels are genetic modifiers of generalized epilepsy with febrile seizures plus. Neurobiol. Dis. 2011;41:655–660. doi: 10.1016/j.nbd.2010.11.016. [DOI] [PMC free article] [PubMed] [Google Scholar]
- 45.Trudeau M.M., Dalton J.C., Day J.W., Ranum L.P.W., Meisler M.H. Heterozygosity for a protein truncation mutation of sodium channel SCN8A in a patient with cerebellar atrophy, ataxia, and mental retardation. J. Med. Genet. 2006;43:527–530. doi: 10.1136/jmg.2005.035667. [DOI] [PMC free article] [PubMed] [Google Scholar]
- 46.Han L., Witmer P.D., Casey E., Valle D., Sukumar S. DNA methylation regulates MicroRNA expression. Cancer Biol. Ther. 2007;6:1284–1288. doi: 10.4161/cbt.6.8.4486. [DOI] [PubMed] [Google Scholar]
- 47.Gama-Sosa M.A., Midgett R.M., Slagel V.A., Githens S., Kuo K.C., Gehrke C.W., Ehrlich M. Tissue-specific differences in DNA methylation in various mammals. Biochim. Biophys. Acta. 1983;740:212–219. doi: 10.1016/0167-4781(83)90079-9. [DOI] [PubMed] [Google Scholar]
- 48.Pai A.A., Bell J.T., Marioni J.C., Pritchard J.K., Gilad Y. A genome-wide study of DNA methylation patterns and gene expression levels in multiple human and chimpanzee tissues. PLoS Genet. 2011;7:e1001316. doi: 10.1371/journal.pgen.1001316. [DOI] [PMC free article] [PubMed] [Google Scholar]
- 49.Brawand D., Soumillon M., Necsulea A., Julien P., Csárdi G., Harrigan P., Weier M., Liechti A., Aximu-Petri A., Kircher M. The evolution of gene expression levels in mammalian organs. Nature. 2011;478:343–348. doi: 10.1038/nature10532. [DOI] [PubMed] [Google Scholar]
- 50.Siegmund K.D., Connor C.M., Campan M., Long T.I., Weisenberger D.J., Biniszkiewicz D., Jaenisch R., Laird P.W., Akbarian S. DNA methylation in the human cerebral cortex is dynamically regulated throughout the life span and involves differentiated neurons. PLoS ONE. 2007;2:e895. doi: 10.1371/journal.pone.0000895. [DOI] [PMC free article] [PubMed] [Google Scholar]
- 51.Bocker M.T., Hellwig I., Breiling A., Eckstein V., Ho A.D., Lyko F. Genome-wide promoter DNA methylation dynamics of human hematopoietic progenitor cells during differentiation and aging. Blood. 2011;117:e182–e189. doi: 10.1182/blood-2011-01-331926. [DOI] [PubMed] [Google Scholar]
- 52.Christensen B.C., Houseman E.A., Marsit C.J., Zheng S., Wrensch M.R., Wiemels J.L., Nelson H.H., Karagas M.R., Padbury J.F., Bueno R. Aging and environmental exposures alter tissue-specific DNA methylation dependent upon CpG island context. PLoS Genet. 2009;5:e1000602. doi: 10.1371/journal.pgen.1000602. [DOI] [PMC free article] [PubMed] [Google Scholar]
- 53.Hernandez D.G., Nalls M.A., Gibbs J.R., Arepalli S., van der Brug M., Chong S., Moore M., Longo D.L., Cookson M.R., Traynor B.J., Singleton A.B. Distinct DNA methylation changes highly correlated with chronological age in the human brain. Hum. Mol. Genet. 2011;20:1164–1172. doi: 10.1093/hmg/ddq561. [DOI] [PMC free article] [PubMed] [Google Scholar]
- 54.Cáceres M., Lachuer J., Zapala M.A., Redmond J.C., Kudo L., Geschwind D.H., Lockhart D.J., Preuss T.M., Barlow C. Elevated gene expression levels distinguish human from non-human primate brains. Proc. Natl. Acad. Sci. USA. 2003;100:13030–13035. doi: 10.1073/pnas.2135499100. [DOI] [PMC free article] [PubMed] [Google Scholar]
- 55.Gu J., Gu X. Induced gene expression in human brain after the split from chimpanzee. Trends Genet. 2003;19:63–65. doi: 10.1016/s0168-9525(02)00040-9. [DOI] [PubMed] [Google Scholar]
- 56.Preuss T.M., Cáceres M., Oldham M.C., Geschwind D.H. Human brain evolution: insights from microarrays. Nat. Rev. Genet. 2004;5:850–860. doi: 10.1038/nrg1469. [DOI] [PubMed] [Google Scholar]
- 57.Olson M.V., Varki A. Sequencing the chimpanzee genome: Insights into human evolution and disease. Nat. Rev. Genet. 2003;4:20–28. doi: 10.1038/nrg981. [DOI] [PubMed] [Google Scholar]
- 58.Li S., Hursting S.D., Davis B.J., McLachlan J.A., Barrett J.C. Environmental exposure, DNA methylation, and gene regulation: lessons from diethylstilbesterol-induced cancers. Ann. N Y Acad. Sci. 2003;983:161–169. doi: 10.1111/j.1749-6632.2003.tb05971.x. [DOI] [PubMed] [Google Scholar]
- 59.Weaver I.C.G., Cervoni N., Champagne F.A., D’Alessio A.C., Sharma S., Seckl J.R., Dymov S., Szyf M., Meaney M.J. Epigenetic programming by maternal behavior. Nat. Neurosci. 2004;7:847–854. doi: 10.1038/nn1276. [DOI] [PubMed] [Google Scholar]
Associated Data
This section collects any data citations, data availability statements, or supplementary materials included in this article.