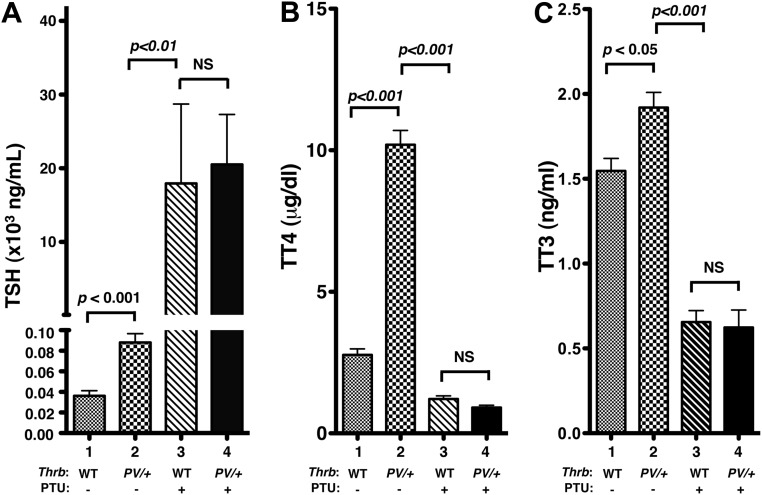
Fig. 1.
Thyroid function tests of the ThrbPV/+ mice and WT siblings with or without treatment with PTU. A, Serum TSH levels for mice with genotypes are as marked (n = 4–17). No significant differences in TSH concentrations were detected between WT-PTU and ThrbPV/+-PTU mice. B, Serum TT4 for mice with genotypes are as marked (n = 7–32). No significant differences in TT4 were detected between WT-PTU and ThrbPV/+-PTU mice. C, Serum TT3 for mice with genotypes are as marked (n = 6–21). No significant differences in TT3 were detected between WT-PTU and ThrbPV/+-PTU mice. The significant differences among the four groups were determined by ANOVA. P values are shown. NS, Not significant.

