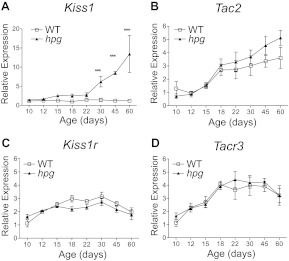
Fig. 2.
Expression of Kiss1, Tac2, and their receptors in the ARC of intact WT and hpg females across postnatal development. Developmental profile analysis of mRNA levels in the ARC as measured by qRT-PCR of WT and hpg females for Kiss1 (A), Tac2 (B), Kiss1r (C) and Tacr3 (D). Values are mean ± sem (n = 4–6). WT, white squares; hpg, black triangles. ***, Significant differences between genotypes (P < 0.001, ANOVA, Neuman-Keuls post hoc). Statistical analysis of effects of age and genotype were compared by two-way ANOVA and are summarized in Table 1.

