

Abstract
The mechanisms by which living cells respond to mechanical stimuli are not yet fully understood. It has been suggested that mechanosensing proteins play an important role in mechanotransduction because their binding affinities are directly affected by the external stress. α-Actinin is an actin cross-linker and may act as a mechanosensor in adhesion sites. Its interaction with vinculin is suggested to be mechanically regulated. In this study, the free energy of activation is explored using the umbrella sampling method. An activation trajectory is generated in which α-actinin’s vinculin-binding site swings out of the rod domain, leading to approximately an 8 kcal/mol free energy release. The activation trajectory reveals several local and global conformational changes along the activation pathway accompanied by the breakage of a number of key interactions stabilizing the inhibited structure. These results may shed light on the role of α-actinin in cellular mechanotransduction and focal adhesion formation.
Introduction
Cellular mechanotransduction, the process by which cells sense mechanical signals and convert them to biochemical signals, is critical to many biological functions including adhesion to the extracellular matrix. In response to appropriate mechanical cues, cells produce large molecular assemblies that function to attach the cytoskeleton to the extracellular matrix (1,2). The biochemical signaling pathways that follow the formation of these focal adhesions in response to the external mechanical perturbation have been widely studied (1–4). However, the mechanism by which the focal adhesions themselves are produced in response to the mechanical perturbation remains largely unclear (5). One possibility is the existence of molecular mechanosensors—molecules whose structure and function are regulated by mechanical cues from extra- and intracellular environments (2). Several mechanosensing proteins have been suggested, including integrin, talin, vinculin, filamin, and α-actinin (4,6–10). Of these, α-actinin is particularly important in that it is critical both to focal adhesion formation and to cytoskeletal stability throughout the cell (11). α-Actinin is linked to growing focal adhesions via its interaction with vinculin. It also acts as a cross-linker for actin filaments, a process that is putatively modulated by vinculin. The interaction between α-actinin and vinculin is crucial to both α-actinin functionality at focal adhesions and its actin cross-linking activity (Fig. 1).
Figure 1.

A cartoon model of a focal adhesion complex depicting the role of vinculin and α-actinin. (a) The structural model of α-actinin shown here is constructed by Liu et al. (12). α-Actinin has three main structural domains: the CaM domain, the central rod domain with four spectrin repeats, (R1–R4), and two calponin homology domains known as CH1 and CH2. (b) The triple helical structure of spectrin repeats (A–C helices) form coiled-coil conformation. (c) The CaM domain contains four EF hand motifs (EF12 and EF34). (d) The primary role of α-actinin is to cross-link actin filaments, and vinculin is suggested to act as a reinforcing agent. Vinculin, α-actinin, and talin build a physical connection between the cytoskeleton and the extracellular matrix.
Structurally, α-actinin is an antiparallel dimer, with each monomer having two calponin-homology (CH) domains at the N-terminus, a central rod domain consisting of four spectrin repeats (R1–R4), and a C-terminal head domain consisting of a calmodulin-homology (CaM) domain (12). The two CH domains can exist in either closed conformation (where they are associated) or open conformation (where they are separated) (Fig. 1). The central spectrin repeats are triple helical structures (A–C helices) (Fig. 1 b) arranged such that the first and second repeats (R1, R2) of one monomer interact with the third and fourth of the other (R3, R4), forming a stable rod-like structure (Fig. 2) (12). The vinculin binding site (αVBS) is located at R4. In the present structure of α-actinin, αVBS is cryptic and needs to be activated and exposed to the solvent before vinculin binding (2).
Figure 2.

α-Actinin shown from two different viewpoints. The figure shows αVBS inhibition in the original structure and our pulling mechanism to activate it. (a) α-Actinin is an antiparallel homodimer consisting of chain A (silver) and chain B (green). αVBS (purple) was pulled out of its inhibited position using a constant velocity MD simulation. Residues 322–345 (yellow) in repeat R1 of chain B, residues 665–688 (ice blue), and residues 641–660 (pink) in repeat R4 of chain A form the reference group (Cαs are shown by black spheres that were restrained during the simulation). The αVBS is inhibited by the reference group as well as the CaM domain (white). (b) The structure shown after the −90° rotation along the x axis with respect to the top figure, emphasizing how αVBS is surrounded by the reference group and consequently inhibited by it. At each window of umbrella sampling, the pulling group containing αVBS is harmonically restrained at distance d from the reference group. Because d is a scalar and does not entitle any direction, the pulling group is free to move on the surface of a hypothetical cylinder (shown in the figure) with radius d.
There are two muscle and two nonmuscle α-actinin isoforms (13,14). Skeletal muscle isoforms cross-link highly parallel actin filaments and are regulated by phosphatidylinositol-(4,5)-bisphosphate (PIP2). Nonmuscle isoforms are present in actin networks and sensitive to Ca2+, whereas muscle isoforms are unable to bind Ca2+ (15,16). Nonmuscle isoforms are localized at adhesion sites (14,17).
Vinculin is a globular protein consisting of four head domains (D1–D4) and a tail domain (Vt) (18). It binds to important focal adhesion molecules such as α-actinin and talin at its head domain (D1), whereas actin binding occurs at the Vt domain. Vinculin activation is a critical process that has been investigated both experimentally (19–23) and computationally (7,8). These studies suggested that the vinculin activation mechanism involves both talin and actin and probably enhances vinculin binding to both partners (8). It was proposed that α-actinin association also induces vinculin activation (21); however, this mechanism has remained elusive.
The available structure of α-actinin shows that αVBS is cryptic and buried in the rod domain (Fig. 2) (9). Previous studies have suggested that αVBS can become activated either by the complete unraveling of the α-actinin structure near αVBS (24) or by a specific conformational change in which αVBS swings out of the interface between R1 and R4 (9). The αVBS residues are inhibited from swinging out due to hydrophobic contacts with other residues in the rod domain. That site of αVBS, which interacts with the CaM domain, is also inhibited by hydrophobic interactions in both conformations of CH domains but mostly in the closed conformation (Fig. 1). Once activated, αVBS can potentially interact with activated vinculin (9).
Aside from its role in focal adhesions, α-actinin is characterized as an actin-filament cross-linker; parallel actin filaments depend on α-actinin for maintaining their spatial arrangement (25,26). The cytoskeleton continuously sustains mechanical stresses and, as an actin cross-linker, α-actinin is exposed to complex mechanical perturbations. Vinculin has been suggested to act as a reinforcing agent for the interaction between actin and α-actinin (7). In this case, α-actinin would serve as a mechanosensor, signaling vinculin to bind to it and reinforce its cross-linking role when exposed to proper stresses. For this to be possible, the activation of αVBS for binding to vinculin would have to be mechanically regulated. Although both experimental (27) and computational evidence (4,28) has been provided to demonstrate the mechanisms by which other mechanosensors such as talin or vinculin are mechanically regulated, no evidence has been given to support α-actinin’s mechanosensing behavior. Talin VBS is activated in a stepwise fashion: First, tension in the rod domain causes torsion near the VBS; then, the VBS rotates out of its core (4). Vinculin activation also follows a stepwise mechanism. First, surface interaction with a nearby VBS is formed. Second, tension from nearby actin-filaments separates D1 from the rest of the vinculin molecule for binding to nearby VBS (8). One can speculate that α-actinin activation follows a similar stepwise procedure.
In this study, we investigate three possible scenarios regarding α-actinin activation before vinculin binding: 1) the available crystal structure of α-actinin is in an already activated conformation and thus no further conformational change is required, 2) external force is necessary to activate α-actinin, 3) no major force is needed and small biases in the order of thermal energy may easily change the conformation of the molecule. We investigate these possibilities by calculating the free energy profile of the activation process for smooth muscle α-actinin. Toward this task we have generated a trajectory for αVBS activation. Moreover, we discuss physiologically relevant mechanisms that may lead to αVBS activation.
Materials and Methods
All simulations were performed using the molecular dynamics (MD) package GROMACS (29) and the CHARMM27 force field (30).The structure of the entire α-actinin dimer was used for our simulations (PDB ID: 1SJJ) (12). A total number of 213,307 water molecules were added to the system. As a result of the extended structure of the α-actinin molecule, a triclinic box with vectors 45 × 15 × 10 nm3 was used that satisfied the minimum image convention criterion in all directions (Fig. S1 in the Supporting Material). The TIP3P water model, for which the CHARMM force field is parameterized, was used in our simulations (31). The system contained 54 negative charges that were neutralized by adding the same number of sodium ions. Two salt-added simulations were performed with 50 and 150 mM of NaCl, which contained 204 and 612 extra ion pairs, respectively.
A timestep of 2 fs was used along with the LINCS algorithm for constraining bonds between hydrogens and heavy atoms (32). The electrostatic interactions were calculated using the particle mesh Ewald method (33). The structure was initially minimized for 500 steps using the steepest descent algorithm (34). This was followed by further minimization with the L-BFGS method (35) for 1000 steps to remove any remaining unfavorable contacts. Furthermore, the system was equilibrated in three stages. In the first stage, the equilibration simulation ran for 10 ns in constant volume, whereas all protein atoms were restrained in space using springs with 1000 kJ mol−1 nm−2 constant. The Nosé-Hoover thermostat (36,37) was used to maintain the temperature at 310 K. In the second stage of equilibration, the system underwent 100 ps of MD in constant pressure and with the same position restraints as the first step. The pressure was maintained at a reference pressure of 1 bar using the Parrinello-Rahman barostat (38). The final step of equilibration took 100 ps with the same set of parameters as the second step except that all restraints were removed. This multilevel equilibration reduces high fluctuations in the density of the system.
The umbrella sampling (39) method was used to calculate the potential of mean force (PMF). A range of different spring constants were tested (Fig. S2) for the umbrella potential and the value of 3000 kJ mol−1 nm−2 resulted in smooth, well-overlapped histograms. The reaction coordinate was defined as the center of mass distance between the Cα atoms of residues 712 to 731 of the C-helix of chain A (the pulling group) and residues 641 to 660 along with residues 665 to 688 of chain A and 322 to 345 of chain B (the reference group). The reference step for umbrellas was chosen to be 0.4 Å to optimize the overlap of the histograms (Fig. S3). At each umbrella a 1 ns sampling was performed (Fig. S4), and the trajectory was saved every 0.2 ps. The final PMF was calculated using Grossfield’s WHAM code (40).
A pulling simulation with constant velocity was performed on the reaction coordinate to observe the activation pathway. Reported results in this study are with 0.005 nm/ps constant velocity. However, a lower velocity simulation with 0.0005 nm/ps was performed to confirm the results. The visual molecular dynamics software package (VMD) was used for all postsimulation visualization and analysis (41).
Results
It has been suggested that α-actinin activation involves αVBS exposure from the hydrophobic core of the triple helical structure of the R4 repeat in the rod domain (9). To evaluate this hypothesis, we generated an activation trajectory using MD simulation, which was then used to calculate the PMF profile of the activation process. For the first part of our study, the trajectory was produced using constant velocity MD simulation for pulling αVBS against its neighboring helices within the rod domain. Moreover, the constant velocity pull was applied to αVBS, whereas three neighboring helices of α-actinin rod domain (reference group) were harmonically restrained. This trajectory was then used to create initial configurations of the system later used for umbrella sampling.
αVBS was initially buried in the rod domain and stabilized by interactions with the neighboring helices. Previous studies revealed that human αVBS is located at the C-helix of R4 (residues 731–760). Sequence alignment of αVBS in smooth muscle chicken isoform, which was used in this study, with human α-actinin revealed a seemingly new range of residues for chicken’s αVBS (706–739). Kelly et al. observed vinculin binding to the CaM domain of α-actinin, but specific residues were not identified. Therefore, we speculated that the CaM domain serves as an initial anchorage of the vinculin molecule, but full engagement requires α-actinin activation (C-helix exposure). In this study, αVBS was selected as the C-helix of R4 and residues 740–760 of the CaM domain, which are at the surface of the first EF-hand motif (Fig. 1 c).
The activation process occurred in three subsequent steps: i) bending of the rod domain due to force transmission from the C-helix to the rod domain via the interactions between the C-helix and its neighboring helices (Fig. 3, panels c and d), ii) movement of the CaM domain away from the rod domain pulling the beginning of the C-helix out, and iii) complete dissociation of the C-helix from the rod domain, leaving the rod domain to recover the straight structure (Fig. 3, panels e and f). An overall twist in the active structure was also evident in the rod domain compared to the inactive structure, suggesting that twisting may also contribute to the activation (Fig. 3).
Figure 3.

Conformational changes in the rod domain of α-actinin along the trajectory. Cα atoms of the reference group are marked with black circles. (a) The initial frame of the simulation (t = 0) shows the inhibited state of αVBS in the rod domain in the straight configuration of the molecule. (b) αVBS, colored red, is inhibited by helices in the rod domain. (c) In the first stage of activation, the force is transmitted to the rod domain via the hydrophobic interactions of the C-helix with the rest of the rod domain. In this stage, no interactions are disrupted but the molecule undergoes bending. (d) Bending of the molecule pushes the αVBS toward the surface of the molecule because it is coupled with a twist in the rod domain. (e) In the last stage of activation, all the hydrophobic interactions between the C-helix and the rod domain are broken and αVBS is completely exposed to the solvent. (f) The twist in the rod domain of the activated structure is obvious compared to panel B. This twist is stabilized by the formation of new interactions between the two monomers in the absence of the C-helix.
To quantify the correlation between αVBS activation and the strain experienced by the α-actinin molecule, we related the local changes in the conformation to the more global ones. In the first step of activation, none of the interactions were broken but they worked in concert to transmit the force from αVBS to the rod domain and resulted in bending of the structure. In the second step, the first EF-hand motif was dissociated from the rod domain. Specifically, a hydrogen bond between Lys-763 in the CaM domain and Thr-738 at the end of the C-helix was broken. This interaction was partially responsible for holding αVBS in the inhibited position. In addition, Gln-806 in the CaM domain was forced to move away from His-662 in the A-helix of R4 disrupting another hydrogen bond. The C-helix followed the first EF-hand and became partially exposed. The C-helix is initially stabilized by hydrophobic interactions within the rod domain. As the C-helix was being pulled out, these hydrophobic contacts were broken one by one from the C-terminus to the N-terminus of the helix in a zipper-like fashion. Interestingly, as each residue broke free from its interactions, it was shifted one residue further and formed a new short-lived interaction with the next residue in the chain (Fig. 4). We suggest that formation of these relatively short-lived interactions gives rise to transition states that reduce the energy cost for a more global conformational change. At the last step, salt bridges between αVBS and helices in both the same and the opposite monomers were disturbed. Specifically, Glu-712 and Arg-715 of αVBS broke free from Arg-321 in R1 and Glu-690 in R4, respectively.
Figure 4.

Hydrophobic packing of αVBS inside the rod domain. (a) The residues of C-helix (706–739) interact closely with the A-helix (660–688) in the initial configuration of the system, forming a highly packed hydrophobic region. (b) As the force is applied to αVBS, hydrophobic interactions start to break from the end of the C-helix close to the CaM domain. First, as the contact between Ile-736 and Leu-665 is disrupted, Val-732 shifts one residue further, distorting its interaction with Leu-669 and forming a new one with Leu-665. The new set of interactions reduces the energy cost for placing the C-helix one residue further along the A-helix. (c) Further pulling of the C-helix against the rod domain dissociatesVal-732 from Leu-665 and puts Ile-729 in contact with Leu-665. These short-term interactions distribute a large amount of energy required for a global conformational change among smaller energy packs provided as thermal atomic motions, which is consistent with the diffusive nature of the biological systems.
The solvent accessible surface area (SASA) of αVBS increased at the second stage of activation between 400 and 600 ps (Fig. 5 a). The SASA value was roughly constant in the last stage of activation, which implied that salt bridges were disrupted in this stage without a significant impact on αVBS inhibition. The number of hydrogen bonds within αVBS and the rod domain continuously decreased over time showing that this type of interaction played an important role in stabilizing αVBS in the rod domain (Fig. 5 b).
Figure 5.

(a) SASA of αVBS shows a sharp increase between 400 and 600 ps, which corresponds to the second stage of the activation process. It shows that αVBS is released after the key hydrophobic interactions are distorted. The last part of the graph is related to the third stage of the activation process in which a few salt bridges are broken. No significant increase in the SASA value is displayed at this stage implying that these salt bridges do not have a major effect on stabilizing αVBS because they are located only at the N-terminus of αVBS. (b) The number of hydrogen bonds with αVBS continuously decreases over time showing that hydrogen bonds are important in stabilizing αVBS in the rod domain.
According to the PMF profile, the system has two stages, separated by a relatively sharp free energy drop of ∼13kBT (Fig. 6). The first two steps of activation occurred before the energy drop, most likely because of an entropic increase after the C-helix was partially exposed and the CaM domain was freed from the rod domain.
Figure 6.
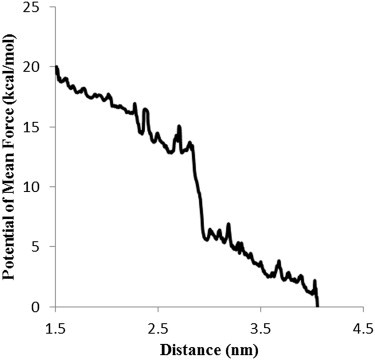
The PMF versus the reaction coordinate, which is defined as the distance between the pulling group (consisting of the Cα-s of the residues 712 to 760 of chain A) and the reference group (consisting of the Cα-s of residues 641 to 660 and 665 to 688 of chain A and residues 322 to 345 of chain B). The energy barriers in the left-hand side of the PMF profile show breakage of the hydrophobic interactions and is followed by a 13kBT energy drop resulting in complete exposure of αVBS.
The effect of salinity on the activation trajectory was explored by comparing the neutral system with 50 and 150 mM additional salt concentrations added: salinity. The results showed no substantial difference among these simulations with regard to the activation trajectory. The solvent accessible surface area of αVBS for these simulations overlapped, showing that the activation rate is the same for all simulations. Our results suggested that, because αVBS is stabilized via hydrophobic interactions, the activation process is mostly governed by the hydrophobic forces and not electrostatic effects, and thus salinity had negligible effects (Fig. S5). In addition, although a few salt bridges exist at the farther end of the C-helix with respect to the rod domain in the initial structure, they are buried in the hydrophobic core of the protein and cannot be manipulated by the ions in the system.
To test the reversibility of this activation trajectory, a 1 ns equilibration was carried out on the structure of α-actinin during which all restraints and pulling forces were removed. During this simulation root mean-square deviation was equilibrated and αVBS remained in its activated position. During activation several rearrangements occurred within the rod domain, stabilizing the activated structure. Most of the hydrophobic residues dissociated from αVBS formed a new interaction with neighboring helices that compensated for the energy loss due to breakage. The structure also regained its helicity, which was partially disrupted in the process of force application. In addition, the conformational changes throughout the rest of α-actinin, e.g., extension in the connective loop between the ABD and the rod domain, were not reversed. This result indicates that even though an external force (or interaction) on αVBS is needed to accelerate the activation process; the activated structure will most likely be preserved for further interactions with vinculin.
Our fully active structure of αVBS, obtained from the equilibration simulation mentioned previously, was compared to the crystal structure of αVBS in complex with vinculin generated by Bois et al. (9). The human αVBS in complex with vinculin head was aligned to chicken’s smooth muscle α-actinin in the activated conformation to examine the consistency of vinculin head with the full-length α-actinin. As Fig. S6 B shows, vinculin head matches the activated α-actinin except for a small overlap with the CaM domain denoted by a circle. This was expected because in the complex, none of the space-filling structures such as CaM and CH domains are present. Therefore, we do not expect to see complete similarity between the structures. The helicity of αVBS is reduced in the activated structure compared to the isolated αVBS increasing the root mean-square deviation to 5 Å. However, the overall matching between αVBSs is plausible (Fig. S6).
The activation trajectory was reproduced using a smaller pulling velocity to measure the pulling rate effects on the activation pathway. Simulation performed with 0.0005 nm/ps pulling rate—versus 0.005 nm/ps used earlier—showed that significantly less force is required for activation with a slower rate of pulling (Fig. S7). However, using a smaller pulling velocity did not notably affect the activation trajectory (Fig. S8) except for the expected observation that the conformational change took more time to present.
Discussion
α-Actinin is an essential cytoskeletal protein that plays a primary role in cross-linking actin filaments. α-Actinin’s interaction with vinculin plays a part in both reinforcing focal adhesion sites and rearranging actin filaments. It has been suggested that α-actinin activates vinculin by inserting its binding site to the vinculin head and reorganizing helices in that region (9). However, the present atomic structure of α-actinin shows that αVBS is primarily inhibited in the rod domain and thus α-actinin activation should precede vinculin binding and vinculin activation (42). In this study, we produced an activation trajectory consistent with the hypothesis proposed by Bois et al., which resulted in the complete exposure of αVBS to the solvent and was in good agreement with the vinculin-αVBS complex resolved by Kelly et al. (43). Our activation trajectory was then used for calculating the PMF and measuring the free energy difference between inactive and activated conformations. It should be noted that the smooth muscle α-actinin isoform was used in this study, which are PIP2-regulated, and not known to directly participate in focal adhesions. However, this model is currently the only complete atomic structure available and thus the best candidate for conducting computational studies on α-actinin activation and elucidating α-actinin’s role in focal adhesions. The conformation of ABDs and the CaM domain in the nonmuscle isoforms might be different, which can affect the activation pathway to some extent. On the basis of our results, we speculate that the most important effect would emerge from the degree of CaM association with the rod domain in the nonmuscle isoform.
Referring to the PMF profile, the system has two stages separated by an energy drop of ∼13 kBT, i.e., activation releases 8 kcal/mol of energy (Fig. 6). The conformational changes related to activation mainly occurred before the energy drop and resulted from breakage of a number of hydrophobic contacts between the C-helix and its neighboring helices within the rod domain that are responsible for the fluctuations observed along the reaction coordinate. Subsequently, a large segment of αVBS was dissociated from the rod domain and became free to float into the solvent, which in turn resulted in a relatively large entropic raise of the system. Further αVBS pulling disrupted several salt bridges at the end of the C-helix and αVBS was completely exposed after 1 ns of pulling. Aligning the activated αVBS of our simulation to αVBS in complex with vinculin resolved by Bois et al. revealed that the vinculin head fits into the space between αVBS and the rod domain in the full-length structure (Fig. S6 A). However, actin binding and CaM domains on α-actinin cause partial steric hindrance for vinculin head and limit its movement (Fig. S6, B); therefore, even upon exposure αVBS should make an angle large enough to provide sufficient space for vinculin to be placed close to it and optimize binding.
Simulation of the activated structure in the absence of constraints or forces showed the stability of the activated αVBS structure. The α-actinin molecule reorganized itself to adjust to conformational changes at each stage of activation and reduce the energy cost. For instance, several new interactions were formed within the rod domain to compensate for the missing stabilizing interactions with αVBS after activation (Table S1). Interestingly, other parts of the protein remained stable and intact. No interactions were disrupted in ABD or between CaM and ABD. In fact, ABD followed CaM because of the strong interaction between them. The only other disrupted interaction was between the connective loop from ABD to the rod domain, and the CaM domain. This loop was mainly hydrophilic and thus stable in solvent. It is worth noting that α-actinin dimerization was maintained during activation, as suggested previously (44).
The simulations used to produce the activation trajectory were carried out with a 0.005 nm/ps pulling velocity, which is substantially faster than the biological range of molecular velocities inside of a living cell. For the umbrella sampling simulations, the structure had been equilibrated at each window and therefore the PMF calculations were independent of the pulling velocity. To evaluate the effect of pulling rate on our activation trajectory, another simulation with 0.0005 nm/ps pulling velocity was performed for 10 ns. However, the force plot of the slow rate (0.0005 nm/ps) of activation trajectory showed a 150 kJ/mol nm decrease compared to the original trajectory (Fig. S7). This was most likely because fewer interactions were perturbed at each time and thus the force required to disrupt them was relatively weaker in the high rate simulation. From a thermodynamic perspective, the system had a longer time to reorganize and equilibrate to a new structure at each timepoint. Aligning two trajectories at similar stages of activation reveals that αVBS follows the same activation pathway in both cases (Fig. S8). Therefore, although our initial pulling velocity was not in the biological range, it resulted in a reasonable activation pathway consistent with slower pulling velocities.
An important conformational change observed while generating the activation trajectory was the bending of the α-actinin rod domain toward the exposed αVBS. The harmonic force applied to pull out αVBS reached 600 kJ mol−1 nm−1 at the end of the first stage of activation causing the rod domain to bend. We previously showed that α-actinin’s dominant mode is bending and bending can be achieved with ∼100 pN of force in MD simulations (45), consistent with the results from this study.
It should be emphasized that the activation trajectory reveals a correlation between conformational changes such as bending and/or twisting and αVBS activation, but does not necessarily imply causality. Bending and twisting are both molecular responses to mechanical stimuli (37) and might not be necessary steps toward activation. This implies that external force may induce other activation pathways that do not incorporate these conformational changes. However, to fully verify whether there exists a causal connection between bending/twisting and the activation phenomenon, future experimental studies are required.
Our results suggest an easily achievable activation state for an isolated α-actinin molecule, i.e., in the unbound state to actin or any other molecule. The trajectory reveals which degrees of freedom are crucial and need to be enhanced or at least remain undisturbed. For instance, Fig. 3 shows that activation initiates from bending the rod domain and terminates by the full dissociation of the C-helix in the R4 spectrin repeat.
Here, we started from the inactive structure of α-actinin but, due to the downhill behavior of the PMF, energy is released upon activation and thus we suggest that no significant work is required for activating the molecule. Therefore, it is possible for α-actinin to bind to vinculin before actin binding that may lead to vinculin activation as proposed by Bois et al. Afterward, vinculin might stay bound or dissociate depending on the direction and level of stress transmitted from actin filaments. In other words, based on our activation trajectory, we hypothesize that the presence of mechanical stimuli may either give rise to or prevent activation. An example of a situation that may inhibit activation involves restricting the movement of the CaM domain farther from the rod domain. The CaM domain directly interacts with the CH domains and thus actin binding may strongly affect its motion. For instance, if two parallel actin filaments cross-linked by α-actinins are under a stress perpendicular to the filament axes, which cause them to move away from one another, α-actinins are stretched and αVBS is probably forced back to the rod domain. This may change the free energy profile of the system, i.e., pulling α-actinin out of the rod domain requires energy that might be provided by other focal adhesion molecules such as zyxin or vinculin itself. A possible activation mechanism of α- in the bound state to actin may be provoked by two sequential steps of stress application: 1) a mechanical strain transmitted from ABDs attached to actin filaments induce global conformational changes such as bending in the rod domain, 2) and vinculin then forces the CaM domain to move away from the rod domain resulting in αVBS exposure and stabilization in the new state. The mechanical strain can result from the movement of actin filaments bound to two ends of α-actinin. For instance, if two parallel actin filaments move in opposite directions parallel to their main axes, the force may then be transmitted to the CaM domain, which leads to pulling the C-helix out of the rod domain. Another scenario involves direct α-actinin binding to integrin, suggesting that if the rod domain is held close to the membrane while actins are pushed away by actomyosin contraction, the CaM domain is moved away from the rod domain and αVBS becomes exposed. In both of these scenarios, vinculin may play an important role. As actin-ABD linkage is exhausted and trembled upon sustained stress, vinculin may come into play to reinforce the interaction between the two. This is done by first interacting with partially exposed αVBS and further pulling it out, and then αVBS inserts itself into the vinculin head and reorganizes this area causing a conformational change in the head domain, which leads to separation of the tail domain. Furthermore, there are many other possibilities for inducing stress in the α-actinin molecule that may involve binding to other focal adhesion molecules as well as movements of actin filaments. Consequently, the presence of vinculin near αVBS prior and throughout the αVBS activation may greatly contribute to activation and stabilization of α-actinin in the bound state (Fig. 7). Consequently, α-actinin still acts as a mechanosensor because stress controls the function of the α-actinin molecule but not in the way previously assumed.
Figure 7.

A model for α-actinin activation and its interaction with vinculin. Molecular structures (12,47) (right) are made comparable to the cartoon models (left) by using the same color label for each molecular domain. The labels in α-actinin are as follows: CaM domain (cyan), CH domains (dark green), R1 (yellow), R2 (blue), R3 (pink), and R4 (gray). Vinculin domains are labeled as: D1 (orange), D2 (green), D3 (ice blue), D4 (purple), and Vt (light blue). (a) The inactive structure of the α-actinin molecule with the αVBS (red) inhibited in the rod domain. (b) A twist happens in the rod domain and αVBS becomes partially exposed to the solvent, forming a weak interaction with vinculin. (c) Interacting with vinculin provides the free energy required for activation. Consequently, αVBS swings out of the R4 spectrin and forms a complex with vinculin.
One may ask: if activation releases energy, then why is the crystal structure in the inactive state? The reason may lie in the preparation and arrangement of α-actinin molecules in the experimental procedure done by Liu et al. (46). α-Actinin molecules form a two-dimensional array that may inhibit activation as a result of the stress that molecules exert on each other in the mesh. Therefore, we cannot conclude that the activation pathway is necessarily unique. It is worth mentioning that the interaction between α-actinin and vinculin was observed in an actin-free environment, which implies at the very least that stress transmitted from actin filaments is not necessary for vinculin binding (Fig. 8, a–c) (44). Another possibility is that α-actinin binding would not be sufficient for vinculin activation; although, if vinculin is weakly associated with actin, forces applied from both sides result in activation (Fig. 8, d–f). Therefore, in this work we do not necessarily suggest that vinculin becomes activated upon α-actinin binding but no external agent is required for α-actinin association.
Figure 8.

Two possible mechanisms of vinculin activation upon α-actinin binding are depicted. (a) The starting structure of α-actinin is activated as suggested by this study; therefore, vinculin has a high affinity for binding. (b) The first activation mechanism suggests that, after associating with α-VBS, vinculin head undergoes conformational changes that results in separation of the tail domain. (c) Activated Vt then forms a strong interaction with actin filaments, reinforcing the interaction between actin and α-actinin. (d) The second mechanism suggests that vinculin associates with F-actin applying stress to Vt, whereas the head domain is attached to α-actinin. This leads to the head-tail separation shown in (e).
The PMF for αVBS activation was calculated using an activation trajectory consistent with Bois et al. (9), and some key interactions and conformational changes necessary for activation have been marked. On the basis of those results, we concluded that α-actinin could become activated using the thermal energy and probably small biasing forces in the order of kBT applied by binding partners such as vinculin itself. The activation process contributes to α-actinin function within the cell only after the subsequent binding of activated αVBS to vinculin. Do the suggested conformational changes presented here sufficiently allow vinculin to bind αVBS? Does the activated αVBS bind vinculin via a unique binding trajectory? These and similar questions need to be investigated in future studies to understand the impact of αVBS activation.
Acknowledgments
Fruitful discussions with M. Jafarnejad, S. Jamalian, Z. Eskandari, and other members of the Molecular Cell Biomechanics Laboratory are gratefully acknowledged.
Financial support by National Science Foundation (CAREER-0955291) is gratefully acknowledged.
Supporting Material
References
- 1.Moore S.W., Roca-Cusachs P., Sheetz M.P. Stretchy proteins on stretchy substrates: the important elements of integrin-mediated rigidity sensing. Dev. Cell. 2010;19:194–206. doi: 10.1016/j.devcel.2010.07.018. [DOI] [PMC free article] [PubMed] [Google Scholar]
- 2.Vogel V., Sheetz M. Local force and geometry sensing regulate cell functions. Nat. Rev. Mol. Cell Biol. 2006;7:265–275. doi: 10.1038/nrm1890. [DOI] [PubMed] [Google Scholar]
- 3.Schwartz M.A. Cell biology. The force is with us. Science. 2009;323:588–589. doi: 10.1126/science.1169414. [DOI] [PubMed] [Google Scholar]
- 4.Lee S.E., Kamm R.D., Mofrad M.R. Force-induced activation of talin and its possible role in focal adhesion mechanotransduction. J. Biomech. 2007;40:2096–2106. doi: 10.1016/j.jbiomech.2007.04.006. [DOI] [PubMed] [Google Scholar]
- 5.Mofrad M.R.K. Rheology of the cytoskeleton. Annu. Rev. Fluid Mech. 2009;41:433–453. [Google Scholar]
- 6.Honarmandi P., Lee H., Kamm R.D. A microfluidic system with optical laser tweezers to study mechanotransduction and focal adhesion recruitment. Lab Chip. 2011;11:684–694. doi: 10.1039/c0lc00487a. [DOI] [PubMed] [Google Scholar]
- 7.Golji J., Mofrad M.R. A molecular dynamics investigation of vinculin activation. Biophys. J. 2010;99:1073–1081. doi: 10.1016/j.bpj.2010.05.024. [DOI] [PMC free article] [PubMed] [Google Scholar]
- 8.Golji J., Lam J., Mofrad M.R. Vinculin activation is necessary for complete talin binding. Biophys. J. 2011;100:332–340. doi: 10.1016/j.bpj.2010.11.024. [DOI] [PMC free article] [PubMed] [Google Scholar]
- 9.Bois P.R.J., Borgon R.A., Izard T. Structural dynamics of alpha-actinin-vinculin interactions. Mol. Cell. Biol. 2005;25:6112–6122. doi: 10.1128/MCB.25.14.6112-6122.2005. [DOI] [PMC free article] [PubMed] [Google Scholar] [Research Misconduct Found]
- 10.Kolahi K.S., Mofrad M.R. Molecular mechanics of filamin's rod domain. Biophys J. 2008;94(3):1075–1083. doi: 10.1529/biophysj.107.118802. [DOI] [PMC free article] [PubMed] [Google Scholar]
- 11.Bubeck P., Pistor S., Jockusch B.M. Ligand recruitment by vinculin domains in transfected cells. J. Cell Sci. 1997;110:1361–1371. doi: 10.1242/jcs.110.12.1361. [DOI] [PubMed] [Google Scholar]
- 12.Liu J., Taylor D.W., Taylor K.A. A 3-D reconstruction of smooth muscle alpha-actinin by CryoEm reveals two different conformations at the actin-binding region. J. Mol. Biol. 2004;338:115–125. doi: 10.1016/j.jmb.2004.02.034. [DOI] [PubMed] [Google Scholar]
- 13.Otto J.J. Actin-bundling proteins. Curr. Opin. Cell Biol. 1994;6:105–109. doi: 10.1016/0955-0674(94)90123-6. [DOI] [PubMed] [Google Scholar]
- 14.Blanchard A., Ohanian V., Critchley D. The structure and function of alpha-actinin. J. Muscle Res. Cell Motil. 1989;10:280–289. doi: 10.1007/BF01758424. [DOI] [PubMed] [Google Scholar]
- 15.Burridge K., Feramisco J.R. Non-muscle alpha actinins are calcium-sensitive actin-binding proteins. Nature. 1981;294:565–567. doi: 10.1038/294565a0. [DOI] [PubMed] [Google Scholar]
- 16.Otey C.A., Carpen O. Alpha-actinin revisited: a fresh look at an old player. Cell Motil. Cytoskeleton. 2004;58:104–111. doi: 10.1002/cm.20007. [DOI] [PubMed] [Google Scholar]
- 17.Edlund M., Lotano M.A., Otey C.A. Dynamics of alpha-actinin in focal adhesions and stress fibers visualized with alpha-actinin-green fluorescent protein. Cell Motil. Cytoskeleton. 2001;48:190–200. doi: 10.1002/1097-0169(200103)48:3<190::AID-CM1008>3.0.CO;2-C. [DOI] [PubMed] [Google Scholar]
- 18.Ziegler W.H., Liddington R.C., Critchley D.R. The structure and regulation of vinculin. Trends Cell Biol. 2006;16:453–460. doi: 10.1016/j.tcb.2006.07.004. [DOI] [PubMed] [Google Scholar]
- 19.Izard T., Evans G., Bois P.R. Vinculin activation by talin through helical bundle conversion. Nature. 2004;427:171–175. doi: 10.1038/nature02281. [DOI] [PubMed] [Google Scholar]
- 20.Bakolitsa C., Cohen D.M., Liddington R.C. Structural basis for vinculin activation at sites of cell adhesion. Nature. 2004;430:583–586. doi: 10.1038/nature02610. [DOI] [PubMed] [Google Scholar]
- 21.Bois P.R., O’Hara B.P., Izard T. The vinculin binding sites of talin and alpha-actinin are sufficient to activate vinculin. J. Biol. Chem. 2006;281:7228–7236. doi: 10.1074/jbc.M510397200. [DOI] [PubMed] [Google Scholar]
- 22.Huang Y., Zhang W., Gunst S.J. Activation of vinculin induced by cholinergic stimulation regulates contraction of tracheal smooth muscle tissue. J. Biol. Chem. 2011;286:3630–3644. doi: 10.1074/jbc.M110.139923. [DOI] [PMC free article] [PubMed] [Google Scholar]
- 23.Chen H., Choudhury D.M., Craig S.W. Coincidence of actin filaments and talin is required to activate vinculin. J. Biol. Chem. 2006;281:40389–40398. doi: 10.1074/jbc.M607324200. [DOI] [PubMed] [Google Scholar]
- 24.Winder S.J. The membrane-cytoskeleton interface: the role of dystrophin and utrophin. J. Muscle Res. Cell Motil. 1997;18:617–629. doi: 10.1023/a:1018627705273. [DOI] [PubMed] [Google Scholar]
- 25.Hampton C.M., Taylor D.W., Taylor K.A. Novel structures for alpha-actinin: F-actin interactions and their implications for actin-membrane attachment and tension sensing in the cytoskeleton. J. Mol. Biol. 2007;368:92–104. doi: 10.1016/j.jmb.2007.01.071. [DOI] [PMC free article] [PubMed] [Google Scholar]
- 26.Hemmings L., Kuhlman P.A., Critchley D.R. Analysis of the actin-binding domain of alpha-actinin by mutagenesis and demonstration that dystrophin contains a functionally homologous domain. J. Cell Biol. 1992;116:1369–1380. doi: 10.1083/jcb.116.6.1369. [DOI] [PMC free article] [PubMed] [Google Scholar]
- 27.del Rio A., Perez-Jimenez R., Sheetz M.P. Stretching single talin rod molecules activates vinculin binding. Science. 2009;323:638–641. doi: 10.1126/science.1162912. [DOI] [PMC free article] [PubMed] [Google Scholar]
- 28.Vogel V., Sheetz M.P. Cell fate regulation by coupling mechanical cycles to biochemical signaling pathways. Curr. Opin. Cell Biol. 2009;21:38–46. doi: 10.1016/j.ceb.2009.01.002. [DOI] [PMC free article] [PubMed] [Google Scholar]
- 29.Van Der Spoel D., Lindahl E., Berendsen H.J. GROMACS: fast, flexible, and free. J. Comput. Chem. 2005;26:1701–1718. doi: 10.1002/jcc.20291. [DOI] [PubMed] [Google Scholar]
- 30.Scott W.R.P., Hunenberger P.H., van Gunsteren W.F. The GROMOS biomolecular simulation program package. J. Phys. Chem. A. 1999;103:3596–3607. [Google Scholar]
- 31.Jorgensen W.L., Chandrasekhar J., Klein M.L. Comparison of simple potential functions for simulating liquid water. J. Chem. Phys. 1983;79:926–935. [Google Scholar]
- 32.Hess B., Bekker H., Fraaije J. LINCS: a linear constraint solver for molecular simulations. J. Comput. Chem. 1997;18:1463–1472. doi: 10.1021/ct700200b. [DOI] [PubMed] [Google Scholar]
- 33.Darden T., York D., Pederson L. Particle mesh Ewald: an N.log(N) method for Ewald sums in large systems. J. Chem. Phys. 1993;98:10089–10092. [Google Scholar]
- 34.Cauchy A. Methodes generales pour la resolution des syst’emes dequations simultanees. C. R. Acad. Sci. Par. 1847;25:536–538. [Google Scholar]
- 35.Byrd R., Lu P., Nocedal J. A limited memory algorithm for bound constrained optimization. SIAM J. Scientif. Statistic. Comput. 1995;16:1190–1208. [Google Scholar]
- 36.Nosé S. A unified formulation of the constant temperature molecular dynamics methods. J. Chem. Phys. 1984;81:511–519. [Google Scholar]
- 37.Hoover W.G. Canonical dynamics: equilibrium phase-space distributions. Phys. Rev. A. 1985;31:1695–1697. doi: 10.1103/physreva.31.1695. [DOI] [PubMed] [Google Scholar]
- 38.Parrinello M., Rahman A. Polymorphic transitions in single crystals: a new molecular dynamics method. J. Appl. Phys. 1981;52:7182–7190. [Google Scholar]
- 39.Torrie G., Valleau J. Nonphysical sampling distributions in Monte Carlo free-energy estimation: umbrella sampling. J. Comput. Phys. 1977;23:187–199. [Google Scholar]
- 40.Kumar S., Rosenberg J.M., Kollman P.A. THE weighted histogram analysis method for free-energy calculations on biomolecules. I. The method. J. Comput. Chem. 1992;13:1011–1021. [Google Scholar]
- 41.Humphrey W., Dalke A., Schulten K. VMD: visual molecular dynamics. J. Mol. Graph. 1996;14:33–38. doi: 10.1016/0263-7855(96)00018-5. 27–38. [DOI] [PubMed] [Google Scholar]
- 42.Mofrad M.R.K., Kamm R.D., editors. “Cellular Mechanotransduction: Diverse Perspectives from Molecules to Tissues”. Cambridge University Press; 2009. [Google Scholar]
- 43.Kelly D.F., Taylor D.W., Taylor K.A. Structure of the alpha-actinin-vinculin head domain complex determined by cryo-electron microscopy. J. Mol. Biol. 2006;357:562–573. doi: 10.1016/j.jmb.2005.12.076. [DOI] [PubMed] [Google Scholar]
- 44.McGregor A., Blanchard A.D., Critchley D.R. Identification of the vinculin-binding site in the cytoskeletal protein alpha-actinin. Biochem. J. 1994;301:225–233. doi: 10.1042/bj3010225. [DOI] [PMC free article] [PubMed] [Google Scholar]
- 45.Golji J., Collins R., Mofrad M.R. Molecular mechanics of the alpha-actinin rod domain: bending, torsional, and extensional behavior. PLOS Comput. Biol. 2009;5:e1000389. doi: 10.1371/journal.pcbi.1000389. [DOI] [PMC free article] [PubMed] [Google Scholar]
- 46.Burridge K., Fath K., Turner C. Focal adhesions: transmembrane junctions between the extracellular matrix and the cytoskeleton. Annu. Rev. Cell Biol. 1988;4:487–525. doi: 10.1146/annurev.cb.04.110188.002415. [DOI] [PubMed] [Google Scholar]
- 47.Borgon R.A., Vonrhein C., Izard T. Crystal structure of human vinculin. Structure. 2004;12:1189–1197. doi: 10.1016/j.str.2004.05.009. [DOI] [PubMed] [Google Scholar]
Associated Data
This section collects any data citations, data availability statements, or supplementary materials included in this article.