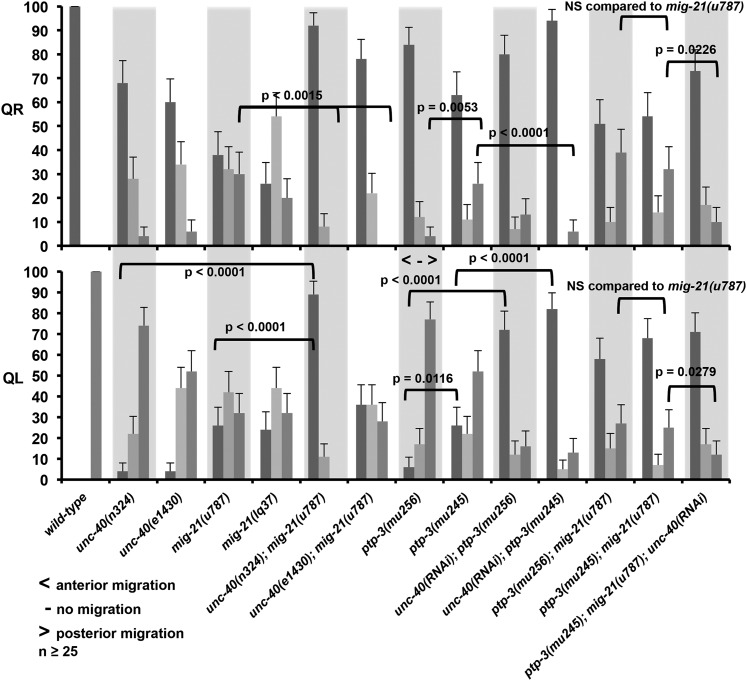
Figure 6 .
QR and QL migration defects. Graph plots genotype on the x-axis against percentage of QR and QL at 4–4.5 hr posthatching that had divided above V4 (anterior migration; bars with dark shading); between V4 and V5 (no migration; bars with light shading); and above V5 (posterior migration; bars with medium shading). Data for the 2- to 2.5-hr protrusion stage and the 3- to 3.5-hr migration stage are included in Supporting Information. The 2- to 2.5-hr and 3- to 3.5-hr data generally follow the trends seen with the 4- to 4.5-hr division stage data shown here. unc-40(RNAi) represents the cell-specific Pscm::unc-40(RNAi) transgene. The error bars represent two times the standard error of the proportion, and significances of difference were calculated by Fisher exact analysis. At least 25 animals were scored for each genotype.

