Abstract
The application of correlation spectroscopy employing stochastic excitation and the Hadamard transform to time-domain Fourier transform electron paramagnetic resonance (FT-EPR) spectroscopy in the radiofrequency (RF) band is described. An existing, time-domain FT-EPR spectrometer system with a Larmor frequency (Lf) of 300 MHz was used to develop this technique by incorporating a pseudo-random pulse sequence generator to output the maximum length binary sequence (MLBS, 10- and 11-bit). Software developed to control the EPR system setup, acquire the signals, and post process the data, is outlined. The software incorporates the Hadamard transform algorithm to perform the required cross-correlation of the acquired signal and the MLBS after stochastic excitation. To accommodate the EPR signals, bandwidth extension was accomplished by sampling at a rate many times faster than the RF pulse repetition rate, and subsequent digital signal processing of the data. The results of these experiments showed that there was a decrease in the total acquisition time, and an improved free induction decay (FID) signal-to-noise (S/N) ratio compared to the conventional coherent averaging approach. These techniques have the potential to reduce the RF pulse power to the levels used in continuous wave (CW) EPR while retaining the advantage of time-domain EPR methods. These methods have the potential to facilitate the progression to in vivo FT-EPR imaging of larger volumes.
Keywords: EPR, Fourier transform, Hadamard transform, Noise excitation, Correlation spectroscopy
1. Introduction
Electron paramagnetic resonance (EPR) based techniques are becoming important functional imaging tools, especially in small animals such as mice and rats, to examine the physiology of the tissue in a non-invasive manner [1]. With the availability of narrow-line, non-toxic spin probes which are suitable for time-domain EPR imaging, in vivo EPR imaging has been success-fully applied to provide non-invasive maps of tissue pO2 based on the oxygen dependent line width and relaxation time, of the paramagnetic spin probes [2–7]. In a typical Fourier transform electron paramagnetic resonance (FT-EPR) imaging spectrometer used for small animals, radiofrequency (RF) pulses of ~100 ns duration at a nominal peak transmit power of 80 W are used to induce the free induction decays (FIDs). These pulses are applied at a frequency of 20 kHz (every 50 μs), corresponding to a duty cycle of 1/500. The duty cycle may increase when the resonator size is increased to accommodate larger animals, or when large surface coils are used for topical EPR, and potentially increase the risk of RF heating of the object being imaged. Specific absorption rate (SAR) regulations for in vivo experiments will require lower power levels than those that are used to generate a flip angle of 90°.
Therefore, for time-domain EPR to be implemented on larger objects, strategies should be explored, which can in principle, generate equivalent S/N ratios of EPR signals from input RF power levels that are reduced by 1–2 orders of magnitude. In the early seventies, Ernst [8], Kaiser [9], and Ziessow and Blümich [10] proposed the use of stochastic excitation (i.e., pseudo-random excitation) as an alternative to coherent pulsed excitation. More systematic introductions have been published elsewhere [11–17]. Stochastic excitation studies have also been reported in pulsed EPR by Prisner and Dinse [18]. Fuhs et al. [19] have employed stochastic excitation with a full-width-half-maximum bandwidth of 250 MHz to perform Fourier transform (FT) high-field/high-frequency electron paramagnetic resonance (EPR) at 3.4 T/95 GHz (W-band). As far as we are aware this is the first time stochastic excitation EPR has been carried out at RFs. In coherent pulsed excitation, each pulse in a sequence normally initiates magnetization evolution from the same steady state longitudinal magnetization, and does not interact with the previously excited transverse magnetization. In stochastic excitation the pulses are repeated at time intervals much less than the T2 of the spin system and the phase of the pulse is modulated by a binary valued pseudo-random sequence. The response, obtained by collecting a single point between pulses, represents an evolution of a large number of FID signals superimposed upon one another after the system has reached steady state. The output response has very little apparent resemblance to a single FID signal. The cross-correlation function of the stochastic perturbation and the response is proportional to the time-domain system impulse response. Using the cross-correlation function between the input function and the evolving composite transverse magnetization, it is possible to recover the FID, which upon FT yields the one-dimensional (1-D) spectrum. This method can be extended, by applying non-linear cross-correlation functions, to generate multidimensional spectra [20]. Experimentally, the spin system is stochastically excited with a string of equidistant low power pulses (transmit mode), with the phase of each pulse pseudo-randomly inverted. Conventionally, in each inter-pulse window (receive mode) one sample of the transverse magnetization is sampled. For white noise excitation, the impulse response function (which is the equivalent of the FID signal that results upon the application of a single pulse) is derived by cross-correlation of the excitation and magnetization response. The maximum length binary sequence (MLBS) used in stochastic excitation is a cyclic sequence, and hence coherent averaging of multiple acquisitions can be used to further improve the S/N ratio. Consequently, the size of the data to be stored in the computer is comparable to averaging multiple acquisitions of single-pulse FID signals. The advantage of replacing a truly stochastic excitation by a pseudo-random noise excitation employing the MLBS is that in the latter case, the cross correlation becomes identical to Hadamard transformation of the magnetization response. Such a procedure using the cyclic MLBS as the basis leads to better S/N ratio than the use of stochastic excitation techniques that utilize non-cyclic noise sequences. Yet another advantage of implementing stochastic excitation and the Hadamard transform to recover the FID is that when one replaces each strong RF pulse by n MLBS phase modulated pulses at a pulse repetition rate n times faster, but with power levels on the order of 1/n of the strong pulse, the S/N ratio of the data collected is expected to be similar.
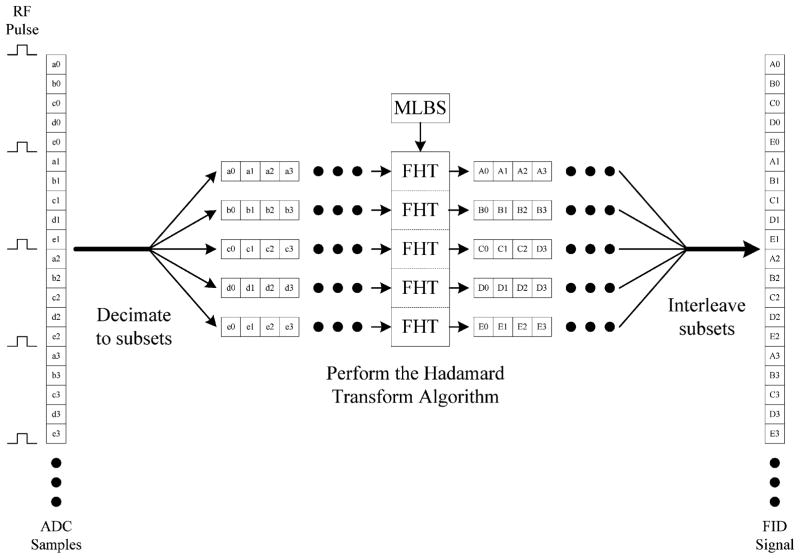
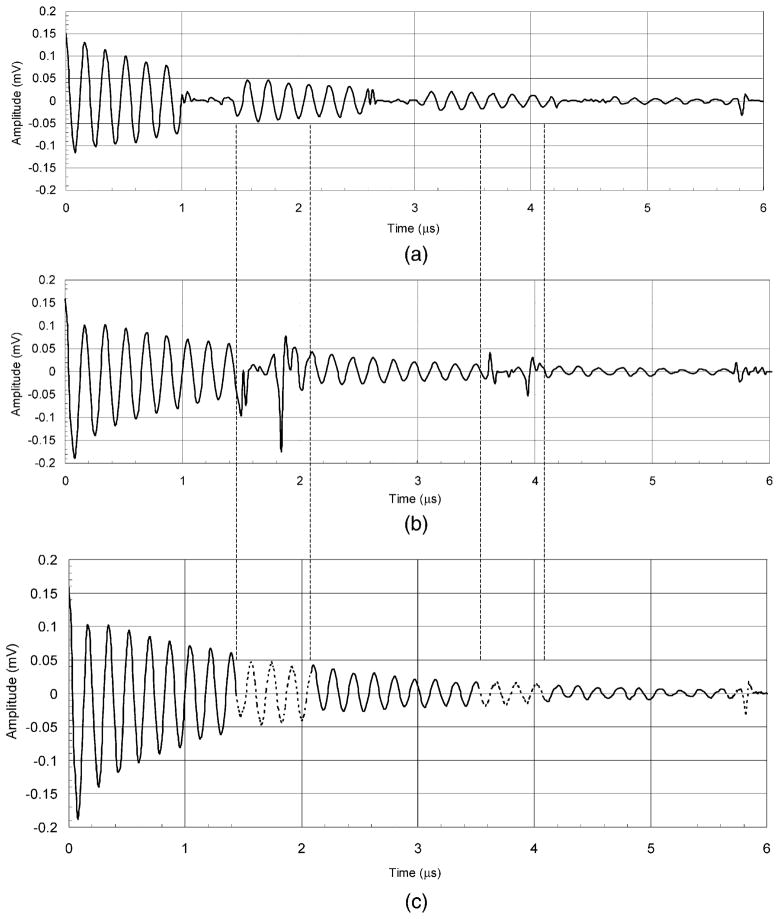
Fig. 1 shows the schematic of the EPR experiment with the pseudo-random noise excitation. In conventional NMR experiments utilizing stochastic excitation, the sampling rate is typically equivalent to the RF pulse repetition rate. In other words, one data sample is acquired per RF pulse. Also, the relaxation time of the FID signal is roughly equivalent to the time it takes to go through a full cycle of the MLBS. In our EPR experiments, the FID signal relaxation time is much shorter in time duration than the MLBS cycle time. Another notable difference is that our EPR system requires a greater bandwidth, which implies faster data acquisition rates and shorter RF pulse widths. In order to increase the effective bandwidth of the data acquisition system, the sampling rate is set K times higher than the pulse repetition rate, thus acquiring K points per RF pulse. The data are then decimated into K subsets, passed through the Hadamard transform, and reconstructed as shown in Fig. 1. The resulting waveform is the FID signal digitized at a sampling rate K times higher than the RF pulse repetition rate. Due to the time-shared nature of the system, the resulting FID signal generated from stochastic excitation system contains ‘blank’ segments in the time domain during the period when the system was switched to transmit mode. For every K point, there will be B consecutive points that will be ‘blank.’ To resolve this problem, a second sampling rate is selected, and a second set of data is acquired. The second sampling rate is selected such that the ‘blank’ areas in this second FID signal data set do not coincide with the ‘blank’ areas in the first FID signal data set. The data in the second set are then used to fill in the ‘blanks’ in the first set, thus reconstructing a complete FID signal as shown in Fig. 2 [21].
Fig. 1.
Cross-correlation using the hadamard transform with bandwidth extension (sampling rate/pulse repetition rate =5).
Fig. 2.
Example of bandwidth extension in which areas in (a) replace ‘blank’ areas in (b) resulting in (c).
2. Materials and methods
2.1. Hardware description
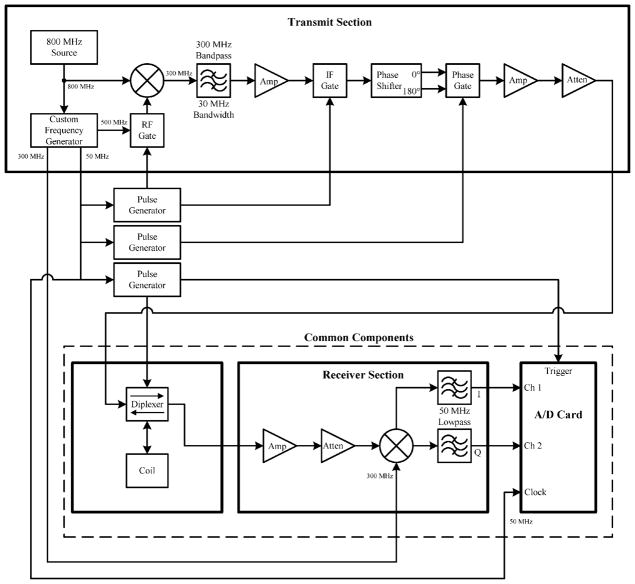
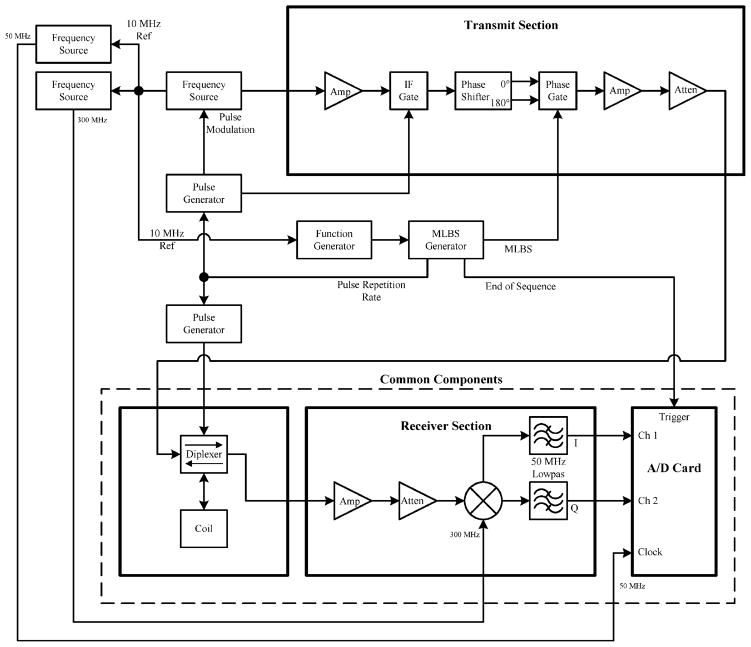
An existing 300 MHz FT-EPR spectrometer was modified for these experiments. The system is similar to our previously published system configurations [7,22]. The hardware configurations for the coherent averaging and stochastic excitation experiments are shown in Figs. 3 and 4, respectively. The transmit sections utilize different hardware in each configuration, but the receiver sections utilize the same hardware. Therefore, after setting the peak RF pulse power at the diplexer to be equivalent, the two configurations can be compared. The receiver section amplifies the EPR signal and mixes it down to quadrature baseband prior to digitization. The new data acquisition system was developed based on a two channel 12-bit Signatec Model PDA12A data acquisition card.
Fig. 3.
Test setup for coherent averaging experiments.
Fig. 4.
Test setup for stochastic excitation experiments.
The system transmit section for coherent averaging (see Fig. 3) uses a crystal controlled 800 MHz oscillator as a master source ensuring that all system signals are coherent. Using the 800 MHz signal, a custom printed circuit board generates all of the necessary coherent signals for the system. The synchronized 500 MHz signal is gated to produce a pulse with the desired width, and this 500 MHz pulse is mixed with the original 800 MHz to obtain the 300 MHz RF pulse. As shown in Fig. 3, the 300 MHz pulse passes through a phase shifter, another gate, and an amplifier stage before feeding the power amplifier (ENI 25) and diplexer. A variable attenuator was used to set the peak RF pulse power that is fed into the diplexer. The pulse generators (Stanford Research DG535) output signals to control the following: RF gates, diplexer mode (transmit/receive), and triggering of the data acquisition system. The pulse generators and the sampling clock for the data acquisition system are all driven by a synchronized 50 MHz signal. A synchronized 300 MHz signal is used to mix the received signal to quadrature baseband.
The transmitter section for stochastic excitation (see Fig. 4) utilizes a bench-top frequency source (Agilent 8648D) to generate a 300 MHz RF pulse. The 10 MHz reference output of the frequency source was used to synchronize the entire system. As shown in Fig. 4, the signal passes through several gates, a phase shifter, and an amplifier stage before feeding the power amplifier (ENI 25) and diplexer. A variable attenuator was used to set the peak RF pulse power that is fed into the diplexer. The 10 MHz reference drives custom hardware designed to generate the MLBS for the phase inversion of the RF pulse, and the trigger signal for the data acquisition system. The pulse generators, controlling the gate signals and transmit/receive mode selection of the diplexer, were all triggered by the 10 MHz reference signal. A second frequency source (Agilent 8644A) served as the local oscillator (LO) signal for the quadrature mixer in the receiver section. A third frequency source (PTS 300) provided the clock for the data acquisition system. The custom hardware generates a pulse each time the MLBS repeats to trigger the data acquisition system.
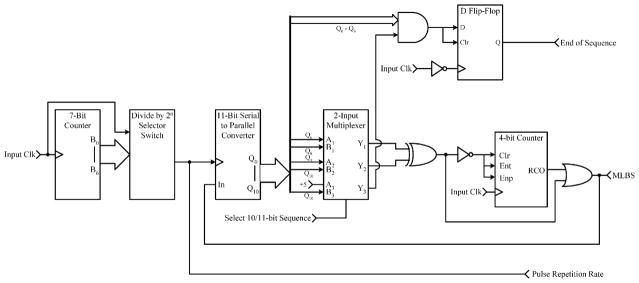
The core digital logic of the custom hardware was implemented in a programmable logic device (PLD) (Altera MAX EPM7128SLC84-6). The PLD generates the 10-/11-bit selectable MLBS. The input clock can also be selectively divided down to generate a slower sequence (see Fig. 5).
Fig. 5.
Digital logic design for generation of 10- and 11-bit MLBS.
2.2. Software description
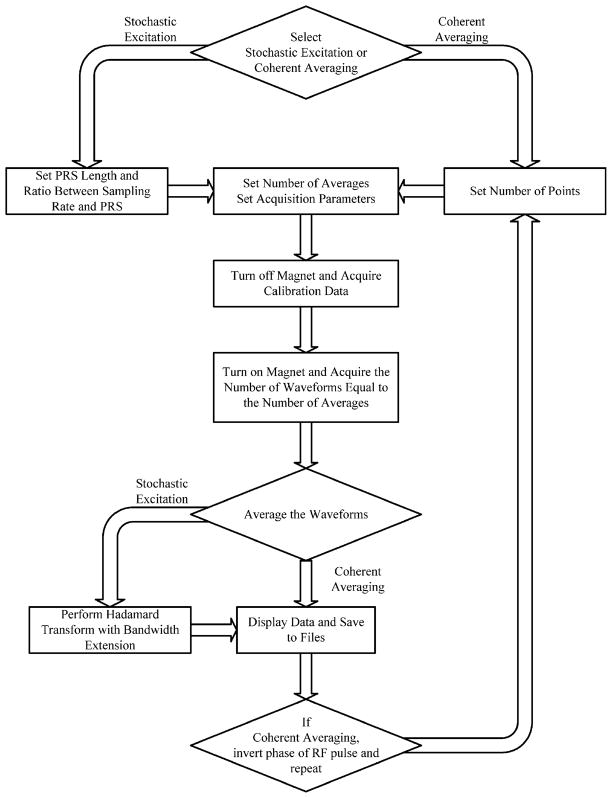
A custom software application was developed to provide the following: (1) configuration of the A/D card (Signatec PDA12), (2) control and monitoring of the data acquisition process, (3) data processing (de-multiplexing, Hadamard transform, re-multiplexing, etc.), (4) user selection of system configuration (stochastic excitation or coherent averaging), and (5) the graphical user interface (GUI). The GUI was developed in Visual Basic. The top-level program accesses a custom Dynamic Link Library (DLL) written in Visual C++ that controls the actual data acquisition and processing. The block diagram in Fig. 6 describes the flow of the program.
Fig. 6.
Flow diagram of experiment software.
For both coherent averaging and stochastic excitation configurations, the parameters of the A/D card remain constant. The A/D card is clocked and triggered externally. The input signal voltage range of the A/D card is set to its lowest value of ±0.01 V.
When the coherent averaging configuration is selected, the user enters in the number of samples per waveform (FID signal) acquisition, and the number of waveforms to average. Each trigger signal initiates an acquisition. Each acquired waveform is stored in memory until the desired number of waveforms have been collected. These waveforms are then transferred from the A/D card to the computer, and averaged.
When the stochastic excitation configuration is selected, the user enters the length of the selected MLBS, the ratio of the data acquisition sampling rate to the selected RF pulse repetition rate (bandwidth extension), and the number of waveforms (one waveform is generated over one complete MLBS cycle) to average. Each trigger signal initiates an acquisition. The total number of points acquired is equal to the product of the length of the MLBS and the ratio of the sampling rate to the RF pulse repetition rate. Each acquired waveform is transferred to the PC and stored until the desired number of waveforms have been collected. The waveforms are then averaged. The data set is then divided into a number of subsets equal to the ratio of the sampling rate to the RF pulse repetition rate. The number of data points in each subset equals the length of the MLBS. The Hadamard transform is applied to each subset, and then the data are interleaved back together.
2.3. Spin probes
The spin probe used for these EPR measurements is the paramagnetic solid lithium phthalocyanine (LiPc). The EPR spectrum of LiPc is oxygen dependent, and is in the range of 50–500 mG. For the current study, 100 mg of LiPc was kept in a glass vial sealed with a rubber septum and incubated in argon atmosphere. The line width of the EPR spectrum was <50 mG and the estimated transverse relaxation time was ≈2.7 μs. The free induction decay lasted longer than 5 μs.
2.4. Resonator
The resonator used for these EPR measurements had an inner diameter of 15 mm and length of 15 mm. The resonator was tuned to 300 MHz, with the Q reduced to approximately 22, predominately by overcoupling.
2.5. EPR measurements
All coherent averaging experiments were conducted using the following parameters: (1) 50 MHz sampling frequency, and (2) 102,300, 51,150, 20,460 or 10,230 averages. All stochastic excitation experiments were conducted using the following parameters: (1) 10-bit MLBS (1023 points), (2) 50 MHz sampling frequency, and (3) 100, 50, 20 or 10 averages. The response of the spin system to the first MLBS sequence is not taken into account. In fact the system will get into a ‘steady state’ after the application of the first MLBS sequence.
With the stochastic excitation experiments, two sets of data are acquired (different pulse repetition rates) such that the second set can be used to fill in the ‘blank’ spaces in the first set. These ‘blank’ intervals correspond to time periods when the diplexer is in transmit mode. The two pulse repetition rates were 625 and 476.2 kHz. This results in a ratio of the sampling rate to the RF pulse repetition rate of 80 and 105, respectively.
3. Results
3.1. Simulation
A software simulation was developed to facilitate our efforts in comparing stochastic excitation and coherent averaging. This simulation was developed by utilizing National Instruments LabVIEW software and was used to determine the ideal results that occur at different input noise levels and compare them to the experimental data. The received FID signal was represented by an exponentially decaying 5 MHz sine wave sampled at 50 Ms/s. The FID signal was 512 points in length, and was zero padded to 2048 points. An 11-bit MLBS was selected for the stochastic excitation simulations and the FID signal was convolved with the MLBS signal to produce the stochastically excited waveform. The evolution of the spin system during the weak pulses was ignored. White noise was added to the waveforms to produce the realistic signals. In the coherent averaging simulations, the only variable that can be changed is the amount of noise added to the simulated received FID signal. In the stochastic excitation simulations, the same variable is used to add noise. A second variable, unique to the stochastic excitation simulations, is the ratio between the sampling rate and the RF pulse repetition rate.
In the simplest case, the sampling rate and pulse repetition rate are equivalent for the stochastic excitation simulations. We added noise to the simulated signals, resulting in a 20 dB S/N ratio for the coherent averaging simulations when collecting a single waveform (number of averages =1). This coherent averaging simulation takes 42 μs of acquisition time. A single stochastic excitation acquisition was simulated with the same amount of input noise. This acquisition also takes 42 μs to complete in real time, but the S/N ratio was 53 dB, a 33 dB improvement over the coherent averaging simulation.
In a more realistic case employing bandwidth extension, the sampling rate is 80 times faster than the RF pulse repetition rate for the stochastic excitation simulations. For comparison purposes, we attempted to keep the simulated acquisition time equivalent between coherent averaging and stochastic excitation. We added noise to the simulated signals, resulting in a 20 dB S/N ratio for the coherent averaging simulations when averaging 80 waveforms, each 2048 points in length. This coherent averaging simulation required 3.36 ms of acquisition time to complete. The stochastic excitation acquisition also required 3.36 ms to complete, but the S/N ratio was 34 dB, a 14 dB improvement over the coherent averaging simulation.
Given a fixed total acquisition time for both coherent averaging (CA) and stochastic excitation (SE), further simulations indicated that there is a S/N ratio improvement when stochastic excitation is used. This improvement can be determined by:
| (1) |
| (2) |
Further simulation results showed that if a specific S/N ratio is desired, the stochastic excitation approach allows for the input power to be reduced by the amount shown in the above equation. Alternatively, if the required S/N ratio is specified, and the same input power is used for both approaches, then the stochastic excitation approach results in a reduction in necessary acquisition time represented by:
| (3) |
3.2. Frequency response
To examine the frequency response of the EPR signals in relation to the RF pulse, experiments were carried out both in coherent averaging and stochastic excitation at different values of B0. The first set of coherent averaging experiments averaged 102,300 waveforms (FID signals), resulting from a peak RF pulse power level of 0.85 W. A data set was first acquired with the B0 field inactive to provide a baseline calibration file. These data were subtracted from all subsequent data sets to minimize externally generated artifacts. Data were then acquired as the active B0 field was stepped from 10.178 mT (Lf = 285.4 MHz) to 11.238 mT (Lf = 315.2 MHz) with a step size of 0.017 mT (Δ = 0.47 MHz). At each step, 102,300 waveforms were acquired, half with the phase of the RF pulse set at 0° and half with the phase set at 180° . The two data sets (0° and 180°) were independently averaged, subtracted from each other to minimize internally generated artifacts, and then the resulting data set was stored. A fast Fourier transform (FFT) was applied to each data set. The peak FFT value near the Larmor frequency for each set was recorded. This array of peak values reflects the frequency response of the overall EPR system.
A similar procedure was followed for the stochastic excitation experiments. The experiments were conducted with the peak RF pulse power level set at 0.85 W. A data set was first acquired with the B0 field inactive to provide a baseline calibration file. These data were subtracted from all subsequent data sets to minimize externally generated artifacts. Data were then acquired as the active B0 field was stepped from 10.178 mT (Lf = 285.4 MHz) to 11.238 mT (Lf = 315.2 MHz) with a step size of 0.017 mT (Δ = 0.47 MHz). At each step, 100 waveforms were acquired, averaged, and then processed with the Hadamard transform. A FFT was applied to each resulting data set. The peak FFT value near the Larmor frequency for each set was recorded. This array of peak values reflects the frequency response of the overall EPR system.
Since the RF pulse input remained fixed in power and duration, the frequency data resulting from acquisitions (coherent averaging and stochastic excitation) should be similar to a (sin x)/x response. The frequency responses of the EPR signals were in good agreement in both modalities.
3.3. SNR comparison
The data acquired with the coherent averaging and stochastic excitation configurations using the same peak RF pulse power can be compared. Due to the nature of the stochastic excitation procedure, a single waveform acquisition (not a FID signal) is comparable to averaging a number of coherent averaging configuration waveform acquisitions (FID signal) equal to the length of the MLBS sequence used [4]. In our case, the MLBS was a 10-bit sequence (i.e., 1023 points). Therefore, averaging 100 stochastic excitation acquisitions (1023 points each) is equivalent to averaging 102,300 coherent averaging acquisitions. The resulting data from each configuration can be compared, by calculating S/N ratios. EPR responses from coherent averaging experiments collected data at peak RF power levels ranging from 0.5 mW (flip angle = 0.225°) to 4 W (flip angle = 20.1° ) in steps of 3 dB, and the number of averages ranging from 10,230 to 102,300. The smaller flip angles minimize the non-linear effects that can be associated with stochastic excitation experiments. A data set was acquired with the B0 field inactive to provide a baseline calibration file. These data were subtracted from all subsequent data sets to minimize externally generated artifacts. The B0 field was then fixed at 10.52 mT (Lf = 295 MHz). Data were then acquired with the phase of the RF pulse set at 0° and 180° . A number of waveforms equal to half of the total number of averages were acquired with the phase set at 0° , and the same number with the phase set at 180° . The two data sets (0° and 180° ) were independently averaged, subtracted from each other to minimize internally generated artifacts. The resulting data set is stored, a FFT is applied, and the S/N ratio is determined.
EPR responses from stochastic excitation experiments were collected at peak RF power levels ranging from 0.5 mW (flip angle = 0.225° ) to 4 W (flip angle = 20.1° ) in steps of 3 dB, and the number of averages ranging from 10 to 100. The smaller flip angles minimize the non-linear effects that can be associated with stochastic excitation experiments. A data set was acquired in the absence of B0 field to provide a baseline calibration file. These data were subtracted from all subsequent data sets to minimize externally generated artifacts. The B0 field was then set at 10.52 mT (Lf = 295 MHz). A number of waveforms equal to the desired number of averages were acquired with a RF pulse repetition rate of 625 kHz and same number were acquired with a RF pulse repetition rate of 476.2 kHz. The two data sets are independently averaged, decimated into subsets, passed through the Hadamard transform, and interleaved back together. The second data set was used to fill in the ‘blanks’ of the first. The resulting data set is stored, a FFT is applied, and the S/N ratio is determined.
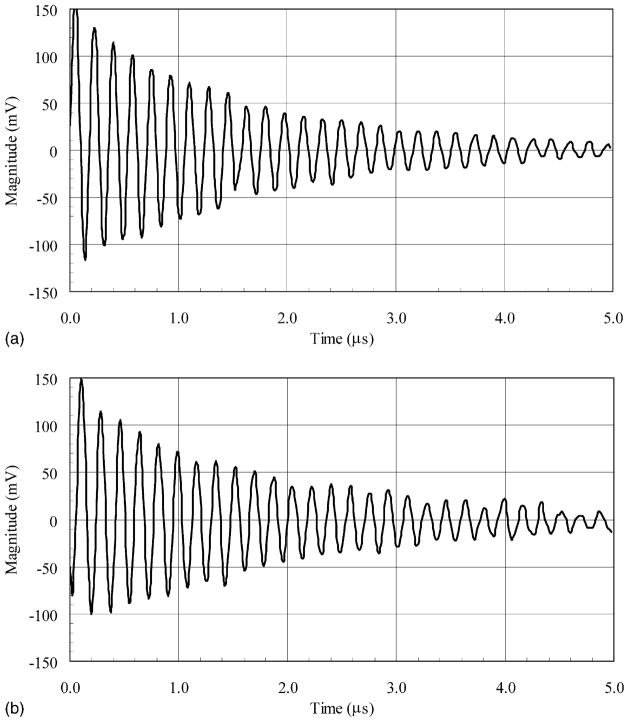
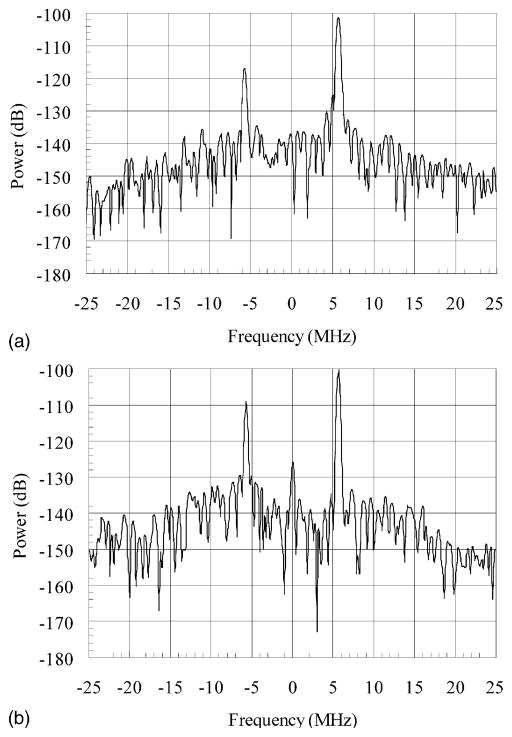
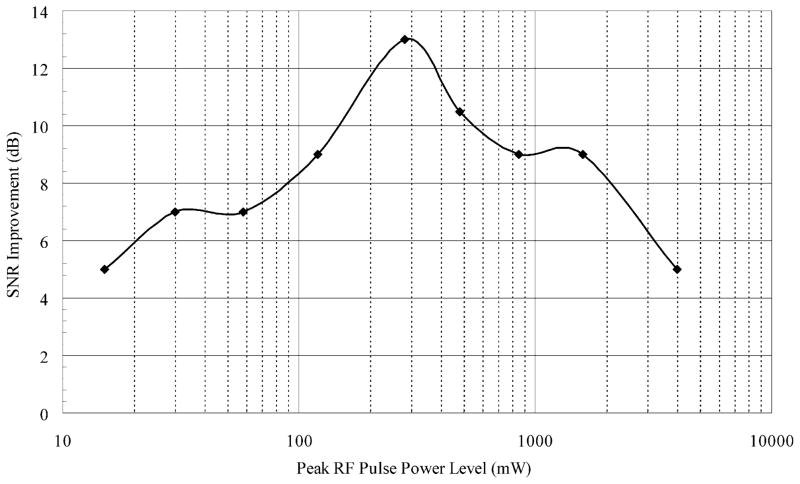
Fig. 7 shows the resulting FID signals received for each configuration with a peak input power of 4 W. Fig. 8 shows the Fourier transform of the same FID signals. After comparing the data at a range of power levels, there was an average S/N ratio improvement of 8.3 dB (see Fig. 9). The variability of the data in Fig. 9 can probably be attributed to resolution limitations of the data acquisition system, and non-linear effects that occur at larger flip angles. The experiment with the peak RF pulse power level set at 281 mW produced the best S/N ratio improvement when using stochastic excitation. The 13 dB improvement at this power level approaches the 14 dB improvement predicted by the simulations.
Fig. 7.
Received FID signals for (a) stochastic excitation and (b) coherent averaging.
Fig. 8.
Fourier transform of received FID signal for (a) stochastic excitation and (b) coherent averaging.
Fig. 9.
Plot of S/N ratio improvement vs. peak input RF pulse power.
There is no theoretical advantage for stochastic excitation over coherent averaging involving small flip angles. Since coherent averaging does not have the problem of non-linear effects at larger flip angles, higher power levels can be applied. However, in vivo imaging applications must meet the proscribed limits of the specific absorption rate (SAR) and this does define a maximum level of power that can be input into the system. The power levels tested were selected with this in mind and with the hope that stochastic excitation performed with small flip angles and low power would be a possible strategy in future imaging applications.
4. Conclusion
We have demonstrated the use of stochastic excitation utilizing the MLBS and Hadamard transform, in conjunction with bandwidth extension to perform correlation spectroscopy in time-domain EPR. The results of our experiments show that this method works with an advantage of 8–13 dB in S/N ratio. We attribute this improvement to the shorter acquisition times required by the stochastic excitation approach, which is due to the correlation with the MLBS. Each point of the coherent averaging final FID signal waveform consists of the FID signal plus noise. Each point of the stochastic excitation final FID signal waveform consists of the FID signal plus the sum of the noise across the whole waveform. Since the noise across the waveform is theoretically random, the noise is effectively reduced at each point of the stochastic excitation final FID signal waveform. This results in the observed improvement in S/N ratio when using the stochastic excitation approach.
This S/N ratio improvement, obtained with the stochastic excitation configuration, allowed a reduction in RF pulse power from 8 to 13 dB, without loss of output signal quality as compared to coherent averaging. To verify this, we compared the stochastic excitation final FID signal S/N ratio measured at a peak RF pulse power level of 281 mW to the coherent averaging final FID signal S/N ratio at a peak RF pulse power level of 1.58 W. These two measurements had S/N ratios within 1 dB of each other, even though the peak RF pulse power levels differed by 7.5 dB.
Simulations show that if the pulse repetition rate can be increased, the stochastic excitation approach can further improve EPR system performance. We expect new hardware designs within the EPR system to enable these improvements. For example, the hardware should be improved to reduce the dead time resulting from the RF input pulse and switching noise generated by the diplexer.
Of course, under the presence of imaging gradients, the transverse relaxation can become very short leading to broadening of the signals. This is true for both stochastic excitation and coherent averaging approaches. Future work would include implementing the single point or constant time imaging strategy (SPI or CTI) involving pure phase encoding, coupled with stochastic excitation.
Acknowledgments
We are grateful to Dr. Gina Hoatson, Dr. Klaus Weingarten, and Dr. David Zax for their assistance with the fast Hadamard transform and MLBS software code.
References
- 1.Halpern HJ, Yu C, Peric M, Barth E, Grdina DJ, Teicher BA. Oxymetry deep in tissues with low-frequency electron paramagnetic resonance. Proc Natl Acad Sci USA. 1994;91(26):13047–13051. doi: 10.1073/pnas.91.26.13047. [DOI] [PMC free article] [PubMed] [Google Scholar]
- 2.Murugesan R, Cook JA, Devasahayam N, Afeworki M, Subramanian S, Tschudin R, Larsen JA, Mitchell JB, Russo A, Krishna MC. In vivo imaging of a stable paramagnetic probe by pulsed-radiofrequency electron paramagnetic resonance spectroscopy. Magn Reson Med. 1997;38(3):409–414. doi: 10.1002/mrm.1910380309. [DOI] [PubMed] [Google Scholar]
- 3.Afeworki M, van Dam GM, Devasahayam N, Murugesan R, Cook J, Coffin D, Ardenkjaer-Larsen JHA, Mitchell JB, Subramanian S, Krishna MC. Three-dimensional whole body imaging of spin probes in mice by time-domain radiofrequency electron paramagnetic resonance. Magn Reson Med. 2000;43(3):375–382. doi: 10.1002/(sici)1522-2594(200003)43:3<375::aid-mrm9>3.0.co;2-g. [DOI] [PubMed] [Google Scholar]
- 4.Koscielniak J, Devasahayam N, Moni MS, Kuppusamy P, Yamada K, Mitchell JB, Krishna MC, Subramanian S. 300 MHz continuous wave electron paramagnetic resonance spectrometer for small animal in vivo imaging. Rev Sci Instrum. 2000;71(11):4273–4281. [Google Scholar]
- 5.Subramanian S, Yamada K, Irie A, Murugesan R, Cook JA, Devasahayam N, van Dam GM, Mitchell JB, Krishna MC. Non-invasive in vivo oximetric imaging by radiofrequency FT EPR. Magn Reson Med. 2002;47:1011–1018. doi: 10.1002/mrm.10133. [DOI] [PubMed] [Google Scholar]
- 6.Krishna MC, English S, Yamada K, Yoo J, Murugesan R, Devasahayam N, Cook JA, Golman K, Ardenkjaer-Larsen JH, Subramanian S, Mitchell JB. Overhauser enhanced magnetic resonance imaging for tumor oximetry: coregistration of tumor anatomy and tissue oxygen concentration. Proc Natl Acad Sci USA. 2002;99(4):2216–2221. doi: 10.1073/pnas.042671399. [DOI] [PMC free article] [PubMed] [Google Scholar]
- 7.Subramanian S, Murugesan R, Devasahayam N, Cook JA, Afeworki M, Pohida T, Tschudin RG, Mitchell JB, Krishna MC. High-speed data acquisition system and receiver configurations for time-domain radiofrequency electron paramagnetic. J Magn Reson. 1999;137:379–388. doi: 10.1006/jmre.1998.1697. [DOI] [PubMed] [Google Scholar]
- 8.Ernst RR. Magnetic resonance with stochastic excitation. J Magn Reson. 1970;3:10–27. [Google Scholar]
- 9.Kaiser R. Application of the Hadamard transform to NMR spectroscopy with pseudo-noise excitation. J Magn Reson. 1974;15:44–63. [Google Scholar]
- 10.Ziessow D, Blümich B. Hadamard-NMR-spektroskopie. Ber Bunsenges Phys Chem. 1974;11:1168–1179. [Google Scholar]
- 11.Hoatson GL, Blümich B. Deuteron Hadamard NMR of solids and liquid crystals. J Magn Reson. 1991;95:446–451. [Google Scholar]
- 12.Greferath M, Blümich B, Griffith WM, Hoatson GL. Saturation in deuteron Hadamard NMR spectroscopy of solids. J Magn Reson A. 1993;102:73–80. [Google Scholar]
- 13.Chew BGM, Wong M-Y, Zax DB. Solid-state NMR at cryogenic temperatures using stochastic excitation. J Magn Reson A. 1995;116:277–280. [Google Scholar]
- 14.Blümich B. White noise nonlinear system analysis in nuclear magnetic resonance spectroscopy. Prog NMR Spectrosc. 1987;19:331–417. [Google Scholar]
- 15.Wong STS, Roos MS, Newmark RD, Budinger TF. J Magn Reson. 1990;87:265–286. [Google Scholar]
- 16.Paff J, Blümich B, Kaiser R. Nonlinear incoherent spectroscopy: NOISY. Adv Magn Opt Reson. 1992;17:1–46. [Google Scholar]
- 17.Liao M-Y, Zax DB. Analysis of signal-to-noise ratios for noise excitation of quadrupolar nuclear spins in zero field. J Phys Chem. 1996;100:1483–1487. [Google Scholar]
- 18.Prisner T, Dinse KP. ESR with stochastic excitation. J Magn Reson. 1989;84:296–308. [Google Scholar]
- 19.Fuhs M, Prisner T, Mobius K. Fourier-transform EPR at high-field/high-frequency (3.4 T/95 GHz) using broadband stochastic microwave excitation. J Magn Reson. 2001;149:67–73. doi: 10.1006/jmre.2000.2272. [DOI] [PubMed] [Google Scholar]
- 20.Blümich B, Ziessow D. Practice of multidimensional stochastic NMR spectroscopy. The derivation of 1D, 2D and 3D spectra. J Magn Reson. 1983;52(1):42–56. [Google Scholar]
- 21.Yang D-K, Zax DB. Bandwidth extension in noise spectroscopy. J Magn Reson. 1998;135:267–270. doi: 10.1006/jmre.1998.1577. [DOI] [PubMed] [Google Scholar]
- 22.Pohida TJ, Fredrickson HA, Tschudin RG, Fessler JF, Krishna MC, Bourg J, Harrington F, Subramanian S. High-speed digitizer/averager data-acquisition system for Fourier transform electron paramagnetic resonance spectroscopy. Rev Sci Instrum. 1994;65:2500–2504. [Google Scholar]


