

Abstract
In this article, a fluorescence lifetime imaging system for small animals is presented. Data were collected by scanning a region of interest with a measurement head, a linear fiber array with fixed separations between a single source fiber and several detection fibers. The goal was to localize tumors and monitor their progression using specific fluorescent markers. We chose a near-infrared contrast agent, Alexa Fluor 750 (Invitrogen Corp., Carlsbad, CA). Preliminary results show that the fluorescence lifetime for this dye was sensitive to the immediate environment of the fluorophore (in particular, pH), making it a promising candidate for reporting physiologic changes around a fluorophore. To quantify the intrinsic lifetime of deeply embedded fluorophores, we performed phantom experiments to investigate the contribution of photon migration effects on observed lifetime by calculating the fluorescence intensity decay time. A previously proposed theoretical model of migration, based on random walk theory, is also substantiated by new experimental data. The developed experimental system has been used for in vivo mouse imaging with Alexa Fluor 750 contrast agent conjugated to tumor-specific antibodies (trastuzumab [Herceptin]). Three-dimensional mapping of the fluorescence lifetime indicates lower lifetime values in superficial breast cancer tumors in mice.
TIME-RESOLVED FLUORESCENCE LIFETIME IMAGING is a promising modality to assess the function of major cellular components in health and disease.1,2 This is based on both the specificity of fluorescence probes and the sensitivity of their emission lifetime to the environmental characteristics. Many fluorophores in the optical spectral range are known to be sensitive to temperature, pH, oxygen content, nutrient supply, and the bioenergetic status in the immediate environment of the probe.3–5 On the other hand, the fluorescence lifetime is practically independent of the concentration of the fluorescent agent and intensity of the excitation light. The lifetime tends to remain constant even when fivefold fluctuations in intensity occur.6 The heterogeneity of tumor vasculature can be observed through changes in pH and temperature.7 By selecting fluorophores with known lifetime dependence on pH and/or temperature, this method can be used for functional diagnosis of malignancies and drug targeting.
Fluorescence lifetime imaging has mostly been limited to assessing cell functions such as protein-protein interactions8 and probing protein or deoxyribonucleic acid (DNA) structures9 within superficial surface layers. Data for fluorescence lifetime imaging have been collected in time and frequency domains.10–12 The time-domain techniques provide richer information content, especially for short photon flight times.
In vivo studies of fluorescence lifetime distributions provide a promising tool to analyze molecular level variations in cellular functions, resulting from disease progression. However, in the case of fluorophores deeply embedded inside the turbid medium (eg, tissue), photon migration effects may result in considerable differences between intrinsic fluorescence lifetimes, directly related to the fluorophore environment, and observed lifetimes, that is, exponential intensity decay time. These migration effects should be taken into account for fluorescent targets inside turbid media at depths > 1 to 2 mm. Recently, several research teams analyzed different approaches to extract lifetime information.13,14 In general, the reconstruction algorithm to estimate fluorescence lifetime in the case of deeply embedded targets should be based on photon migration theoretical models.15 This required accurate source and detector positions and the optical properties of the medium as input parameters.
The goal of this study was to develop a time-resolved small animal molecular imaging system that uses near-infrared contrast agents to visualize in vivo distributions of fluorescence lifetime inside a turbid medium. The system was used to collect data by scanning a measurement head that consists of a linear fiber array with fixed separations between a single source fiber and several detection fibers over a two-dimensional region of interest (ROI). Using several separations between the source and detectors allowed us to probe different depths of the medium more efficiently. We obtained experimental results from tissue-like phantoms as well as in vivo studies of mice tumors to validate the system for future applications of minimally invasive functional imaging. Preliminary results suggest that the chosen contrast agent provides reasonable sensitivity of the fluorescence lifetime to some characteristics of the surrounding medium, in particular, pH, substantiating its future applications for monitoring of the tumor physiologic status. One advantage of the developed system-contrast agent combination was the near-infrared spectral range of its operation, which was characterized by lower absorption and scattering in the tissue compared with that of more widely used visible light. As a result, fluorophores embedded deeper in the medium become accessible for quantitative imaging. In combination with the forward model of photon migration, based on random walk (RW) theory,16 the developed instrumentation can be used to localize and reconstruct the lifetimes of deeply embedded targets in the tissue.
In the following section, we show our experimental setup, describing the laser source, the design of the measurement head, scanning, and the registration system. The first part of the Results section presents experimental results, obtained for tissue-like phantoms, including the case of deeply embedded small fluorophores, in which experimental results can be compared with predictions of the RW forward model of photon migration, published earlier. In vitro studies of the chosen infrared fluorescent dye in different environments indicate reasonable sensitivity of its lifetime to pH, making it a promising tool to probe the fluorophore environment. This is followed by the results of our animal studies using a mouse model to follow the progression of tumors by applying specific fluorescent contrast agents (based on corresponding antibodies) and analyzing fluorescence lifetime distributions.
Materials and Methods
A schematic diagram of the mouse imaging system is shown in Figure 1. The major components are a tunable pulse laser (Tsunami, Spectra Physics, Mountain View, CA) with a pulse width of 100 fs and repetition rate of 80 MHz, a time-correlated single-photon counter (TCSPC) (SPC-730, Becker & Hickl, Berlin, Germany), a photomultiplier tube (PMT) (R7422, Hamamatsu Corporation, Hamamatsu City, Japan), a temperature-controlled scanning stage (National Aperture, Inc., Salem, NH) with electrocardiogram and a temperature monitoring device for small animals (Indus Instruments, Houston, TX), and a scanning head with source and multiple detection fibers.
Figure 1.

Schematic representation of the measurement system showing the laser source, the light delivery optical fibers, photomultiplier tube (PMT), time-correlated single-photon counter (TCSPC), and scanning stage.
CCD 5 charge coupled device; CFD 5 constant fraction discriminator; ND 5 neural density.
A special scanning head was designed for the system. It consisted of multimode optical fibers with diameters of 200 μm and numeric apertures of 0.4 (PCS200, Fibre Optiques Industries, France), which were used to deliver light from an excitation source and transmit the emitted fluorescence signal to the detector. The fibers are arranged as a linear array with one of the end fibers, coupled to the excitation laser beam, used as a source fiber, whereas the other four (detection) fibers were used to collect emitted (fluorescent) light. The detection fibers were placed at given distances (2, 3, 4, and 5 mm) from the source fiber. From the detection fibers, emitted light was delivered to the PMT sequentially, using an optical switch, to measure its time-resolved intensity. An advanced TCSPC device was used in conjunction with a high-repetition rate laser to detect individual photons of periodic light signal. To improve the sensitivity of the PMT, the device was calibrated by adjusting the zero cross level and threshold of the device.17
The imager scanned in a raster pattern over the sample surface (eg, skin or other tissue) to produce a real-time two-dimensional image. Samples were scanned in the x-y directions by a step motor. A cooled charge-coupled device camera was located on the top of the scanning stage to guide the probe to the ROI on the surface of the medium. The light source fiber of the scanning head provided direct illumination of the ROI, and the fluorescence signal was detected by the PMT through the sequential coupling of the detection fibers by the optical switch. A lens and motorized rotating bandpass filter were placed in front of the PMT to measure the fluorescence signal. The output of the PMT was preamplified, and the distribution of the time of flight of the fluorophore was recorded by the TCSPC. The raw data were deconvolved using the impulse response function of the instrument, measured at the beginning of the experiments. The lifetime of the fluorophore was calculated from these deconvolved data. Before the measurements, the fibers were calibrated by injecting the same amount of light into each fiber and estimating the transmission coefficient of the individual detection channels. Although this calibration was not important for individual lifetime measurements, it was helpful to obtain intensity maps that were used for comparison lifetime distributions and localization of the fluorophore in turbid media. The system was controlled by Labview software (version 8, National Instruments, Austin, TX), and data were reconstructed using Matlab (Mathworks, Inc., Natick, MA).
Results and Discussion
Phantom Experiments
The reproducibility of the experiments was tested by measuring the lifetime of the fluorophore Alexa Fluor 750 (Invitrogen Corp., Carlsbad, CA), diluted with commonly used solvents, dimethylsulfoxide (DMSO) and pure water. In both cases, the excitation wavelength of the fluorophore was 750 nm, and the emission maximum was at the wavelength of 790 nm. Measurements were performed by placing the solutions sequentially on a mirror to exclude diffuse reflection and photon migration effects. To calculate the lifetime, the trailing edges of the curves were best fitted with a single exponential decay. The lifetime measurements were repeated five times under the same conditions at room temperature (22 ± 2°C). The lifetime values of Alexa Fluor 750 strongly depended on the solvents and were found to be 1.19 ± 0.007 ns in DMSO and 0.61 ± 0.006 ns in pure water. The estimate in pure water was close to the nominal value of 0.7 ns published by the manufacturer (Invitrogen Corp.).
Meanwhile, it was known that if the amplitude of the fluorescent signal was within a factor of 5 of the maximum, then the measured fluorescence lifetime distributions are practically insensitive to variations in the fluorophore concentration. This made lifetime a well-suited parameter to report both the presence of the fluorescent agent in the medium and possible variations in environmental factors. Images presented in Figure 2A illustrate the weak sensitivity of lifetime to fluorescence concentration. The images were obtained for two fluorescent targets on the delrin surface, differing only in the concentration of Alexa Fluor 750 in DMSO (fourfold difference). For comparison, Figure 2B demonstrated a strong (close to linear) dependence of fluorescence intensity on the probe concentration, as expected.
Figure 2.

Images at the delrin surface of (A) lifetime distribution and (B) intensity of different concentrations of Alexa Fluor 750 in dimethylsulfoxide. The concentration of the fluorophore on the left side was one-quarter of the concentration on the right side. The intensity distribution depends on the concentration of the fluorophore, but lifetime images show the presence of the fluorophore. The size of the image was 18 × 10 mm.
Our experiments showed that the effect of photon migration on the observed lifetime is noticeable even if the fluorescent target had been simply placed on the surface of the tissue-like turbid medium, such as delrin. In this case, the observed fluorescence lifetime (intensity decay time) increased to 1.4 ns (20% increase) and 0.68 ns (10% increase) in DMSO and water solution, respectively.
To assess the influence of photon migration on visible fluorescence lifetime of deeply embedded fluorophores, highly scattering tissue-like phantoms were created and fluorescent targets were placed at different depths inside the medium. The phantoms were prepared from an agarose-based gel containing a small target (1.5 mm) of Alexa Fluor 750 in water solution. The excitation source fiber was positioned directly above the fluorophore. Dependence of visible fluorescence lifetime, that is, exponential decay time, as a function of fluorophore depth is presented in Figure 3A for two source-detector separations (2 and 5 mm). Corresponding plots, illustrating the dependence of observed lifetimes on the source-detector separation for relatively deep targets, are presented in Figure 3B. As expected, the deeper the fluorophore, the smaller the effect of the source-detector separation. Figure 3B demonstrates this relationship for a variety of depths. Experimental results indicated that extraction of intrinsic lifetime values for fluorophores deeply embedded inside the turbid medium required an analytic model of photon migration such as the RW model presented previously. Here we do not present applications of this model. We limit ourselves to just one example: comparisons of experimental data for a relatively large fluorophore depth of 12.3 mm, where the model is expected to be most accurate. As shown in Figure 4, this solution agrees well with the experimental phantom data. More detailed comparisons of the theoretical model and experimental data, including results for shallow depths, are presented elsewhere.
Figure 3.

A, The lifetime of the fluorophore at different depths obtained using two detection fibers with source-detector separations of 2 and 5 mm. B, The lifetime of the fluorophore with different detection fibers at different depths is presented. Less difference between the lifetimes is observed as the fluorophore goes deeper.
Figure 4.

The distribution of fluorophore time of flight at 12.3 mm depth. A, Graph comparing raw experimental data and deconvolved data; B, graph showing how well the forward model fit the experimental data.
The general idea of fluorescence lifetime applications in biomedical optics is to get information about fluorophore surroundings (eg, pH) from variations in the observed lifetimes. For this reason, a prospective fluorescent agent should provide lifetime sensitivity to a corresponding environmental factor. Our in vitro study showed that Alexa Fluor 750, conjugated with trastuzumab (Herceptin) (Genentech Inc., San Francisco, CA) antibody developed specifically to target breast cancer cells (see below), meets this requirement. The conjugated fluorophore was placed in different pH solutions, and measurements were performed by placing the solutions sequentially on a mirror to exclude diffuse reflection and photon migration effects. To calculate lifetime, the trailing edges of the curves were best fitted with a single exponential decay. A preliminary in vitro study showed that the conjugated fluorophore lifetime is likely to be sensitive to pH, as shown in Figure 5.
Figure 5.
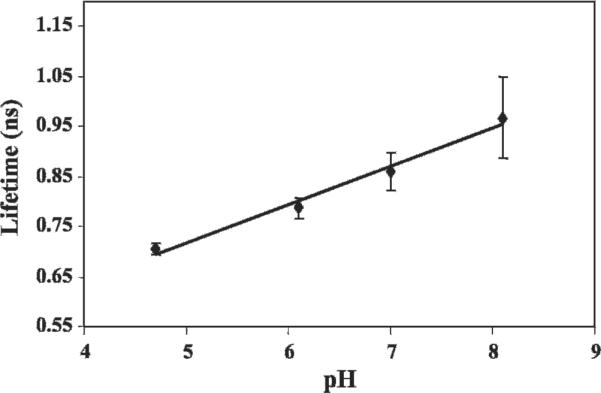
Relationship between pH and lifetime of Herceptin conjugated with Alexa Fluor 750. In vitro studies showed that the lifetime is likely to be sensitive to pH (r2 = .98).
Animal Studies
We started studies using mouse animal models with superficial tumors. This study, approved by the Animal Safety and Use Committee of the National Institutes of Health (Animal Study Proposal ROB#117), was performed with four female athymic nude mice approximately 6 to 8 weeks old. Breast cancer cells (SK-BR-3) were implanted in the flank area of the mice. These cells express high levels of HER2 (HER2/neu, c-ErbB2) protein, a 185 kDa transmembrane receptor with tyrosine kinase activity stimulating cell signaling pathways to increase cell proliferation, mobility, and survival.18 It is known to be overexpressed in a variety of epithelial tumors, and its expression is associated with poor prognosis.19,20 In this study, Alexa Fluor 750 (Invitrogen Corp.) was conjugated with Herceptin (Genentech Inc.), a HER2-specific monoclonal antibody presently used in clinics for targeted therapy of HER2-overexpressing tumors.21 The conjugate was injected through the tail vein of mice with 6 mm (diameter) tumors. Prior to imaging, an area of 13 × 12 mm covering the tumor and the surrounding area including outside the tissue was defined as the ROI. Similar experiments were repeated on other mice.
The target molecules were excited with light at a wavelength of 750 nm, delivered by the source fiber. The fluorescence signals were collected sequentially by two fibers, separated from the excitation fiber by 2 and 4 mm. The effective probing depths of these fibers were 1 and 2 mm, respectively. The scanning head moved in a raster pattern over the ROI. To follow the pharmacokinetics of the contrast agent, a series of images were obtained at different times after the injection. An example of the two-dimensional intensity distribution of the emitted light at 20 hours after the injection is presented in Figure 6. The maximum intensity was observed in the tumor region owing to higher concentration of specific contrast agent, as expected. The lifetime of the conjugated fluorophore was calculated throughout the tumor region and adjacent tissue of the tumor by fitting the exponential decay time from the trailing edge of time-resolved intensity distributions for each voxel and detection fiber. The intensity and corresponding three-dimensional lifetime distribution inside the tumor and its vicinity are shown in Figure 7. The depth dependence of lifetime was obtained using the above-mentioned simplifying assumption of the effective depth of photon penetration depth for emitted photons, reaching individual detection fibers. In the tumor area (higher-intensity region in Figure 7A), measured lifetime values prove to be lower than in the adjacent medium, as expected, if the pH inside the tumor is lower than that outside it. It is worth noting that many solid tumors exhibit lower pH values, even as low as 5.6.22 For comparison, the pH value in normal tissue ranges from 7.2 to 7.6. Similar results were observed in other mice. The conjugated fluorophore lifetime was found to be practically insensitive to body temperature.
Figure 6.

A, The green box shows the region of interest of 12 × 13 mm and B shows intensity distribution in the tumor area 20 hours after the intravenous injection of Alexa Fluor 750 conjugated with Herceptin. The intensity image shows that the maximum intensity is observed in the tumor region compared with the visual image.
Figure 7.

Distributions of (A) intensity and (B and C) three-dimensional lifetime values are observed in the tumor and adjacent areas. B corresponds to the visualization of lifetime distributions deeper within the tissue, and C corresponds to the same distributions closer to the surface. Higher intensities are observed in the area corresponding to the visible tumor. The lifetime values in the tumor area are lower than those in the adjacent area.
Comparing the measured lifetimes with the pH curve (see Figure 5) suggests a pH that is abnormally alkaline for tissue samples. This can be explained by observing that the lifetime measure was taken directly from the measured TPSF. However, further analysis was necessary, namely, a complete deconvolution of the instrument response as well as a path-length adjustment. At this time, we have tissue-like phantoms, but these are (1) homogeneous and (2) not of the correct tissue values. If we deconvolve and modify for path length based on the tissue-like phantoms, we recover pHs in the tissue/tumor range. At this time, we have not validated these measures with another technique and would not claim that the algorithm is fully rigorous as it implies an approximation and simplification of tissue properties. To remain clear that these are preliminary qualitative results, we have used raw lifetime figures to stay outside the realistic tissue range.
Conclusions
We have designed and validated a fluorescence lifetime imaging system and its potential applications for in vivo studies. In combination with an adequate reconstruction algorithm, for example, based on RW analytic formulas,16 one can obtain three-dimensional images of the fluorophore concentration/lifetime distributions. Fluorescence lifetime imaging may be applied to noninvasive animal studies of crucial metabolic-dependent conditions, such as pH and temperature. Combining our lifetime imaging system with known analytic solutions for lifetime intensity distributions can make it possible to perform time-resolved lifetime imaging in vivo for deeply embedded targets in highly scattering media.
We plan to improve the system by decreasing acquisition time and increasing both temporal and spatial resolution. In the near future, this technique will be applied to image lifetime distributions and used to locate fluorophores not only in superficial tumors but also those invading deeply located tissues (eg, liver or lung). This preliminary study showed that this system may be helpful in investigating local environmental changes caused by malignancy inside the body. These changes can potentially be used to detect tumors at an early stage and to monitor/guide therapeutic approaches based on the tumor environment.
Acknowledgments
We wish to thank Professor Israel Gannot of The George Washington University and Tel Aviv University for his helpful advice during the design of the system. In addition, we thank Ms. Abby Vogel of the University of Maryland and the National Institutes of Health for editing the manuscript and Dr. Brenda Klaunberg and Mr. Daryl Despres of the National Institute of Neurological Disorders and Stroke for their help in establishing a mouse imaging facility in our laboratory. We would also like to thank Dr. Dan Sackett of National Institute of Child Health and Human Development, NIH for providing us pH buffer solutions and his helpful discussion.
References
- 1.Bloch S, Lesage F, McIntosh L, et al. Whole-body fluorescence lifetime imaging of a tumor-targeted near-infrared molecular probe in mice. J Biomed Opt. 2005;10:054003. doi: 10.1117/1.2070148. [DOI] [PubMed] [Google Scholar]
- 2.Suhling K, Siegel J, Lanigan PM, et al. Time-resolved fluorescence anisotropy imaging applied to live cells. Opt Lett. 2004;29:584–6. doi: 10.1364/ol.29.000584. [DOI] [PubMed] [Google Scholar]
- 3.Gannot I, Ron I, Hekmat F, et al. Functional optical detection based on pH dependent fluorescence lifetime. Lasers Surg Med. 2004;35:342–8. doi: 10.1002/lsm.20101. [DOI] [PubMed] [Google Scholar]
- 4.Schaferling M, Wu M, Wolfbeis OS. Time-resolved fluorescent imaging of glucose. J Fluoresc. 2004;14:561–8. doi: 10.1023/b:jofl.0000039343.02843.12. [DOI] [PubMed] [Google Scholar]
- 5.Lakowicz JR, Szmacinski H, Nowaczyk K, et al. Fluorescence lifetime imaging. Anal Biochem. 1992;202:316–30. doi: 10.1016/0003-2697(92)90112-k. [DOI] [PMC free article] [PubMed] [Google Scholar]
- 6.Szmacinski H, Lakowicz JR. Topics in fluorescence spectroscopy, lifetime-based sensing. Plenum; New York: 1994. [Google Scholar]
- 7.Vaupel P, Kallinowski F, Okunieff P. Blood flow, oxygen and nutrient supply, and metabolic microenvironment of human tumor: a review. Cancer Res. 1989;49:6449–65. [PubMed] [Google Scholar]
- 8.Waharte F, Spriet C, Heliot L. Setup and characterization of a multiphoton FLIM instrument for protein-protein interaction measurements in living cells. Cytometry A. 2006;69:299–306. doi: 10.1002/cyto.a.20240. [DOI] [PubMed] [Google Scholar]
- 9.Cremazy FG, Manders EM, Bastiaens PI, et al. Imaging in situ protein-DNA interactions in the cell nucleus using FRET-FLIM. Exp Cell Res. 2005;309:390–6. doi: 10.1016/j.yexcr.2005.06.007. [DOI] [PubMed] [Google Scholar]
- 10.Zimmerman HE, Penn JH, Carpenter CW. Evaluation of single-photon-counting measurements of excited-state lifetimes. Proc Natl Acad Sci U S A. 1982;79:2128–32. doi: 10.1073/pnas.79.6.2128. [DOI] [PMC free article] [PubMed] [Google Scholar]
- 11.Lakowics JR. Principles of fluorescence spectroscopy. 2nd ed Kluwer Academic/Plenum Publishers; New York: 1999. [Google Scholar]
- 12.Hall D, Ma G, Lesage F, Wang Y. Simple time-domain optical method for estimating the depth and concentration of a fluorescent inclusion in a turbid medium. Opt Lett. 2004;29:2258–60. doi: 10.1364/ol.29.002258. [DOI] [PubMed] [Google Scholar]
- 13.Godavarty A, Sevick-Muraca EM, Eppstein MJ. Three-dimensional fluorescence lifetime tomography. Med Phys. 2005;32:992–1000. doi: 10.1118/1.1861160. [DOI] [PubMed] [Google Scholar]
- 14.Kumar AT, Skoch J, Bacskai BJ, et al. Fluorescence-lifetime-based tomography for turbid media. Opt Lett. 2005;30:3347–9. doi: 10.1364/ol.30.003347. [DOI] [PubMed] [Google Scholar]
- 15.Vishwanath K, Pogue B, Mycek MA. Quantitative fluorescence lifetime spectroscopy in turbid media: comparison of theoretical, experimental and computational methods. Phys Med Biol. 2002;47:3387–405. doi: 10.1088/0031-9155/47/18/308. [DOI] [PubMed] [Google Scholar]
- 16.Hattery D, Chernomordik V, Loew M, et al. Analytical solutions for time-resolved fluorescence lifetime imaging in a turbid medium such as tissue. J Opt Soc Am A Opt Image Sci Vis. 2001;18:1523–30. doi: 10.1364/josaa.18.001523. [DOI] [PubMed] [Google Scholar]
- 17.Becker W. Advanced time-correlated single photon counting techniques. In: Castleman AW, Toennies JP, Zinth W, editors. Chemical physics. Springer; Berlin, Germany: 2005. pp. 317–22. [Google Scholar]
- 18.Perona R. Cell signalling: growth factors and tyrosine kinase receptors. Clin Transl Oncol. 2006;8:77–82. doi: 10.1007/s12094-006-0162-1. [DOI] [PubMed] [Google Scholar]
- 19.Joensuu H, Isola J, Lundin M, et al. Amplification of erbB2 and erbB2 expression are superior to estrogen receptor status as risk factors for distant recurrence in pT1N0M0 breast cancer: a nationwide population-based study. Clin Cancer Res. 2003;9:923–30. [PubMed] [Google Scholar]
- 20.Menard S, Pupa SM, Campiglio M, Tagliabue E. Biologic and therapeutic role of HER2 in cancer. Oncogene. 2003;22:6570–8. doi: 10.1038/sj.onc.1206779. [DOI] [PubMed] [Google Scholar]
- 21.Tokunaga E, Oki E, Nishida K, et al. Trastuzumab and breast cancer: developments and current status. Int J Clin Oncol. 2006;11:199–208. doi: 10.1007/s10147-006-0575-4. [DOI] [PubMed] [Google Scholar]
- 22.Griffiths JR. Are cancer cells acidic? Br J Cancer. 1991;64:425–7. doi: 10.1038/bjc.1991.326. [DOI] [PMC free article] [PubMed] [Google Scholar]