

Abstract
Reporter gene assays have demonstrated both transcription-associated mutagenesis (TAM) and transcription-coupled repair, but the net impact of transcription on mutation rate remains unclear, especially at the genomic scale. Using comparative genomics of related species as well as mutation accumulation lines, we show in yeast that the rate of point mutation in a gene increases with the expression level of the gene. Transcription induces mutagenesis on both DNA strands, indicating simultaneous actions of several TAM mechanisms. A significant positive correlation is also detected between the human germline mutation rate and expression level. These results indicate that transcription is overall mutagenic.
Keywords: Mutation rate, gene expression, transcription, yeast, human
INTRODUCTION
Mutations are permanent changes in the genomic sequence. They arise from replication error, transposition and DNA damage; the last might be spontaneous or induced by chemicals or radiation. Mutation rate varies in a genome beyond what is expected from the difference in the natural mutability of the four bases [1]. For instance, mutations are more frequent in later-replicating chromosomal regions than earlier-replicating regions during a cell cycle [2, 3], and nucleosome binding reduces the mutability of cytosines (C) [4]. Transcription is yet another determinant of the mutation rate [5–8]; its exclusive impact on the transcribed regions of a genome makes it particularly important. The first indication of transcription-associated mutagenesis (TAM) arrived in the early 1970s [9, 10]. By the mid 1990s, reporter gene assays in bacteria had convincingly demonstrated that transcription induces the mutagenesis of the non-transcribed (also known as the plus, coding, or non-template) strand of a transcribed region [11]. The likely mechanism is that, during transcription, the non-transcribed strain is exposed as a single-stranded (ss) DNA, which is susceptible to chemical damage [5]. The exposure time can be quite long when the RNA polymerase is stalled or when an extended segment of the nascent mRNA is bound to the transcribed strand [5]. Reporter gene assays have also demonstrated TAM in the baker’s yeast Saccharomyces cerevisiae, but the focus has been on short insertion/deletion (indel) mutations, apparently because indel mutations are induced much more than point mutations in those assays [12–15]. More mechanisms of TAM have been suggested, including transcription-associated supercoiling and collision between replication forks and the transcription machinery [5]. Recently, it was reported in human cell lines that, under ultraviolet light treatment, the transcribed strand is also subject to TAM [16]. The probable mechanism is that photolesions in the transcribed strand cause persistent RNA polymerase stalling, which increases spontaneous deamination of C’s in the photolesions, resulting in increased C→T mutations in the transcribed strand [16]. In contrast to TAM, there are also numerous studies in bacteria and eukaryotes that showed transcription-coupled repair (TCR) of lesions in the transcribed strand [7, 8]. The likely mechanism is that bulky lesions in the transcribed strand cause RNA polymerase to stall, which recruits proteins for DNA repair [7, 8]. Thus, transcription apparently can induce both mutagenesis and repair. Because all of the above studies were on the basis of reporter gene assays, which typically quantify only a subset of mutations, were somewhat artificial (e.g., reporter genes are usually transcribed using non-native promoters or from non-native genomic locations), and might not represent the entire genome, it remains unclear whether transcription has a net effect of increasing or decreasing the mutation rate.
Answering the above question requires a genomic study. Two approaches are conceivable. First, one might compare the genome sequences of mutation accumulation (MA) lines with those of their ancestors. Second, one might compare the genome sequences of closely related species. In both approaches, it is important to examine only genomic regions that are effectively neutral such that the observed DNA changes reflect the mutation rate. Here we use both of these approaches to investigate the relationship between gene expression level and mutation rate in yeast, because reporter-based TAM and TCR are best studied in yeast among eukaryotes. We will then use the second approach to address the same question in humans.
RESULTS
Mutation rates in yeast MA lines
We first examined the impact of gene expression level on mutation rate by analysing a recently published data set of point mutations in MA lines of S. cerevisiae [4]. To boost the extremely low rate of natural point mutation in yeast [17], the authors deleted the uracil-DNA glycosylase gene UNG1, which is required for repair of uracil in DNA formed by spontaneous C deamination. Because the effective population size was maintained at 1,000–2,000 cells during the MA [4], mutations in important genes might still be subject to selection. Hence, we removed the genic regions (i.e., from the start to stop codons in gene sequences) of essential genes and non-essential genes, of which the deletion strains have fitness <0.99, and analysed the remaining regions of the genome hereby referred to as the analysed genome (see Methods). A total of 190 confirmed point mutations are present in the analysed genome. Because the MA was conducted in the rich medium YPD (yeast extract-peptone-glucose) [4], we used expression levels of the wild-type yeast in YPD [18] as proxies for the expression levels of the strain lacking UNG1, under the assumption that deleting UNG1 does not substantially alter the transcriptome. The mRNA sequencing (RNA-Seq) data [18] we analysed provide the number of sequencing reads mapped to each nucleotide position in the genome. This number is used as the expression level of each nucleotide site. The mean expression level of the 190 mutated sites is 50.08, significantly greater than the random expectation of 24.99 (P=0.0303, randomization test; Fig 1). We estimated this random expectation by picking 10,000 sets of 190 random nucleotide sites from the analysed genome. To control the different mutabilities of the four nucleotides [1, 19], we required that the 190 randomly picked sites contain the same numbers of G:C nucleotides and A:T nucleotides as observed at the mutated sites. Thus, the MA experiment demonstrates that mutations tend to occur at highly expressed sites.
Figure 1.

Higher probabilities of mutation at more strongly expressed sites in yeast MA lines. Expression level at a nucleotide site is measured by the number of RNA sequencing reads covering the site. The arrow indicates the observed mean expression level of 190 mutated sites in MA lines. The bars show the frequency distribution of the mean expression level of 190 randomly picked sites from the analysed genome, derived from 10,000 replications. Of these replications, the mean expression is equal to or greater than the observed value 303 times. MA, mutation accumulation.
Mutation rates from interspecific comparison
Because the small number of mutations in the MA lines makes it difficult to control potential confounding factors, we turned to between-species comparisons of genome sequences. Specifically, we compared S. cerevisiae with its sister species S. paradoxus. The genomic divergence between the two species is ∼11% at genic and ∼23% at intergenic regions [20]. Estimating mutation rates of different genes by interspecific comparison requires the use of effectively neutral genic regions. Because both synonymous and non-synonymous sites might be subject to natural selection that generally intensifies with the expression level [21–25], they cannot be used to estimate the mutation rates for genes of different expression levels. Instead, we estimate the mutation rate of a gene from the substitution rate of its intron sequence, which is likely to be neutral at most sites after the removal of the two ends (see Methods). The expression level of an intron is assumed to be the same as that of its mother gene estimated by RNA-Seq [18]. We observed a positive correlation between the expression level of a gene and the mutation rate estimated from its intron nucleotide substitution rate (Spearman’s rank correlation coefficient ρ=0.402, P<0.00001; Table 1; supplementary Fig S1 online). The gradual increase of the mutation rate with the expression level can be clearly seen in binned data when all introns are grouped into five equal-size bins on the basis of expression levels (Fig 2A). It has been reported that yeast introns contain regulatory sequences that promote high transcription [26, 27], suggesting that not all sites in introns are neutral. Because introns of highly expressed genes are likely to be subject to stronger purifying selection than those of lowly expressed genes, the mutation rate has been underestimated more for highly expressed genes than for lowly expressed genes. In other words, our result in Fig 2A is conservative.
Table 1. Relative contributions of several genomic features to mutation rate variation in yeast introns.
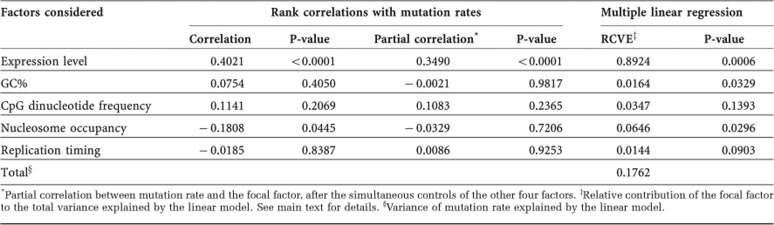
*Partial correlation between mutation rate and the focal factor, after the simultaneous controls of the other four factors.
‡Relative contribution of the focal factor to the total variance explained by the linear model. See main text for details.
§Variance of mutation rate explained by the linear model.
Figure 2.

Nucleotide substitution rates and patterns in yeast introns, on the basis of the comparison between Saccharomyces cerevisiae and S. paradoxus. (A) Substitution rate increases with expression level. Introns are grouped into five equal-size bins on the basis of expression levels, and the mean expression level and mean substitution rate of each bin are presented. Here, the expression level of an intron is determined by the median number of RNA sequencing reads in a 30-bp window located immediately upstream of the 3′ end of the annotated stop codon of the gene [18]. Error bars show one s.e. The rank correlation (ρ) indicated is for the raw unbinned data. (B) Difference in substitution frequency between introns and untranscribed regions for each of the 12 mutation types. Black and grey bars indicate transitions and transversions, respectively. Significance differences from 0 are indicated by *P<0.05, **P<0.01 or ***P<0.001 on the basis of two-tail Fisher’s exact test.
Several more factors are known to affect the mutation rate, including G+C content [19], CpG dinucleotide frequency [28], replication timing [2, 3] and nucleosome binding [4, 29]. But, the partial correlation between gene expression level and intron substitution rate remains highly significant even when the above four factors are simultaneously controlled (ρ=0.349, P<0.0001; Table 1). We conducted a multiple regression analysis to assess the relative contributions of gene expression level and the other four factors in explaining the total variance in mutation rate (Table 1). This multiple regression model explains ∼18% of the total variance in intron mutation rate. Gene expression level is the best predictor, explaining at least ∼89% of the variance explained by the model; no other factor has a significant independent contribution to the variance explained by the model after the Bonferroni correction for multiple testing (Table 1).
The RNA-Seq expression level of a gene measures the concentration of its mRNA, which is determined jointly by the mRNA synthesis rate and mRNA degradation rate. Consistent with the hypothesis that mRNA synthesis induces mutagenesis, we found the mutation rate to be significantly correlated with the mRNA synthesis rate (ρ=0.248, P=0.0055), but not the mRNA degradation rate (ρ=−0.034, P=0.71) (see Methods). The fact that the mutation rate correlates better with the mRNA concentration than mRNA synthesis rate is probably due to the generally much more accurate estimation of mRNA concentrations than synthesis rates.
Patterns of transcription-associated mutations
There are 12 possible types of single-nucleotide mutation among the four bases. Four of them are generally known to be the most frequent: C→T, A→G, G→T, and A→T [30]. C naturally deaminates to U, which simulates T and results in a C→T transition after two rounds of DNA replication. C might also be 5-methylated, especially when followed by a G in CpG, and 5-methylcytosine frequently deaminates to T. C→T transitions and G→A transitions on the complementary DNA strand are typically the most common mutations in a genome. Nucleotide A might deaminate to hypoxanthine (H), which pairs better with C than T and results in an A→G transition (and an T→C transition on the complementary strand) after two rounds of replication. Another frequent mutation is due to the oxidation of G to 8-hydroxyguanine, which can mispair with A and results in G→T after two rounds of DNA replication. G→T, as well as A→T, might also occur through depurination followed by the insertion of an A opposite the abasic site in replication.
Using S. mikatae as an outgroup of S. cerevisiae and S. paradoxus [20], we inferred all single-nucleotide substitutions that occurred in the S. cerevisiae lineage since its separation from S. paradoxus. We then calculated the difference between the frequency of each mutation type in introns and that in untranscribed regions of the genome. Here, the frequency of mutation X→Y is the number of X→Y mutations divided by the number of X in the inferred common ancestor of S. cerevisiae and S. paradoxus. On the non-transcribed strand, the above mentioned four common mutation types (C→T, A→G, G→T and A→T) all show significantly higher frequencies in introns than untranscribed regions (Fig 2B). On the transcribed strand, only C→T is more frequent in introns than untranscribed regions (Fig 2B). These patterns are consistent with the simultaneous actions of two TAM mechanisms: (i) generally increased mutagenesis on the non-transcribed strand due to the susceptibility of ssDNA to damage and (2) increased C→T mutagenesis on the transcribed strand associated with photolesion-associated RNA polymerase stalling. The C→T mutation rate appears higher on the transcribed strand than on the non-transcribed strand, although their difference is not significant (P=0.18, two-tail Fisher’s exact test). Mutational patterns of MA lines (supplementary Fig S2 online) are generally consistent with those from the interspecific comparison, although a rigorous statistical analysis is hampered by the small sample size of the MA data.
Mutation rates in the human germline
It is of significant interest to examine if highly expressed genes also have elevated mutation rates in multicellular eukaryotes. In multicellulars, one needs to distinguish germline mutations from somatic mutations, because only the former are inherited to future generations. We used alignments of human and macaque genome sequences [31] to estimate the substitution rates in introns (see Methods) and used human RNA-Seq data previously assembled [32] to estimate gene expression levels in 12 tissues, including the testis that contains the germline. To gauge the rate of transcription-associated mutations in each gene, we estimated the difference between the mutation rate of all introns of the gene and that of its flanking untranscribed regions (see Methods), because mutation rate varies among chromosomal regions [1]. We found this difference to be positively correlated with the expression level in each of the 12 tissues, after simultaneously controlling for GC content, CpG frequency, replication timing and nucleosome occupancy (Fig 3). Among the 12 tissues, 9 showed significant correlations (P<0.05) and testis exhibits the highest correlation. The generally positive correlation in non-testis tissues might be due to gene expression similarities between these tissues and the germline. Using multiple linear regression (see Methods), we estimated that doubling the expression level of an averagely expressed gene increases the mutation rate difference between its introns and flanking untranscribed regions by 15%. We also validated the above results by using different flanking regions (supplementary Fig S3 online). Because synonymous mutations behave nearly neutrally in species with low effective population sizes such as humans, we also gauged human mutation rates at synonymous sites, and positive correlation between testis expression level and mutation rate is again observed (supplementary Fig S4 online). We further confirmed our results using a more recently published RNA-Seq data [33] that include the expression levels of both humans and macaques (supplementary Fig S5 online). We did not examine the mutational pattern in the human germline, because it has been extensively studied [30, 34, 35].
Figure 3.

Partial rank correlations between gene expression levels in 12 human tissues and the nucleotide substitution rate between human and macaque, after the simultaneous controls of GC content, CpG frequency, replication timing and nucleosome occupancy. The substitution rate is estimated by the rate in introns minus that in flanking untranscribed regions (see Methods). Significant differences from 0 are indicated by *P<0.05, **P<0.01 or ***P<0.001.
DISCUSSION
In this study, we provided several lines of genomic evidence for elevated mutation rates of highly expressed genes in budding yeast and the human germline. We showed in yeast that the increased mutation rate likely results from mutagenesis associated with mRNA synthesis. Because transcription is known to induce both mutagenesis (TAM) and DNA repair (TCR), our finding suggests that, at the genomic scale, the effect of TAM overwhelms that of TCR in yeast as well as the human germline. As mentioned, TAM has several distinct molecular mechanisms that can lead to different mutational patterns. Our observations in yeast suggest that more than one TAM mechanism is at work. Specifically, the increased rates of the four most frequent types of mutation in the non-transcribed strand is likely caused by the susceptibility of this naked ssDNA to damage [11], whereas the increased rate of C→T mutation in the transcribed strand is probably caused by the mutagenesis during the extended RNA polymerase stalling [16]. One mechanism of TAM involves the collision between a DNA replication fork and RNA polymerase in the S phase of a cell cycle [5]. However, we found no correlation between the yeast intron mutation rate and expression level in the S phase [36] (ρ=−0.036, P=0.71), suggesting that the collision is not the primary cause of the observed genomic pattern of TAM. It has been suggested that TAM might be minimized by internal folding of the non-transcribed DNA strand that results in short segments of double-stranded DNA [37]. Following a previous study [37], we calculated the transcription-driven mutability index (TDMI) of each yeast intron, which is defined by the percentage of unpaired nucleotides in the non-transcribed strand of the intron (see Methods). But, TDMI and intron substitution rate are not significantly correlated, with (ρ=0.035, P=0.70) or without the control of expression level (ρ=−0.055, P=0.55; supplementary Fig S6 online), suggesting that internal folding of the non-transcribed DNA strand is not a significant factor modulating TAM in yeast.
Several reporter assays in yeast showed that transcription dramatically induces indel mutations [12–15]. But, we found no correlation between the frequencies of indels in introns and the expression levels of the introns in the comparison between S. cerevisiae and S. paradoxus (supplementary Fig S7 online), suggesting that the reporter assay results might be gene specific or condition specific. Alternatively, the effect revealed by the reporter assays is widespread, but its contribution to the genome-wide variation of indel mutation rate is too small to detect here. In the human–macaque comparison, the patterns vary among indels of different sizes (supplementary Fig S8 online).
We discovered a significantly higher germline mutation rate in strongly expressed human genes than weakly expressed ones. This significant correlation, however, disappears when the four confounding factors (GC content, CpG frequency, replication timing and nucleosome binding) are not controlled, suggesting the importance of controlling these variables and explaining why the correlation was not previously observed [1]. Nonetheless, the impact of gene expression on mutation rate, after the controls, is much weaker in human (ρ=0.083) than in yeast (ρ=0.349). This difference has several potential causes. First, the gene expression levels in the human germline might not be well approximated by those in the testis of a particular age represented by the human individual studied, which reduces the correlation with the mutation rate. Second, the correlation between the mRNA synthesis rate and mRNA concentration might be lower in human than in yeast if human has more post-transcriptional modifications than yeast. For example, microRNAs, which are short non-coding RNAs that bind to target mRNAs to cause their degradation and silencing [38], regulate ∼30% of protein-coding genes in mammals [39], but no microRNA exists in S. cerevisiae [40]. Third, it is possible that the mechanisms or the relative importance of TAM and TCR differ between yeast and the human germline. Regarding this possibility, it is important to discuss the somatic mutation rates and patterns recently revealed from human cancers. Several cancer genomic studies reported lower somatic mutation rates in more highly expressed genes and a greater reduction in C→T mutation on the transcribed strand than the non-transcribed strand [41–43]. These results are explainable by the action of TCR. Compared with the germline, cancer cells have overall much higher mutation rates [44], which implies the presence of abundant lesions on the transcribed strand that could be repaired through TCR. In other words, the impact of TCR is expected to be greater to cancer cells than to the germline because of the higher abundance of lesions in the former than the latter. By contrast, owing to the generally high background mutation rate in cancer cells, several mutations brought about by TAM become relatively insignificant. Thus, the relative impact of TAM and TCR might be reversed in cancer cells, compared with that in the germline. The mutational patterns observed in cancer cells are consistent with this interpretation [41–43].
Our finding of elevated mutation rates in highly expressed genes in yeast and human germline has several important implications. First, because highly expressed genes tend to have more important roles than lowly expressed genes [45] and because most mutations are deleterious, our finding suggests that (i) spontaneous mutations are more harmful than is now appreciated on the basis of the assumption of homogenous mutation rates and that (ii) the actual mutation load is likely greater than the present estimate. Second, the fact that transcription is overall a mutagen implies the possibility of natural selection for reduced transcription from an unnecessarily high level due simply to the benefit of reducing deleterious mutations. When a mutation rate modifier is linked to the gene whose mutation rate is being modified, the selective advantage of the modifier is Δμ if it reduces the deleterious mutation rate of the gene by Δμ per gene per generation [46]. In yeast, the average point mutation rate is 3 × 10⁻¹⁰ per nucleotide site per generation [17] and the coding region of an average gene has 1350 nucleotides [47]. If 80% of mutations in the coding region of a gene are deleterious, the deleterious mutation rate is 3.24 × 10⁻⁷ per gene per generation. If a modifier reduces the mutation rate of a gene by 20% by reducing its transcription level, its advantage is s=Δμ=0.648 × 10⁻⁷, which is slightly greater than what natural selection can detect in yeast (0.5/effective population size=0.5 × 10⁻⁷) [48]. Of course, reducing transcription should also save energy and materials [48]. Even when the protein concentration needs to be maintained, mutation rate might still be lowered by simultaneously reducing the transcription rate and increasing the translation rate. However, this strategy increases the gene expression noise [49], which typically imposes a fitness cost to the cell [50]. The current transcription/translation rate ratio might reflect a tradeoff between these antagonistic factors. Third, in yeast, the expression level of a protein has been shown to be the most important determinant of the evolutionary rate of the protein sequence, with highly expressed proteins having low amino-acid substitution rates [24]. This phenomenon has been explained by several non-mutually exclusive hypotheses: protein misfolding avoidance [23, 51], protein misinteraction avoidance [25] and protein functional importance [52, 53]. The fact that highly expressed genes experience more mutations than lowly expressed ones suggests that the strong purifying selection acting on highly expressed proteins far exceeds what is reflected from their low amino-acid substitution rates.
Contrary to our findings in yeast and the human germline, Martincorena et al [54] recently reported lower mutation rates in more strongly expressed genes in Escherichia coli. Because of the absence of introns in E. coli, these authors calculated synonymous nucleotide polymorphism (θS) of each gene using the genome sequences of 34 strains. Because synonymous mutations in E. coli are subject to natural selection, they converted θS to θS’ such that θS’ is uncorrelated with codon usage bias, two indicators of selection, and two known determinants of the mutation rate. Intriguingly, θS’ is negatively correlated with the expression level, which led the authors to suggest an evolutionary risk management strategy that has suppressed the mutation rate of highly expression genes because of their relative importance to the organism [54]. But, how accurately θS’ reflects mutation rate is unclear. We propose that a small-population MA experiment be conducted in E. coli to estimate the correlation between expression level and mutation rate. Furthermore, a negative correlation between expression level and mutation rate is also evident in human cancer cells and hence need not be a result of evolutionary risk management.
METHODS
Data sets. Details about the yeast MA lines, essential genes, fitness values of single-gene deletion strains, mRNA synthesis and degradation rates, yeast and primate intron sequences, yeast and human nucleosome occupancy data, yeast and human DNA replication timing data and yeast and primate transcriptome data are provided in supplementary information online. As described in supplementary information online, the TDMI of each yeast intron was estimated following a previous study [37].
Nucleotide substitution rates and patterns. The nucleotide substitution rate for a pair of orthologous intron sequences was estimated using the baseml module of PAML [55] under Kimura’s two-parameter model [56], because the sequence divergence is moderate here. In the case of humans, introns from the same gene are concatenated before analysis. To control regional variation in mutation rate in the human genome, we calculated the substitution rate in the introns of a gene minus that in a flanking intergenic region, which is a 5-kb segment starting from 5 kb (or 10 kb in supplementary Fig S3 online) downstream of the 3′ end of the 3′ untranslated region (UTR) of the gene. We removed the gene from our analysis if this 5-kb segment overlaps with the neighbouring gene, which is defined by a segment encompassing from 5 kb upstream of the 5′ end of 5UTR to 5 kb downstream of the 3′ end of 3UTR. Indel substitution rates were similarly estimated, except that we did not correct for potential multiple hits
To study mutational patterns in yeast, we used three-way alignments (S. cerevisiae, S. paradoxus and S. mikatae) in UCSC Genome Browser [31] to infer the intron sequences of the common ancestor of S. cerevisiae and S. paradoxus by parsimony, followed by tabulating each mutation type. Ambiguous sites by the parsimony principle were not further considered. Multiple regression analysis was conducted to evaluate the relative contributions of various factors to mutation rates, as described in supplementary information online.
Supplementary information is available at EMBO reports online (http://www.emboreports.org).
Supplementary Material
Acknowledgments
We thank X. Chen for providing the mutation data from the yeast MA lines and A. Eyre-Walker and two anonymous reviewers for valuable comments. This work was supported in part by a research grant from the US National Institutes of Health to J.Z.
Author Contributions: J.Z. conceived and designed the research; C.P. and W.Q. performed the research and analysed the data; C.P. and J.Z. wrote the manuscript.
Footnotes
The authors declare that they have no conflict of interest.
References
- Hodgkinson A, Eyre-Walker A (2011) Variation in the mutation rate across mammalian genomes. Nat Rev Genet 12: 756–766 [DOI] [PubMed] [Google Scholar]
- Lang GI, Murray AW (2011) Mutation rates across budding yeast chromosome VI are correlated with replication timing. Genome Biol Evol 3: 799–811 [DOI] [PMC free article] [PubMed] [Google Scholar]
- Stamatoyannopoulos JA, Adzhubei I, Thurman RE, Kryukov GV, Mirkin SM, Sunyaev SR (2009) Human mutation rate associated with DNA replication timing. Nat Genet 41: 393–395 [DOI] [PMC free article] [PubMed] [Google Scholar]
- Chen X, Chen Z, Chen H, Su Z, Yang J, Lin F, Shi S, He X (2012) Nucleosomes suppress spontaneous mutations base-specifically in eukaryotes. Science 335: 1235–1238 [DOI] [PubMed] [Google Scholar]
- Kim N, Jinks-Robertson S (2012) Transcription as a source of genome instability. Nat Rev Genet 13: 204–214 [DOI] [PMC free article] [PubMed] [Google Scholar]
- Aguilera A (2002) The connection between transcription and genomic instability. EMBO J 21: 195–201 [DOI] [PMC free article] [PubMed] [Google Scholar]
- Svejstrup JQ (2002) Mechanisms of transcription-coupled DNA repair. Nat Rev Mol Cell Biol 3: 21–29 [DOI] [PubMed] [Google Scholar]
- Hanawalt PC, Spivak G (2008) Transcription-coupled DNA repair: two decades of progress and surprises. Nat Rev Mol Cell Biol 9: 958–970 [DOI] [PubMed] [Google Scholar]
- Savic DJ, Kanazir DT (1972) The effect of a histidine operator-constitutive mutation on UV-induced mutability within the histidine operon of Salmonella typhimurium. Mol Gen Genet 118: 45–50 [DOI] [PubMed] [Google Scholar]
- Herman RK, Dworkin NB (1971) Effect of gene induction on the rate of mutagenesis by ICR-191 in Escherichia coli. J Bacteriol 106: 543–550 [DOI] [PMC free article] [PubMed] [Google Scholar]
- Beletskii A, Bhagwat AS (1996) Transcription-induced mutations: increase in C to T mutations in the nontranscribed strand during transcription in Escherichia coli. Proc Natl Acad Sci USA 93: 13919–13924 [DOI] [PMC free article] [PubMed] [Google Scholar]
- Takahashi T, Burguiere-Slezak G, Van der Kemp PA, Boiteux S (2011) Topoisomerase 1 provokes the formation of short deletions in repeated sequences upon high transcription in Saccharomyces cerevisiae. Proc Natl Acad Sci USA 108: 692–697 [DOI] [PMC free article] [PubMed] [Google Scholar]
- Datta A, Jinks-Robertson S (1995) Association of increased spontaneous mutation rates with high levels of transcription in yeast. Science 268: 1616–1619 [DOI] [PubMed] [Google Scholar]
- Kim N, Jinks-Robertson S (2009) dUTP incorporation into genomic DNA is linked to transcription in yeast. Nature 459: 1150–1153 [DOI] [PMC free article] [PubMed] [Google Scholar]
- Lippert MJ, Kim N, Cho JE, Larson RP, Schoenly NE, O’Shea SH, Jinks-Robertson S (2011) Role for topoisomerase 1 in transcription-associated mutagenesis in yeast. Proc Natl Acad Sci USA 108: 698–703 [DOI] [PMC free article] [PubMed] [Google Scholar]
- Hendriks G, Calleja F, Besaratinia A, Vrieling H, Pfeifer GP, Mullenders LH, Jansen JG, de Wind N (2010) Transcription-dependent cytosine deamination is a novel mechanism in ultraviolet light-induced mutagenesis. Curr Biol 20: 170–175 [DOI] [PMC free article] [PubMed] [Google Scholar]
- Lynch M et al. (2008) A genome-wide view of the spectrum of spontaneous mutations in yeast. Proc Natl Acad Sci USA 105: 9272–9277 [DOI] [PMC free article] [PubMed] [Google Scholar]
- Nagalakshmi U, Wang Z, Waern K, Shou C, Raha D, Gerstein M, Snyder M (2008) The transcriptional landscape of the yeast genome defined by RNA sequencing. Science 320: 1344–1349 [DOI] [PMC free article] [PubMed] [Google Scholar]
- Gojobori T, Li WH, Graur D (1982) Patterns of nucleotide substitution in pseudogenes and functional genes. J Mol Evol 18: 360–369 [DOI] [PubMed] [Google Scholar]
- Kellis M, Patterson N, Endrizzi M, Birren B, Lander ES (2003) Sequencing and comparison of yeast species to identify genes and regulatory elements. Nature 423: 241–254 [DOI] [PubMed] [Google Scholar]
- Qian W, Yang JR, Pearson NM, Maclean C, Zhang J (2012) Balanced codon usage optimizes eukaryotic translational efficiency. PLoS Genet 8: e1002603. [DOI] [PMC free article] [PubMed] [Google Scholar]
- Hershberg R, Petrov DA (2008) Selection on codon bias. Annu Rev Genet 42: 287–299 [DOI] [PubMed] [Google Scholar]
- Drummond DA, Wilke CO (2008) Mistranslation-induced protein misfolding as a dominant constraint on coding-sequence evolution. Cell 134: 341–352 [DOI] [PMC free article] [PubMed] [Google Scholar]
- Pal C, Papp B, Hurst LD (2001) Highly expressed genes in yeast evolve slowly. Genetics 158: 927–931 [DOI] [PMC free article] [PubMed] [Google Scholar]
- Yang JR, Liao BY, Zhuang SM, Zhang J (2012) Protein misinteraction avoidance causes highly expressed proteins to evolve slowly. Proc Natl Acad Sci USA 109: E831–E840 [DOI] [PMC free article] [PubMed] [Google Scholar]
- Parenteau J, Durand M, Morin G, Gagnon J, Lucier JF, Wellinger RJ, Chabot B, Elela SA (2011) Introns within ribosomal protein genes regulate the production and function of yeast ribosomes. Cell 147: 320–331 [DOI] [PubMed] [Google Scholar]
- Juneau K, Miranda M, Hillenmeyer ME, Nislow C, Davis RW (2006) Introns regulate RNA and protein abundance in yeast. Genetics 174: 511–518 [DOI] [PMC free article] [PubMed] [Google Scholar]
- Hwang DG, Green P (2004) Bayesian Markov chain Monte Carlo sequence analysis reveals varying neutral substitution patterns in mammalian evolution. Proc Natl Acad Sci USA 101: 13994–14001 [DOI] [PMC free article] [PubMed] [Google Scholar]
- Washietl S, Machne R, Goldman N (2008) Evolutionary footprints of nucleosome positions in yeast. Trends Genet 24: 583–587 [DOI] [PubMed] [Google Scholar]
- Mugal CF, von Grunberg HH, Peifer M (2009) Transcription-induced mutational strand bias and its effect on substitution rates in human genes. Mol Biol Evol 26: 131–142 [DOI] [PubMed] [Google Scholar]
- Fujita PA et al. (2011) The UCSC Genome Browser database: update 2011. Nucleic Acids Res 39: D876–D882 [DOI] [PMC free article] [PubMed] [Google Scholar]
- Xiong Y, Chen X, Chen Z, Wang X, Shi S, Wang X, Zhang J, He X (2010) RNA sequencing shows no dosage compensation of the active X-chromosome. Nat Genet 42: 1043–1047 [DOI] [PubMed] [Google Scholar]
- Brawand D et al. (2011) The evolution of gene expression levels in mammalian organs. Nature 478: 343–348 [DOI] [PubMed] [Google Scholar]
- Polak P, Arndt PF (2008) Transcription induces strand-specific mutations at the 5' end of human genes. Genome Res 18: 1216–1223 [DOI] [PMC free article] [PubMed] [Google Scholar]
- Green P, Ewing B, Miller W, Thomas PJ, Green ED (2003) Transcription-associated mutational asymmetry in mammalian evolution. Nat Genet 33: 514–517 [DOI] [PubMed] [Google Scholar]
- Cho RJ et al. (1998) A genome-wide transcriptional analysis of the mitotic cell cycle. Mol Cell 2: 65–73 [DOI] [PubMed] [Google Scholar]
- Hoede C, Denamur E, Tenaillon O (2006) Selection acts on DNA secondary structures to decrease transcriptional mutagenesis. PLoS Genet 2: e176. [DOI] [PMC free article] [PubMed] [Google Scholar]
- Bartel DP (2004) MicroRNAs: genomics, biogenesis, mechanism, and function. Cell 116: 281–297 [DOI] [PubMed] [Google Scholar]
- Filipowicz W, Bhattacharyya SN, Sonenberg N (2008) Mechanisms of post-transcriptional regulation by microRNAs: are the answers in sight? Nat Rev Genet 9: 102–114 [DOI] [PubMed] [Google Scholar]
- Drinnenberg IA, Weinberg DE, Xie KT, Mower JP, Wolfe KH, Fink GR, Bartel DP (2009) RNAi in budding yeast. Science 326: 544–550 [DOI] [PMC free article] [PubMed] [Google Scholar]
- Lee W et al. (2010) The mutation spectrum revealed by paired genome sequences from a lung cancer patient. Nature 465: 473–477 [DOI] [PubMed] [Google Scholar]
- Pleasance ED et al. (2010) A comprehensive catalogue of somatic mutations from a human cancer genome. Nature 463: 191–196 [DOI] [PMC free article] [PubMed] [Google Scholar]
- Pleasance ED et al. (2010) A small-cell lung cancer genome with complex signatures of tobacco exposure. Nature 463: 184–190 [DOI] [PMC free article] [PubMed] [Google Scholar]
- Araten DJ, Golde DW, Zhang RH, Thaler HT, Gargiulo L, Notaro R, Luzzatto L (2005) A quantitative measurement of the human somatic mutation rate. Cancer Res 65: 8111–8117 [DOI] [PubMed] [Google Scholar]
- Zhang J, He X (2005) Significant impact of protein dispensability on the instantaneous rate of protein evolution. Mol Biol Evol 22: 1147–1155 [DOI] [PubMed] [Google Scholar]
- Kimura M (1967) On the evolutionary adjustment of spontaneous mutation rates. Genet Res 9: 23–34 [Google Scholar]
- Zhang J (2000) Protein-length distributions for the three domains of life. Trends Genet 16: 107–109 [DOI] [PubMed] [Google Scholar]
- Wagner A (2005) Energy constraints on the evolution of gene expression. Mol Biol Evol 22: 1365–1374 [DOI] [PubMed] [Google Scholar]
- Fraser HB, Hirsh AE, Giaever G, Kumm J, Eisen MB (2004) Noise minimization in eukaryotic gene expression. PLoS Biol 2: e137. [DOI] [PMC free article] [PubMed] [Google Scholar]
- Wang Z, Zhang J (2011) Impact of gene expression noise on organismal fitness and the efficacy of natural selection. Proc Natl Acad Sci USA 108: E67–E76 [DOI] [PMC free article] [PubMed] [Google Scholar]
- Yang JR, Zhuang SM, Zhang J (2010) Impact of translational error-induced and error-free misfolding on the rate of protein evolution. Mol Syst Biol 6: 421. [DOI] [PMC free article] [PubMed] [Google Scholar]
- Cherry JL (2010) Expression level, evolutionary rate, and the cost of expression. Genome Biol Evol 2: 757–769 [DOI] [PMC free article] [PubMed] [Google Scholar]
- Gout JF, Kahn D, Duret L (2010) The relationship among gene expression, the evolution of gene dosage, and the rate of protein evolution. PLoS Genet 6: e1000944. [DOI] [PMC free article] [PubMed] [Google Scholar]
- Martincorena I, Seshasayee AS, Luscombe NM (2012) Evidence of non-random mutation rates suggests an evolutionary risk management strategy. Nature 485: 95–98 [DOI] [PubMed] [Google Scholar]
- Yang Z (2007) PAML 4: phylogenetic analysis by maximum likelihood. Mol Biol Evol 24: 1586–1591 [DOI] [PubMed] [Google Scholar]
- Kimura M (1980) A simple method for estimating evolutionary rates of base substitutions through comparative studies of nucleotide sequences. J Mol Evol 16: 111–120 [DOI] [PubMed] [Google Scholar]
Associated Data
This section collects any data citations, data availability statements, or supplementary materials included in this article.