Abstract
BACKGROUND:
Accurate projections of plastic surgeon workforce requirements are essential to ensure a high standard of care and to properly allocate health care resources. Wait-time data were used to identify geographical areas that may benefit from additional plastic surgeons.
METHODS:
Plastic surgery wait times were analyzed using data from Ontario’s Wait Time Information System for 2009 to 2010. Data were compared with benchmarks published by the Canadian Society of Plastic Surgeons, and plastic surgeon density was captured by the Ontario Physician Human Resources Data Centre.
RESULTS:
Aggregate plastic surgery wait times at the 90th percentile failed to meet targets based on priority. For priority 2 (target = 28 days) and priority 3 cases (target = 84 days), wait times were 35 and 101 days, respectively (P<0.05). Wait times also consistently exceeded provincial standards in the southwestern (Local Health Integration Network [LHIN] 2), eastern (LHINs 10 and 11) and northeastern (LHIN 13) regions of Ontario. A negative correlation (r=−0.37; P<0.05) between wait times and surgeon density for priority 4 cases was observed, suggesting that more surgeons per capita is associated with shorter wait times for these lower-priority cases. In contrast, a positive correlation was observed for priority 2 (r=0.50; P<0.05) and priority 3 cases (r=0.35; P<0.05).
CONCLUSION:
Plastic surgery wait times in Ontario exceeded benchmarks in several geographical regions. Paradoxically, for high-priority cases, wait times were longer in LHINs with a higher density of plastic surgeons. Further investigation into patient mobility, physician practice patterns and the availability of hospital resources, such as hospital beds or operating room time, is required.
Keywords: Number of plastic surgeons, Plastic surgeon workforce, Wait times, Workforce projections
Abstract
HISTORIQUE :
Il est essentiel de projeter avec précision les besoins en plasticiens pour assurer des normes de soins élevées et bien affecter les ressources. Les chercheurs ont utilisé les données sur les temps d’attente pour déterminer les régions géographiques qui pourraient profiter d’un plus grand nombre de plasticiens.
MÉTHODOLOGIE :
Les auteurs ont analysé les temps d’attente en chirurgie plastique à l’aide des données du Système d’information sur les temps d’attente de l’Ontario de 2009 à 2010. Ils ont comparé les résultats avec les normes de référence publiées par la Société canadienne des chirurgiens plasticiens et établi la densité de plasticiens grâce à l’Ontario Physician Human Resources Data Centre.
RÉSULTATS :
Les temps d’attente regroupés en chirurgie plastique au 90e percentile ne respectaient pas les cibles sur le plan de la priorité. Dans les cas de priorité 2 (cible = 28 jours) et de priorité 3 (cible = 84 jours), les temps d’attente étaient de 35 et de 101 jours, respectivement (P<0,05). De plus, les temps d’attente dépassaient constamment les normes provinciales dans les régions du sud-ouest (réseau local d’intégration des services de santé [RLISS] 2), de l’est (RLISS 10 et 11) et du nord-est (RLISS 13) de l’Ontario. Les chercheurs ont observé une corrélation négative (r=−0,37; P<0,05) entre les temps d’attente et la densité des chirurgiens dans les cas de priorité 4, ce qui laisse supposer qu’un plus grand nombre de chirurgiens per capitas’associe à des temps d’attente plus courts pour ces cas moins prioritaires. Par contre, on observait une corrélation positive dans les cas de priorité 2 (r=0,50; P<0,05) et de priorité 3 (r=0,35; P<0,05).
CONCLUSION :
En Ontario, les temps d’attente en chirurgie plastique dépassent les normes de référence dans plusieurs régions géographiques. Paradoxalement, dans les cas prioritaires, les temps d’attente demeuraient plus longs dans les RLISS où l’on trouvait une plus forte densité de plasticiens. Des recherches plus approfondies s’imposent sur la mobilité des patients, les profils de pratique des médecins et la disponibilité des ressources hospitalières, telles que les lits d’hôpitaux ou les heures en salle d’opération.
Accurately projecting physician workforce requirements is an important component of ensuring a high standard of medical care and judicious use of scarce health care resources. It is essential to have an adequate supply of well-educated providers to meet current and future health care needs. Accurate prediction of physician workforce requirements involves considering the factors that affect both physician supply and demand (Table 1). These factors include projecting future population characteristics, the need for future services, and estimating the future practice patterns of physicians and availability of health care resources. This is not a straightforward task. Longstanding concerns of impending physician surpluses have been replaced with growing awareness of physician shortages across all fields of medicine (1–3).
TABLE 1.
Factors affecting plastic surgeon workforce requirements
| Supply variables | Demand variables |
|---|---|
| Physician retirement patterns | Population growth rate and age |
| Sex | Health care delivery system |
| Generational differences in work patterns | New technologies |
| Geographical distributions | |
| Practice composition | Overall economy |
| Length of training | Insurance coverage and reimbursement |
| Cost of education and debt | Health care use patterns |
| IMG importation | Overlap with other specialties |
| Number of residency positions | Competing surgeons |
| Operating room time | Supply-related demand |
| Hospital beds and nursing staff | |
| Hospital’s ability to recruit |
IMG International medical graduate
In plastic surgery, studies of surgeon workforce requirements have been limited. In 1993, a study commissioned by the American Society of Plastic Surgeons predicted a 35% increase in the number of plastic surgeons by 2020, even with significant reductions (40%) in training and education (4). On the other hand, in 2007, Macadam et al (5) surveyed Canadian plastic surgeons to determine perceived surgeon supply. Limited by a 42% response rate and self-report, 78% of respondents believed that there were not enough plastic surgeons. Wait times for elective, noninsured and urgent consultation were 32 weeks, 11 weeks and 11 days, respectively. The authors hypothesized that to maintain current ratios of plastic surgeons in Canada, surgeon training would need to increase by 10 graduates per year. Rohrich et al (6) performed a similar survey in the United States. In contrast with Canada, more than one-half of the respondents (55%) believed that there was an excess supply of board-certified plastic surgeons. The authors, however, conclude that there would be a significant shortage of plastic surgeons in the next 10 to 15 years due to an increasing and aging population, and a decrease in residency training programs.
There is significant interest in determining future plastic surgery workforce requirements. Accurate predictions may be used to lobby government, third-party insurers and hospital administration for additional resources. Annual meetings to specifically discuss physician workforce concerns have been convened by both the Royal College of Physicians and Surgeons of Canada (www.royalcollege.ca/public/advocacy/policy/hrh) and the Association of American Medical Colleges (www.aamc.org/initiatives/workforce/). Given these concerns and the limited evidence for plastic surgeon workforce requirements, we analyzed patient wait times for common plastic surgery procedures in Ontario. We hypothesized that longer wait times indicate a demand for more plastic surgeons, complementary resources, such as operating room time, and better allocation of health care resources.
METHODS
A retrospective study of plastic surgery wait times in Ontario was performed using the Wait Time Information System (WTIS), a prospective database administered by the government of Ontario (7). All patient wait times from nonemergent surgeries performed in publicly funded Ontario hospitals are captured. Wait times were defined as the time from the surgeon’s decision to treat to the time of surgery. Data from 2009 to 2010, the first year available, were analyzed according to procedure type, priority and geographical location (Local Health Integrated Network [LHIN]). Geographical location was that of the surgeon. Procedure categories were defined by the WTIS, and categories were selected for inclusion depending on the availability of data and corresponding benchmarks for comparison. Surgeons assigned each case a surgical priority according to guidelines published by the WTIS. Priority 1 (emergent) cases were not captured in the database. Priority 2 cases were defined as those associated with constant or frequent severe pain/symptoms, significantly impacting the ability to perform usual activities, or high probability of disease progression with an impact on morbidity or mortality. Priority 3 cases were associated with mild or occasional pain/symptoms, minimal to moderate impact on the ability to perform usual activities or low probability of disease progression. Priority 4 cases were for elective surgery with minimal risk of morbidity incurred by waiting. Provincial targets for priority 2, 3 and 4 cases were 28, 84 and 184 days, respectively.
Ninetieth percentile wait times were compared with wait-time benchmarks published by the Canadian Society of Plastic Surgeons (8) and provincial targets (7). The 90th percentile was used instead of mean or median because of the clinical utility of this summary statistic. Wait time data were compared with physician data obtained from the Ontario Physician Human Data Resource Centre (9).
Correlations and P values from t statistics were calculated to show the statistical significance of each result. Data for up to three quarterly WTIS observations for 14 LHINs were available; however, there was only one measure of surgeons per capita for each LHIN. Correlations, therefore, were estimated using all observations and the test statistics were adjusted for the grouped/clustered nature of the data. P values were generated using degrees of freedom equal to the number of LHINs, minus 1, rather than the number of observations. This produced P values that were more conservative than standard methods. Not all LHINs, however, reported priority 2 surgeries in some quarters, or at all; therefore, the sample size was sometimes reduced and noted accordingly.
Research ethics approval from St Joseph’s Healthcare (Hamilton, Ontario) was obtained for the present study.
RESULTS
The WTIS database captured 32,785 plastic surgery cases in 2009/2010. A breakdown of these cases according to procedure type is presented in Figure 1. The majority of the cases were breast reconstruction (26%) and upper extremity surgery (34%).
Figure 1).
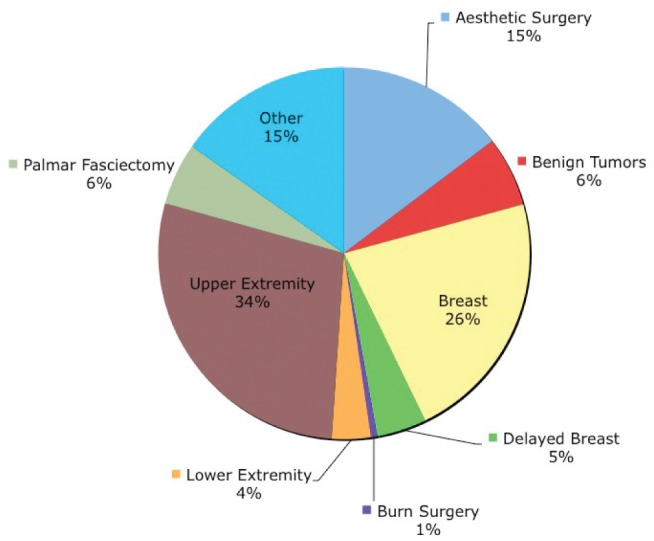
Distribution of plastic surgery procedures in public hospitals according to type (n=32,785)
Provincial wait times according to procedure and priority are summarized in Figures 2 and 3, respectively. 90th percentile (± SD) wait times exceeded Canadian Society of Plastic Surgeons benchmarks when examined according to procedure type: upper extremity – palmar fasciectomy (145±13 days versus 120 days; P=0.013), lower extremity reconstruction (117±22 days versus 60 days; P=0.004), burn surgery (73±33 days versus 7 days; P=0.011) and aesthetic surgery in public hospitals (164±18 days versus 120 days; P=0.005). Provincial targets for wait times were exceeded for both priority 2 (35±2 days versus 28 days; P=0.001) and priority 3 (97±9 days versus 84 days; P=0.03) cases.
Figure 2).
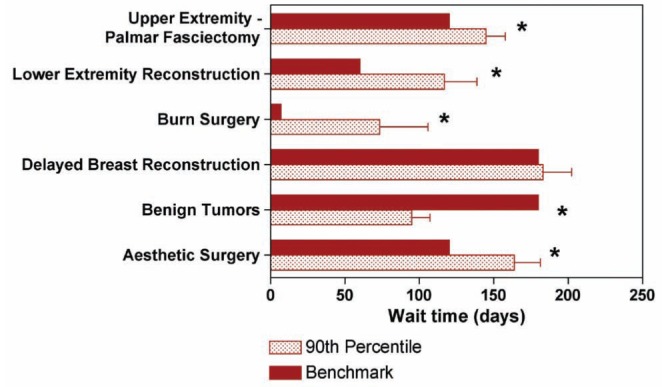
Comparison of 90th percentile wait times (shaded) with Canadian Society of Plastic Surgeons benchmarks (solid) according to procedure type in public hospitals. Error bars represent SD. *Statistically significant (ie, P<0.05)
Figure 3).
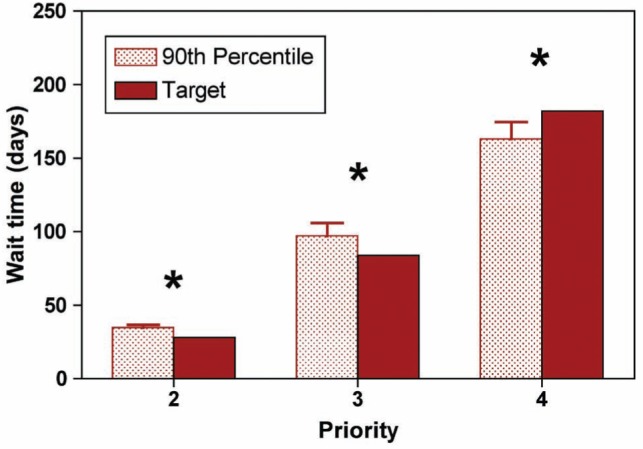
Comparison of 90th percentile wait times (shaded) with provincial benchmarks (solid) according to procedure priority. Error bars represent SD. *Statistically significant (ie, P<0.05)
In Ontario, health care administration is subdivided into geographical regions known as LHINs. Wait times according to LHIN are presented for priority 2, 3, and 4 cases in Figure 4. 90th percentile wait times consistently exceeded provincial targets in southwestern (LHIN 2), eastern (LHIN 10 and 11) and northeastern (LHIN 13) regions of Ontario.
Figure 4).
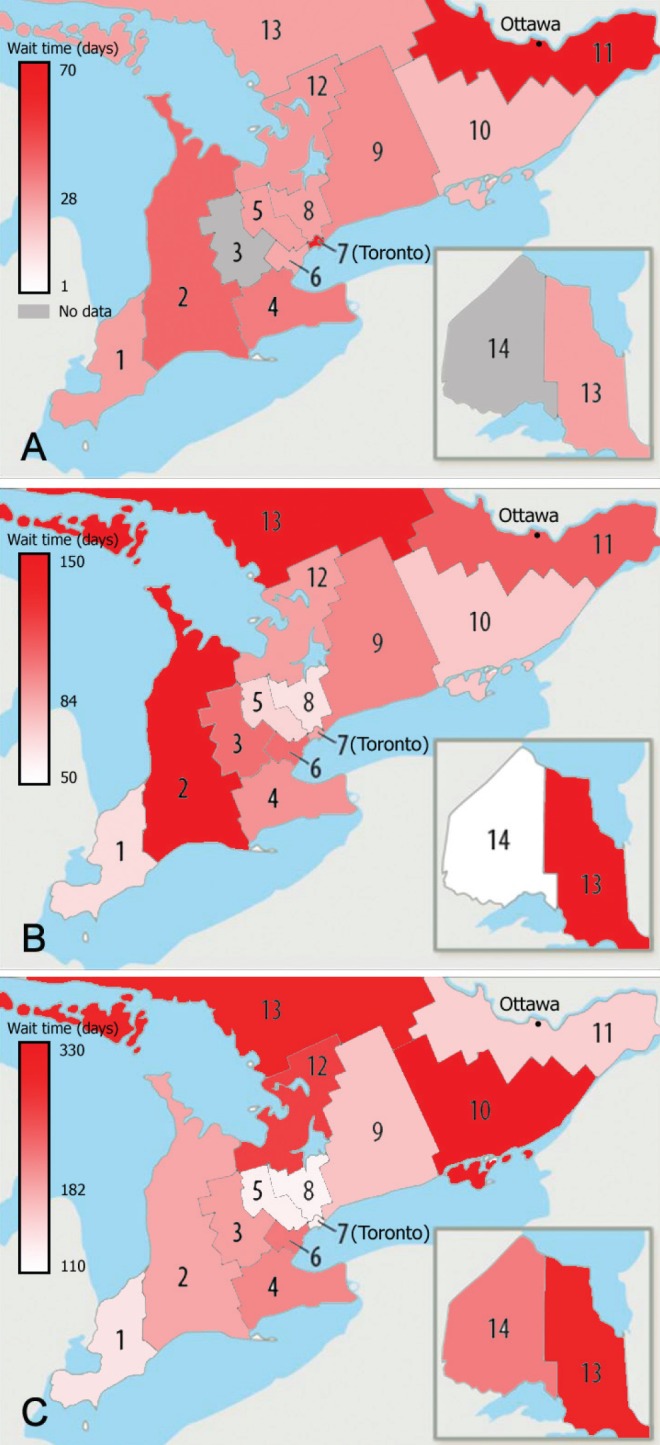
Wait times according to geographical region (Local Health Integration Network) for priority 2 (target 28 days) (A), priority 3 (target 84 days) (B) and priority 4 cases (target 182 days) (C)
The density of plastic surgeons according to LHIN is presented in Table 2. Toronto, Ontario (LHIN 7), has the highest density of plastic surgeons (3.85 plastic surgeons per 100,000 population), while southeastern (LHIN 10) and northwestern Ontario (LHIN 14) have the lowest density of surgeons: 0.82 and 0.42 surgeons per 100,000 population, respectively. Correlating the density of plastic surgeons to the wait times for elective (priority 4) surgeries revealed a correlation coefficient of −0.41 (P<0.01) (−0.37; P<0.05, after removing Toronto as an outlier). This negative correlation means that, as expected, increased surgeon density is associated with shorter wait times for elective (priority 4) surgeries (Figure 5). For more urgent cases (priorities 2 and 3), however, the correlation coefficient between surgeon density and wait times was, perhaps surprisingly, positive (r=0.30; P<0.05 [r=0.50; P<0.01 without Toronto]) and r=0.09; P=0.56 [r=0.35; P<0.05 without Toronto]), respectively. Longer – not shorter – wait times for these high priority cases were observed in regions with higher surgeon densities (Figure 6).
TABLE 2.
Density of plastic surgeons according to Local Health Integration Network (LHIN) in Ontario
|
Plastic surgeons
|
|||
|---|---|---|---|
| LHIN | LHIN name | n | Per 100,000 |
| 7 | Toronto Central | 44 | 3.85 |
| 11 | Champlain (eg, Ottawa) | 20 | 1.62 |
| 4 | Hamilton Niagara | 22 | 1.58 |
| 8 | Central (eg, Aurora and Woodbridge) | 24 | 1.40 |
| 9 | Central East (eg, Pickering and Haliburton) | 21 | 1.35 |
| 2 | South West (eg, London and Tobermory) | 12 | 1.26 |
| 13 | North East (eg, Sudbury and James Bay) | 7 | 1.23 |
| 6 | Mississauga, Halton | 13 | 1.14 |
| 12 | North Simcoe, Muskoka | 5 | 1.11 |
| 5 | Central West (eg, Brampton and Caledon) | 8 | 0.98 |
| 3 | Waterloo Wellington | 7 | 0.95 |
| 1 | Erie-St Clair (eg, Windsor) | 6 | 0.93 |
| 10 | South East (eg, Kingston) | 4 | 0.82 |
| 14 | Northwest (eg, Thunder Bay) | 1 | 0.42 |
Figure 5).
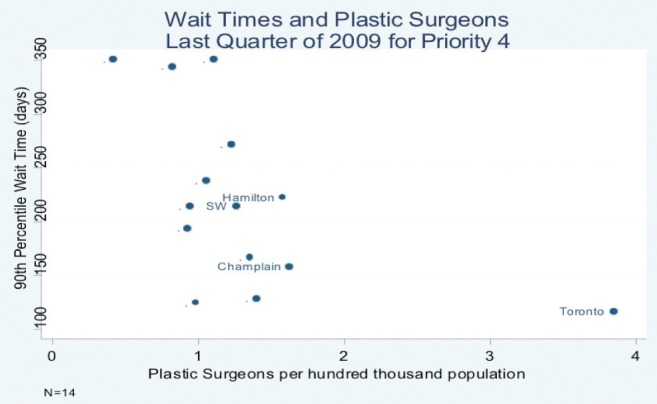
Wait times for priority 4 cases according to surgeon density in each Local Health Integration Network (LHIN). SW Southwest region (LHIN 2)
Figure 6).
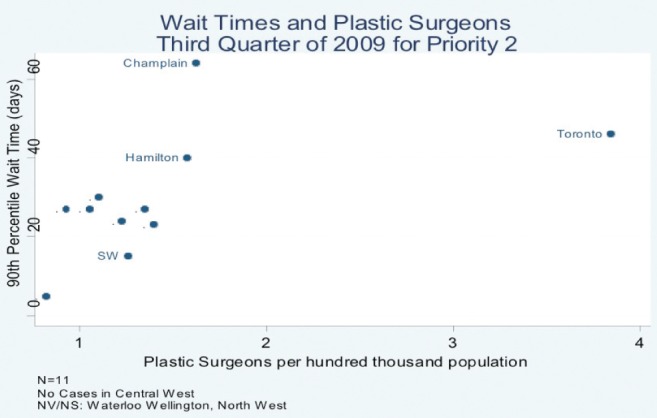
Wait times for priority 2 cases according to surgeon density in each Local Health Integration Network (LHIN). SW Southwest region (LHIN 2); NV/NS No or low volume, no service information available
DISCUSSION
Ninetieth percentile provincial wait times for plastic surgery in Ontario vary according to procedure type, priority and geographical location. Wait-time benchmarks were exceeded for upper extremity (palmar fasciectomy), lower extremity reconstruction, burn surgery and aesthetic surgery. Provincial targets were also exceeded for nonelective (priority 2 and 3) cases. These results suggest that there is demand for more plastic surgeons with an interest or formal training in hand, microsurgical reconstruction and burn surgery. In addition, a reallocation of patients and/or health care resources, such as increased operating room time and hospital beds, may be indicated to meet the demands for higher priority surgeries.
Wait-time data from Ontario’s WTIS are objective and prospectively collected. They are routinely scrutinized for accuracy, are comprehensive and capture all nonemergent procedures performed in the main operating room of publicly funded hospitals in the province. Previous studies examining the future need for plastic surgeons, in contrast, have been based on survey and opinion. Response rates in these surveys have been poor (42% [5]; 35.5% to 71.8% [6]). To our knowledge, only one other study has been performed using a demand-based model to predict future plastic surgeon workforce requirements. Commissioned by the American Society of Plastic and Reconstructive Surgeons in 1994, Wiggins et al (4) assessed both the demand for plastic surgery and the supply of services available from the current work-force. Plastic surgeon density in the United States was predicted to increase from one plastic surgeon per 60,683 people in 1993 to one per 38,658 people in 2020. Even with significant (40%) reductions in plastic surgeon residency training positions, an increase in plastic surgeon density was predicted to be one per 51,866 people by 2020.
Regionally, specific geographical areas across the province have wait times that consistently exceed provincial targets. At first glance, this suggests that more plastic surgeons are required. Closer examination of the correlation between wait times and plastic surgeon density, however, indicates that this problem is significantly more complex. While the negative correlation for low priority (priority 4) surgeries support the hypothesis that higher surgeon density reduces wait times, the positive correlation observed for high priority surgeries (priority 2 and 3) demonstrated that wait times were longer despite a higher density of surgeons. In a system that optimally allocates resources to meet medical necessity and minimize wait times, wait times should not be positively correlated with surgeon density.
The observed correlations may be the result of several factors: patients in LHINs with low plastic surgeon density travelling to major centres for high-priority or more complex surgeries; and/or surgeons in high-density LHINs performing more aesthetic surgery in private centres not captured by the WTIS. These factors effectively decrease the density of plastic surgeons performing publicly funded procedures. Similarly, variations in physician practice patterns, due to preference and expertise, across regions must also be considered. Additionally and/or alternatively, the allocation of hospital resources, such as nursing availability, bed availability or remuneration, may be the source of ‘bottle necks’ that increase patient wait times. Increasing the number of plastic surgeons may only be part of the solution to improve patient wait times.
While wait-time data in the WTIS are comprehensive, there are some limitations to this dataset. Emergent cases (priority 1) and procedures performed in private clinics and minor procedure rooms were not captured. For example, 90th percentile wait times for burn surgery (73±33 days) and aesthetic surgery (164±18 days) significantly exceeded benchmarks of seven days and 120 days, respectively. For burn surgery, this suggests that procedures defined as burn surgery may include burn contracture release and other nonemergent procedures, resulting in falsely elongated wait times. Wait times for aesthetic surgery, meanwhile, may be inaccurate because surgeries performed in private surgery centres – where arguably a significant proportion of aesthetic surgery would be performed – were not captured. Moreover, wait-time data only capture the time from the surgeon’s decision to treat to the time of operation. The wait time from referral to initial consultation may also be important in determining demand for plastic surgeons.
Accurate projection of plastic surgeon workforce requirements remains a difficult but important task. Conclusions can greatly impact the allocation of funding for training positions, operative time and support staff. It is essential to recognize the limitations of the different techniques for projecting workforce requirements to prevent misinterpretation of results. Such misinterpretations have previously had significant and long-term consequences for health care practice, policy and funding (10). Long patient wait times may indicate a need for additional plastic surgeons; however, physician practice patterns and the availability of complementary health care resources must also be considered.
Acknowledgments
The authors thank Andrew Boyd for research assistance.
Footnotes
DISCLOSURES: The authors have no financial disclosures or conflicts of interest to declare.
REFERENCES
- 1.Kirch DG, Vernon DJ. Confronting the complexity of the physician workforce equation. JAMA. 2008;299:2680–2. doi: 10.1001/jama.299.22.2680. [DOI] [PubMed] [Google Scholar]
- 2.Sheldon GF, Schroen AT. Supply and demand: Surgical and health workforce. Surg Clin North Am. 2004;84:1493–509. doi: 10.1016/j.suc.2004.07.001. [DOI] [PubMed] [Google Scholar]
- 3.Weinstein JN, Goodman D, Wennberg JE. The orthopaedic workforce: Which rate is right? JBJS Am. 1998;80:327–30. doi: 10.2106/00004623-199803000-00003. [DOI] [PubMed] [Google Scholar]
- 4.Wiggins V, Camp M, Petersen G. ASPRS Plastic Surgery Market and Workforce Study. Bryan: RRC Inc; 1994. [Google Scholar]
- 5.Macadam SA, Kennedy S, Lalonde D, Anzarut A, Clarke HM, Brown EE. The Canadian plastic surgery workforce survey: Interpretation and implications. Plast Reconstr Surg. 2007;119:2299–306. doi: 10.1097/01.prs.0000261039.86003.f0. [DOI] [PubMed] [Google Scholar]
- 6.Rohrich RJ, McGrath MH, Lawrence WT, Ahmad J, American Society of Plastic Surgeons Plastic Surgery Workforce Task Force Assessing the plastic surgery workforce: A template for the future of plastic surgery. Plast Reconstr Surg. 2010;125:736–46. doi: 10.1097/PRS.0b013e3181c830ec. [DOI] [PubMed] [Google Scholar]
- 7.Wait Time Information System. < www.health.gov.on.ca/en/pro/programs/waittimes/surgery/strategy.aspx> (Accessed April 20, 2011)
- 8.Sigurdson L, Campbell E, Carr N. Canadian Society of Plastic Surgery Wait Times Benchmark Initiative. < www.waittimealliance.ca/wait_times.htm> (Accessed April 22, 2011)
- 9.Ontario Physician Human Data Resource Centre. < www.ophrdc.org> (Accessed July 10, 2011)
- 10.Beck IT, Thomson M. The health care philosophy that nearly destroyed Medicare in Canada in a single decade. Clin Invest Med. 2006;29:65–76. [PubMed] [Google Scholar]


