Abstract
Recent interest in the development of drug particle-laden strip-films suggests the need for establishing standard regulatory tests for their dissolution. In this work, we consider the dissolution testing of griseofulvin (GF) particles, a poorly water-soluble compound, incorporated into a strip-film dosage form. The basket apparatus (USP I) and the flow-through cell dissolution apparatus (USP IV) were employed using 0.54% sodium dodecyl sulfate as the dissolution medium as per USP standard. Different rotational speeds and dissolution volumes were tested for the basket method while different cell patterns/strip-film position and dissolution media flow rate were tested using the flow-through cell dissolution method. The USP I was not able to discriminate dissolution of GF particles with respect to particle size. On the other hand, in the USP IV, GF nanoparticles incorporated in strip-films exhibited enhancement in dissolution rates and dissolution extent compared with GF microparticles incorporated in strip-films. Within the range of patterns and flow rates used, the optimal discrimination behavior was obtained when the strip-film was layered between glass beads and a flow rate of 16 ml/min was used. These results demonstrate the superior discriminatory power of the USP IV and suggest that it could be employed as a testing device in the development of strip-films containing drug nanoparticles.
Key Words: BCS class II, dissolution, drug nanoparticles, flow-through cell, pharmaceutical strip-films
INTRODUCTION
Most of the drug compounds currently being developed exhibit limited bioavailability due to poor solubility (1,2). To overcome this limitation, these compounds have to be further processed, and in most cases their particle size is reduced (3–7). As per the Noyes–Whitey equation, formation of finer drug particles leads to an increase in dissolution rate, which can be related to an increase in the drug bioavailability (8). Early experimental work by de Villiers (9,10) shows the importance of particle size and the state of agglomeration on the dissolution for particles larger than 3 μm. As the particle size reaches nanometer dimensions, this effect is further increased as the surface-to-volume ratio increases very rapidly resulting in a significant enhancement in dissolution rates and solubility (11). Although it is well known that, theoretically, nanoparticles are expected to dissolve faster than particles in the micron range as per the Noyes–Whitney equation, some researchers have observed either the opposite behavior or lack of expected improvements. Previous work has shown that the aggregation of the drug nanoparticles when incorporated in a solid dosage form resulted in uncontrolled dissolution rates (12). Work by Finholt indicated that the wetting behavior of a hydrophobic drug would be compromised with decreasing particle size, resulting in the inability to properly measure the dissolution rate (13). With nanoparticles, both agglomeration and poorer wetting may be accentuated and may affect their dissolution, hence generating a need for a suitable dissolution method that can truly discern the nanoparticle dissolution behavior to better understand the extent of improvements (13).
Drug particles with reduced sizes can be produced by top–down approaches such as high-pressure homogenization (14) and wet stirred media milling (WSMM) (15,16) or by bottom–up approaches such as emulsion precipitation (17) and supercritical fluid-based techniques (18). In order to show the improvement in dissolution that could be achieved by such particle engineering techniques, it is important that the dissolution method employed must be capable of discriminating between particle sizes, particularly between nanoparticles (less than 400 nm) and microparticles (>1 μm). Among the different dissolution equipment available, the basket apparatus (USP 1) and paddle apparatus (USP 2) are typically used. Recently, the flow-through cell (USP 4) dissolution apparatus has also received much attention because of its flexibility for research and development. The flow-through cell dissolution apparatus has been successfully used to study dissolution of different solid dosage forms including tablets, capsules, powders, suppositories, dispersed systems, implants, and microspheres (19–26). This dissolution technique has been proven to be reproducible and robust, which is an important characteristic for dissolution testing (27–29). The increased sensitivity of the flow-through cell dissolution method related to particle size of a poorly soluble drug powder has also been reported recently (30,31). In the work by Heng et al. (31), the paddle, rotating basket, and flow-through cell from the USP, and a dialysis method, were used to measure the dissolution rates of cefuroxime axetil as a model for drug nanoparticles. The flow-through cell was shown to be most suitable for dissolution analysis and performance evaluation of drug nanoparticles in powder form. It was also shown that the dissolution profiles follow the Noyes–Whitney model: the increase in dissolution rate as particles become smaller results from the increase in surface area and solubility of the drug nanoparticles.
Although the use of the USP 1, USP 2 and USP 4 for conventional solid dosage forms have been presented before (19–26), there is usually a lack of standard regulatory tests for new solid dosage forms, which represents a major obstacle in their development (31). One of these new solid dosage forms, pharmaceutical strip-film products, has received much attention because of several advantages including rapid disintegration and dissolution in the oral cavity and increased bioavailability (32–35). In this work, we present a comparison between the basket method and the flow-through cell dissolution apparatus for the dissolution analysis of polymer strip-films containing dispersed particles of griseofulvin (GF), taken as a model Biopharmaceutical Classification System (BCS) class II drug, with the ultimate goal of discriminating drug dissolution with respect to drug particle size. Achieving 100% dissolution, albeit desirable, was not the major goal of this study. We have recently developed a novel process for transforming nanosuspensions produced from WSMM into strip-films containing drug nanoparticles (36). It was shown that a discriminating dissolution medium was required to study the effects of drug particle size on the dissolution. In the present work, we systematically study the dissolution behavior of strip-films containing GF particles using a 5.4-mg/ml sodium dodecyl sulfate (SDS) solution as recommended by the USP (37). One disadvantage of using SDS solution as the dissolution medium for GF is that as the SDS concentration is increased above the critical micelle concentration (CMC, 0.0082 M), the solubility of GF increases significantly (38). Therefore, particle size dependence on dissolution rate (particle size discrimination) is less distinct. Consequently, to be able to discriminate strip-film formulations with different drug particle sizes using SDS above the CMC, a more discriminating dissolution method that can achieve better size discernment is needed. In this work, we propose to use the flow-through cell for this purpose. In order to have an objective assessment of the discriminatory behavior difference between the basket method and flow-through cell dissolution methods, different rotational speeds, and dissolution media volumes are employed in the basket method, whereas different sample patterns and dissolution medium flow rates are investigated in the flow-through cell dissolution method. This work attempts to provide direction or guideline in the development of strip-film technology, not only by performing fundamental dissolution studies but also trying to explain results providing possible mechanisms for dissolution behavior.
MATERIALS AND METHODS
Materials
The drug molecule, used as an example, in this study was GF (Sigma-Aldrich, Saint Louis, MO). SDS (Sigma-Aldrich, Saint Louis, MO) and low molecular weight hydroxypropyl methyl-cellulose (HPMC; Methocel E15LV; Dow Chemical) were used as a suspension stabilizer. HPMC (Methocel E15LV) was also used as a film former. Glycerin (Sigma) was used as a plasticizer. All these materials were used as-received.
Preparation of Suspensions
Nanosuspensions
The GF nanosuspensions (226 g) were prepared by WSMM. An HPMC concentration of 2.21% (w/w) and an SDS concentration of 0.44% (w/w) were used based on previous optimization studies (15,36). HPMC was dissolved in 200 g deionized water using a shear mixer (Fisher Scientific Laboratory stirrer, Catalog No. 14-503, Pittsburgh, PA) running at a fixed speed of 300 rpm for 30 min. SDS was then dissolved in the HPMC solution and stirred for 15 min. 8.85% (w/w) drug was then dispersed into the stabilizer solution with the shear mixer running for 30 min.
GF suspensions prepared via mixing, as mentioned above, were subsequently milled in a Netzsch wet media mill (Microcer, Fine particle technology LLC, Exton, PA), which operated in the recirculation mode. Zirconia beads with a nominal size of 400 μm were used as the milling media and a 200-μm screen was used to retain the beads in the milling chamber. Zirconia beads with a 50-ml bulk volume were loaded to the milling chamber (80-ml capacity). The GF suspension was loaded in the holding tank and pumped through the milling chamber at a fixed speed of 126 ml/min using a peristaltic pump. The milling continued for 60 min at a rotor tip speed of about 10.5 m/s. The final median particle size obtained was 144 nm. The temperature inside the mill was maintained at less than 32°C with the help of a chiller (Advantage Engineering, Inc., Greenwood, IN).
A polymer solution (50 g) containing 10% (w/w) HPMC and 10% (w/w) glycerin was added to the nanosuspension produced from WSMM (50 g), mixed for 3 h using a dual-propeller mixer (McMaster, Catalog No. 3471 K5, Los Angeles, CA) attached to a motor (VWR OVERHEAD STIR VOS 16 V120) and left to rest until no bubbles were observed (36). The final concentration of each ingredient and the drug particle size are reported in Tables I and II, respectively.
Table I.
Final Suspension Formulations (in Water) Used for Film Formation
| Materials | Microparticles (%, w/w) | Nanoparticles (%, w/w) |
|---|---|---|
| Griseofulvin | 4.20 | 4.42 |
| HPMC Methocel E-15LV | 6.12 | 6.11 |
| Sodium dodecyl sulfate | 0.23 | 0.22 |
| Glycerin | 4.97 | 5.00 |
Table II.
Particle Size in the Suspension for the Micro- and Nanoformulations (These Values Correspond to the Distributions Presented in Fig. 3)
| Microparticles (μm) | Nanoparticles (μm) | |
|---|---|---|
| d 10 | 1.497 | 0.097 |
| d 50 | 5.031 | 0.144 |
| d 90 | 15.432 | 0.217 |
Microsuspensions
GF (4.40 g, as received) and 0.24 g of SDS were added to a polymer solution (100 g) containing 6.4% (w/w) HPMC/5.2% (w/w) glycerin. The components were mixed as described above. The final concentration of each ingredient and the drug particle size are reported in Tables I and II, respectively.
Particle Size Distribution
The particle size distribution of suspensions was measured by laser diffraction in Coulter LS13320 (Beckman Coulter, Miami, FL). A sample of the suspension (approximately 0.5 ml) was taken at the end of milling from the holding tank of the mill while the suspension was being stirred. For the purpose of diluting this sample, it was dispersed in 15 ml of the stabilizer solution containing HPMC and SDS corresponding to the formulation that was being milled, by stirring with a pipette. The sample was added drop-wise until the polarization intensity differential scattering reached 40% for all the samples.
Preparation of Strip-Films Containing GF Particles
The final viscous suspensions containing drug nanoparticles obtained from wet media milling or as-received drug microparticles were then cast onto a stainless steel plate using a Doctor Blade (Elcometer) with an aperture of about 1,000 μm. The films were then dried overnight in an oven (Gallenkamp 300 Plus Series, UK) at 42°C. The theoretical amount of drug in the resulting films, assuming the amount of water in the film is negligible, accounted for approximately 27% (w/w) of the film composition.
Characterization of Strip-Films Containing Particles
Film Thickness
The thickness of the different strip-films was measured using a digital micrometer (Mitutoyo, Japan) with an accuracy of 0.001 mm. Thickness was measured at four randomly chosen different locations of the film and the average thickness was calculated.
SEM
Field emission scanning electron microscope (FESEM) LEO1530VP GEMINI (Carl Zeiss, Inc., Peabody, MA) was used to observe the morphology and distribution of particles in films. A small piece of the strip-film was placed on the carbon tape for the cross-sectional analysis of the strip-films using a double 90° SEM Mount. Samples were carbon coated using a sputter coater (Bal-Tec MED 020 HR) prior to imaging.
In vitro Dissolution Testing
Basket Method (USP 1)
A fully automated VK 7010 Varian Inc. (Santa Clara, CA) was used coupled with a UV spectrophotometer Cary 50 from Varian Inc. (Santa Clara, CA). Samples were taken at different time intervals and filtered using a 0.2-μm PTFE syringe filter (Millipore Millex-LG) before testing. A wavelength of 251 nm was used to quantify the concentration of GF during the dissolution. Films with average thickness of 100 μm were cut into 0.70 cm2 disk samples using a manual punch for dissolution studies. The volume of the dissolution medium (0.54% (w/w) SDS solution) was varied (500 and 900 ml). The basket speed was also varied (50, 100, and 150 rpm), while the temperature was maintained at 37 ± 0.5°C. Six samples were used and the average API release and standard deviation were plotted as a function of time. All these experiments were done under sink conditions.
Flow-Through Cell Dissolution Method (USP 4)
A fully automated flow-through cell dissolution apparatus (USP 4, Sotax, Switzerland) in a closed loop configuration and with cells of an internal diameter of 22.6 mm (31,39) was used. A Thermo Evolution UV spectrophotometer was used to automatically measure the GF concentration using a previously generated calibration curve. A wavelength of 251 nm was used to quantify the GF concentration during the dissolution process. A 0.2-μm filter (Pall HT Tuffryn Membrane Disc Filters) was used for this study. The use of filters with larger pore sizes than the drug nanoparticle has been presented before in the literature. For example, Liu et al. used a 0.22-μm filter for celecoxib nanosuspensions having a mean diameter of 159 ± 15 nm (40). Kakran et al. used 0.45 μm filter for artemisinin particles with diameters between 100 and 360 nm. (41). The main purpose of the filter was to separate large aggregates of drug particles (>200 nm) and clusters of disintegrated film from the dissolution sample with the assumptions that GF nanoparticles <200 nm dissolve relatively fast. In fact, in our prior work we observed no appreciable difference in dissolution between using 0.1 or 0.2 μm filters (36). The temperature was maintained at 37 ± 0.5°C during testing. The flow rates of the dissolution medium through the cells were 4, 8, and 16 ml/min. The dissolution medium (0.54% (w/w) SDS solution, 100 ml) was circulated by pumping it through each cell. Even though the volume of dissolution medium used is between five to ten times less than what is used in the USP 1 tests, sink conditions are still maintained. It has been shown that the solubility of GF at the SDS concentration used in this study is approximately 600 mg/l (38). In the current experiments the concentrations employed (based on the 0.54% (w/w) SDS solution volume used in the dissolution studies) are approximately 20 mg/l, which is well below the solubility limit. The use of less amount of dissolution medium in the flow-through cell is hence justified, and in fact is a potential advantage of this method compared with the basket method. Six samples were used and the average drug release and standard deviation were plotted as a function of time. The drug release profiles of GF strip-films were constructed by plotting the percent of dissolved drug as a function of time. Strip-films with an area of 0.70 cm2 and an average thickness of 100 μm were used for the dissolution test.
The equipment cell and dissolution process are described in Fig. 1 and have been previously described by Bhattachar et al. (30). The cell may be represented as the lower cone, a cylindrical portion, and the filter head (30). Dissolution medium enters at the bottom of the cone and exits through the filter head. The filter head on top holds the 0.2-μm filter. The cone is separated from the cylindrical portion by a #40 mesh screen. The lower cone holds a glass bead 6 mm in diameter, which serves as a check valve, preventing material to descend into the inlet tubing. Strip-films were loaded into the cell using six different patterns following the work presented by Bhattachar et al. for powders (30). For powders, when the glass beads are used, their approach involved mixing of the powder with the beads. However, since strip-films are not amenable to that level of mixing, their placement with respect to the beads or a screen becomes critical. The configurations chosen in our work were chosen so that the effect of sample loading on the dissolution profiles of strip-films containing drug particles may be investigated (see Fig. 2). As per previous studies, when the cell is operated without glass beads the flow is described as turbulent while a cell with glass beads produces a flow that is laminar (39). Irrespective of the exact flow conditions, in our work, these patterns were chosen expecting that they will result in the differences in the hydrodynamics, resulting in differences in dissolution. Additionally, different film placements are intended to create different modes of contact between the film and the flowing liquid. The following patterns were used:
-
Pattern A
Strip-film positioned in the cone section of the cell without the 1-mm round glass beads; thus, the flow is expected to be more nonhomogeneous, but film is not secured.
-
Pattern B
Strip-film positioned on top of 1 mm round glass beads (6.5 g), making the flow more homogeneous by increasing the pressure drop, although the film is not secured.
-
Pattern C
Strip-film positioned at the cone section; sandwiched between 3.5 g of 1 mm round glass beads at the bottom and 3.0 g of 1 mm round beads on top, leading to a more homogeneous flow and securing the film.
-
Pattern D
Strip-film layered between 6.5 g of 1 mm round glass beads and 2 g of 1 mm beads; similar to C but with additional beads to further promote a more homogeneous flow.
-
Pattern E
One millimeter round glass beads not added to the cone section by using a mesh between the cone and cylinder sections. Strip-film positioned between the mesh and 6.5 g of 1 mm round glass beads. This and the next configuration impart different extent of pressure drop and flow homogenization and allow to secure the position of the strip-film in different ways.
-
Pattern F
One millimeter round glass beads not added to the cone section by using a mesh between the cone and cylinder sections. Strip-film layered between 3.5 g of 1 mm round glass beads at the bottom and 3 g of 1 mm round glass beads on top.
Fig. 1.
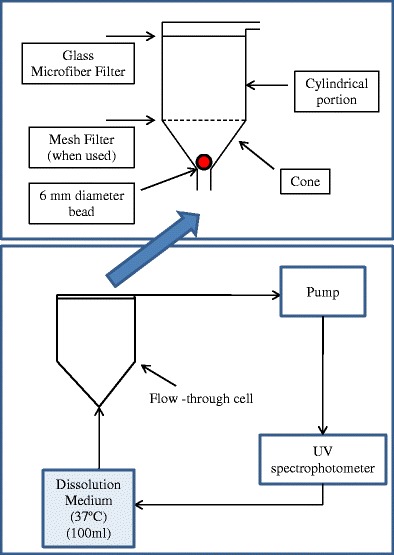
Schematic diagram of the flow-through dissolution apparatus (adapted from Ref. (30))
Fig. 2.
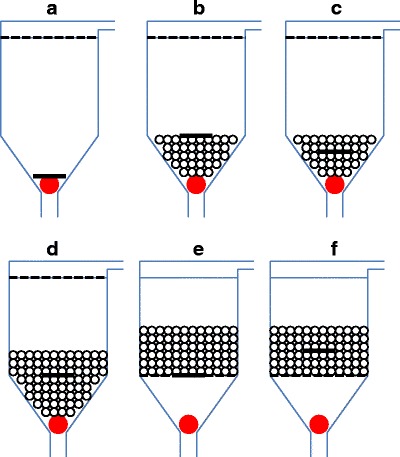
Schematic diagrams showing the different patterns used for the dissolution of films using the flow-through dissolution method (adapted from Ref. (30))
RESULTS AND DISCUSSION
Particle Size Analysis
Results for particle size analysis are presented in Fig. 3. The suspension produced from WSMM showed a narrow particle size distribution with all particles in the nanometer size range. On the other hand, a wide range of particle sizes was observed for the suspension prepared from as-received GF (Fig. 3). Table II shows the diameters for the respective population (10%, 50%, and 90% of particles). The suspension produced from WSMM exhibited a median particle size of 0.144 μm while the suspensions made using as-received GF exhibited a median particle size of 5.031 μm. Extensive characterization of the dried GF nanosuspensions and GF-loaded films via DSC, PXRD, and Raman spectroscopy suggested that the crystalline nature of GF was largely preserved after wet milling (42) and incorporation into films including subsequent drying (36).
Fig. 3.
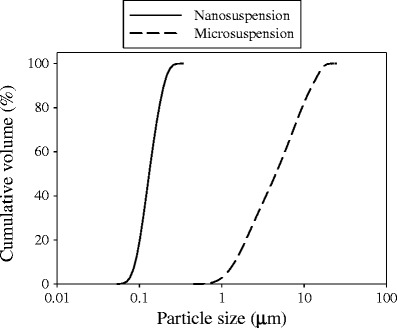
Particle size distribution of GF nanoparticles and microparticles
Characterization of Particles in Strip-Films
Figure 4 shows SEM images for the cross-section of strip-films. Particles with different shapes or morphologies were observed for the microparticle formulation while more spherical particles were observed for the nanometer formulation produced using WSMM. For both formulations, the particles appear to be dispersed, exhibiting sizes that correspond to those in the original suspensions, shown in Table II. While some of the particles in as-received GF films appear to be agglomerated, in general they are between 1 and 10 μm. On the other hand, for films containing GF produced using WSMM, well-dispersed particles in the nanometer size range were observed.
Fig. 4.
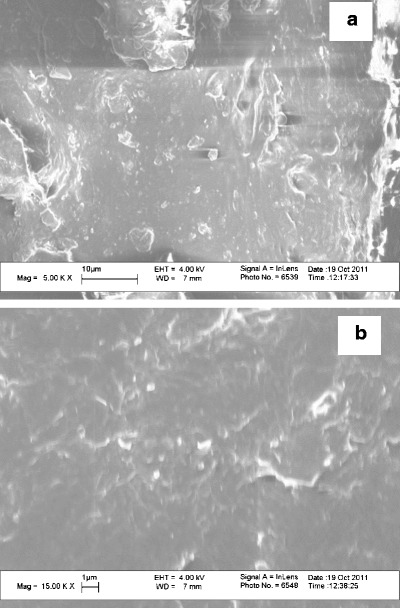
SEM images of film cross-section for a films containing GF microparticles and b films containing GF nanoparticles
Dissolution Testing Using the Basket Method
The dissolution profiles for the basket apparatus using different agitation speeds are shown in Fig. 5 for both formulations. The dissolution extent was observed to be close to 100% in all cases. Increasing the agitation speed from 50 to 150 rpm produces a slight increase in dissolution rate of strip-films containing GF microparticles (Fig. 5a). On the other hand, the increase in dissolution rate of strip-films containing GF nanoparticles by increasing the agitation speed is more pronounced. The increase in dissolution rate with increasing agitation speed for strip-films containing nanoparticles compared to strip-films containing microparticles is attributed to the higher surface area of the drug nanoparticles, which enabled a better contact per surface area with the dissolution medium. It has been shown before that since the flow agitation from the rotating basket is very limited, convection plays an important role as a dominant transport process (43). Therefore, increasing the agitation speed will enhance convective transport and assist in the deaggregation of particles, resulting in an increase in dissolution rates. Similar behavior was observed for the different dissolution media volumes (500 and 900 ml) used.
Fig. 5.
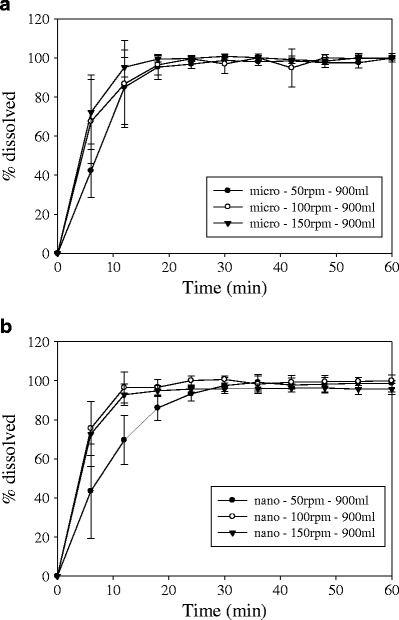
Comparison of dissolution profiles for a films containing GF microparticles and b film containing GF nanoparticles using the USP I dissolution apparatus with different rotational speeds (dissolution media volume of 900 ml)
The dissolution of strip-films containing drug nanoparticles is expected to be faster compared to the dissolution of strip-films containing microparticles as per the Noyes–Whitey equation. To corroborate this behavior, both formulations were compared at the different dissolution conditions as shown in Fig. 6. Interestingly, at 50 rpm, the dissolution of strip-films containing microparticles was slightly faster than the strip-films containing nanoparticles (Fig. 6a). This behavior could be attributed to the low shear in the basket, in which nanoparticles may be in aggregated form in a viscous microenvironment that slows down the dissolution. Similar behavior has been seen before with powders, in which the basket method did not generate adequate liquid flow past the surface of the powder particles, hence resulting in the eventual formation of aggregates inside the basket and the aggregates subsequently adhering to the basket walls (25). In our experiments, it was visually corroborated that the films were adhering to the basket wall. Further studies are also needed to understand and correlate the disintegration effects in strip-films with different drug particle sizes. As seen in Fig. 6b, the difference in dissolution between nanoparticles and microparticles is reduced at high agitation speeds (150 rpm). Based on these results, it appears that the basket method is not suitable for the discrimination of particle size in strip-film formulations.
Fig. 6.
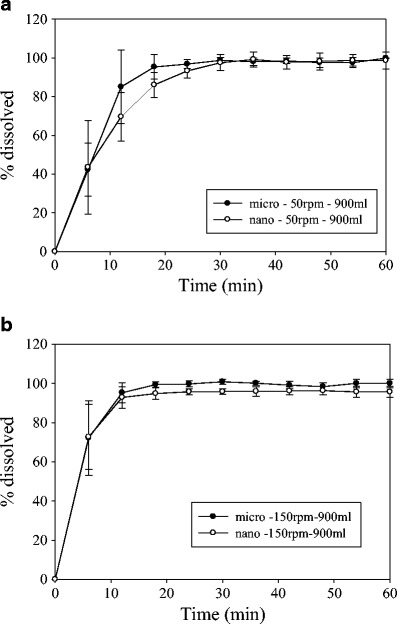
Comparison of dissolution profiles for films containing GF nanoparticles and film containing GF microparticles using the USP I dissolution apparatus with different rotational speeds (dissolution media volume of 900 ml). Shown are a 50 and b 150 rpm
Dissolution Testing Using the Flow-Through Cell Dissolution Method
Results for the dissolution of films containing nanoparticles using the different patterns can be seen in Fig. 7 (error bars omitted for the sake of clarity) using a flow rate of 8 ml/min. The dissolution cell is designed in such a way that when the glass beads are used, a laminar and more homogeneous flow is achieved due to the pressure drop imparted by the beads (Fig. 2). When the beads are not used, the flow becomes more nonhomogeneous (39). On the other hand, the screen helps in holding the beads in place for some of the patterns used and prevents large chunks of dosage samples to stick to the filter located at the head. These variables are critical to the variability in the dissolution. The dissolution behavior was highly influenced by the position and pattern of the film in the cell as expected from the different hydrodynamics (39,40,43,44). The faster dissolution rate was observed for pattern A at the beginning of the dissolution, which exhibits a more nonhomogeneous flow (39,43,44), and then it decreases mainly due to sticking of the films to the cell wall. Pattern A also exhibited the lowest extent of dissolution (83%) for the latter reason. This pattern also had the highest variability associated to the nonhomogeneous flow of the dissolution medium. The highest dissolution extent was obtained using pattern B, which exhibited a more homogeneous flow (39). Pattern E gives the slowest dissolution rate mainly due to the tortuosity associated with the large amount of beads at the top of the strip-film. Patterns C, D, and F exhibit similar dissolution profiles and variability, probably due to similar flow properties across the cell.
Fig. 7.
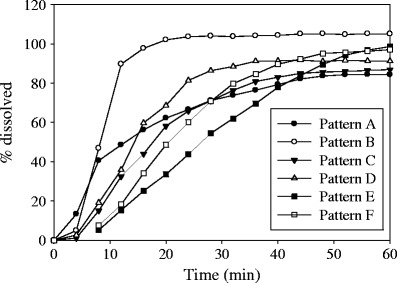
Dissolution profiles for films containing GF nanoparticles using different cell patterns in USP IV apparatus with a dissolution medium flow rate of 8 ml/min (error bars omitted for the sake of clarity)
The Noyes–Whitney relationship predicts a direct proportionality between the dissolution rate and the specific surface area. Hence, for the GF nanoparticles incorporated into strip-films, as mentioned before a faster dissolution rate profile should be observed. Two different patterns (patterns A and C) were chosen to compare the formulation with different particles sizes using a flow rate of 4 and 16 ml/min. These two patterns provide sufficiently different flow patterns so that one can investigate the impact of flow pattern on the dissolution variability. Pattern C was also chosen since it provides a more controlled dissolution compared to the other patterns, where the film is easily secured and it is simple to assemble. Figure 8 shows the comparison of dissolution profiles for the two formulations at different flow rates using pattern A. In general, very high variability was observed for the different samples mainly due to strip-films sticking to the wall of the cell and the nonuniform velocity profile as there is little pressure drop. Based on the mean value for the percent dissolved, the dissolution of strip-film containing nanoparticles was slightly faster compared to the dissolution of strip-films containing microparticles at flow rate of 4 ml/min. This behavior is also true at the higher flow rate of 16 ml/min. Although the trends of the mean value of the percent dissolved are better than the results using the basket method, the observed high variability makes pattern A unreliable.
Fig. 8.
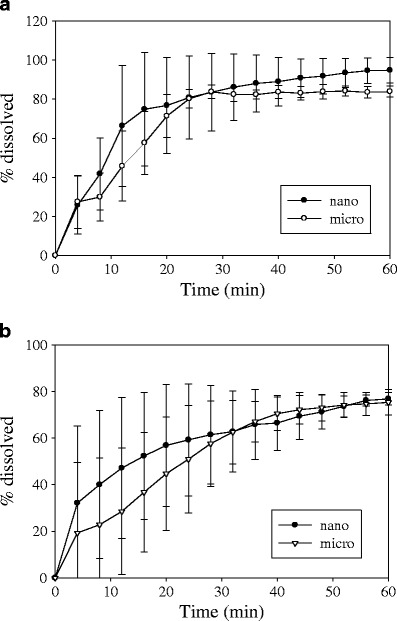
Comparison of dissolution profiles for films containing GF nanoparticles and film containing microparticles using pattern A with different dissolution medium flow rates in USP IV apparatus. Shown are a 4 and b 16 ml/min
Figure 9 shows the comparison of dissolution profiles for strip-film containing GF nanoparticles and microparticles using different flow rates in pattern C. A more uniform velocity field is expected due to the presence of the beads, which could cause less variability in the dissolution. A lag time was observed for the different samples and flow rates that could be due to the slow disintegration of the film very early in the dissolution process. Using a flow rate of 4 ml/min did not show much difference in the dissolution behavior for the two samples at low dissolution times (Fig. 9a). At 60 min, the strip-film containing nanoparticles exhibit higher dissolution and extent of dissolution (86%) compared with the strip-film containing microparticles (56%). The difference in extent of dissolution was enhanced by using a flow rate of 8 ml/min (Fig. 9b). The strip-film containing nanoparticles exhibited higher dissolution and extent of dissolution (86%) compared with the strip-film containing microparticles (47%). Although no major difference in dissolution was observed at low dissolution times, a discriminatory behavior in terms of the extent of dissolution related to particle size was observed. Using a flow rate of 16 ml/min resulted in the best discriminatory behavior in the range tested in terms of dissolution rate while maintaining similar extent of dissolution (Fig. 9c). In this case, the strip-film containing nanoparticles exhibited faster dissolution and higher extent of dissolution (84%) compared with the strip-film containing microparticles (56%). The low dissolution extent in films containing microparticles is related to the hydrodynamics presented in the USP 4. As shown in Figs. 1, 2, 3, 4, 5, 6, and 7, the extent of dissolution was almost 100% for both micro- and nanoformulations. Films with identical formulation and processing conditions were used in the dissolution tests whose results are presented in Figs. 1, 2, 3, 4, 5, 6, 7, and 9. Also based on the error bars representing the standard deviation, the variation at equilibrium dissolution is very similar for both nano- and microparticle formulations.
Fig. 9.
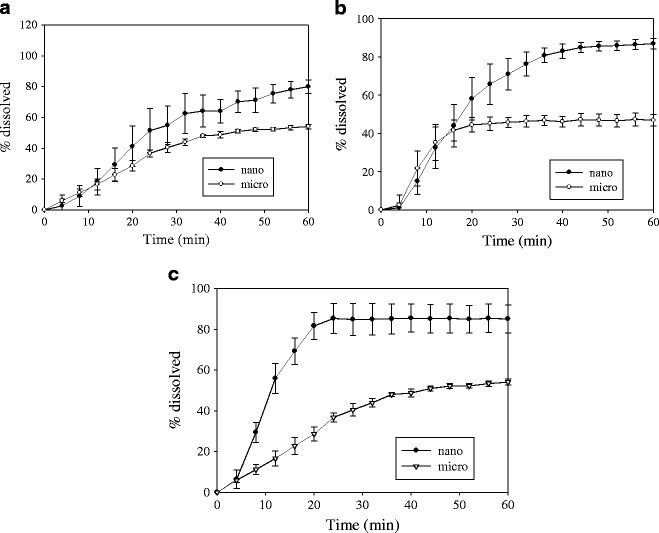
Comparison of dissolution profiles for films containing GF nanoparticles and film containing GF microparticles using pattern C with different dissolution medium (100 ml) flow rates in USP IV apparatus. Shown are a 4, b 8, and c 16 ml/min
The dissolution process depends on two consecutive steps: liberation of the drug from the formulation matrix (disintegration), followed by dissolution of the drug in the liquid medium. The overall rate of dissolution depends on the slower of these two steps. It has also been stated that the dissolution of GF in SDS solution under laminar flow conditions is a combination of diffusive and convective transport in both free and micellar phases (38). Assuming the dissolution of the drug in the surfactant solution (free and micellar) is the rate-limiting step in the dissolution (not true at the beginning of the dissolution process as it is controlled by film disintegration), the diffusive and convective transport controls the dissolution process. Increasing the flow rate increases the dissolution for both formulations. On the other hand, synergistic effects are observed for the films containing nanoparticles as an increase in flow rate also helps in the disaggregation of the nanoparticles, consequently producing an enhancement in dissolution. It has been shown that the sample location has an impact on dissolution (45,46). During the basket rotation, the strip-film is randomly moving inside the basket or could also be sticking to the basket wall, resulting in an uncontrolled strain rate on the film and therefore on the drug particles. This produces negative effects on mass transfer (which controls dissolution). On the other hand, the strip-film location is preserved during the dissolution process when using the flow-through cell and the medium flow is always perpendicular to the strip-film. The strain rate is more controlled, which could help in the disaggregation of particles as better contact is achieved. The fact that better control of the strip-film position can be obtained with the USP 4 could have other effects on disintegration of strip-films. More in-depth studies will be needed to better understand these effects. Based on the results presented above, the flow through cell dissolution method has proved to be more sensitive for changes in dissolution parameters than the basket method and also provides better discrimination of particle size of poorly water-soluble drugs when such drug particles are incorporated into strip-films.
CONCLUSIONS
In this study, which is the first to systematically study the dissolution of strip-films containing drug particles using the basket method and the flow-through cell dissolution method, the dissolution behavior of strip-films containing GF microparticles has been compared to the dissolution behavior of films containing GF nanoparticles. The data presented shows that the flow-through cell dissolution method has better capabilities for the discrimination of particle size, which would be beneficial in the optimization of poorly soluble drugs incorporated into strip-film dosage form. Although GF is used as a model drug in the results presented here, it is expected that the flow-through cell dissolution would provide similar results for other BCS Class II drugs.
ACKNOWLEDGMENT
The authors thank NSF for financial support of this project through the ERC (EEC-0540855) award.
REFERENCES
- 1.Krishnaiah YSR. Pharmaceutical technologies for enhancing oral bioavailability of poorly soluble drugs. J Bioequiv Availab. 2010;2:28–36. doi: 10.4172/jbb.1000027. [DOI] [Google Scholar]
- 2.Kesisoglou F, Panmai S, Wu Y. Nanosizing—oral formulation development and biopharmaceutical evaluation. Adv Drug Deliv Rev. 2007;59(7):631–644. doi: 10.1016/j.addr.2007.05.003. [DOI] [PubMed] [Google Scholar]
- 3.Merisko-Liversidge E, Liversidge GG. Nanosizing for oral and parenteral drug delivery: a perspective on formulating poorly-water soluble compounds using wet media milling technology. Adv Drug Deliv Rev. 2011;63(6):427–440. doi: 10.1016/j.addr.2010.12.007. [DOI] [PubMed] [Google Scholar]
- 4.Liversidge GG, Cundy KC. Particle size reduction for improvement of oral bioavailability of hydrophobic drugs: I. Absolute oral bioavailability of nanocrystalline danazol in beagle dogs. Int J Pharm. 1995;125(1):91–97. doi: 10.1016/0378-5173(95)00122-Y. [DOI] [Google Scholar]
- 5.Muller RH, Jacobs C, Kayser O. Nanosuspensions as particulate drug formulations in therapy. Rationale for development and what we can expect for the future. Adv Drug Deliv Rev. 2001;47(1):3–19. doi: 10.1016/S0169-409X(00)00118-6. [DOI] [PubMed] [Google Scholar]
- 6.Keck CM, Muller RH. Drug nanocrystals of poorly soluble drugs produced by high pressure homogenisation. Eur J Pharm Biopharm. 2006;62(1):3–16. doi: 10.1016/j.ejpb.2005.05.009. [DOI] [PubMed] [Google Scholar]
- 7.Xiaohui P, Jin S, Mo L, Zhonggui H. Formulation of nanosuspensions as a new approach for the delivery of poorly soluble drugs. Curr Nanosci. 2009;5(4):417–427. [Google Scholar]
- 8.Amidon GL, Lennernas H, Shah VP, Crison JR. A theoretical basis for a biopharmaceutic drug classification: the correlation of in vitro drug product dissolution and in vivo bioavailability. Pharm Res. 1995;12:413–420. doi: 10.1023/A:1016212804288. [DOI] [PubMed] [Google Scholar]
- 9.de Villiers MM. Influence of agglomeration of cohesive particles on the dissolution behaviour of furosemide powder. Int J Pharm. 1996;136:175–179. doi: 10.1016/0378-5173(95)04380-2. [DOI] [Google Scholar]
- 10.de Villiers MM. Description of the kinetics of the deagglomeration of drug particle agglomerates during powder mixing. Int J Pharm. 1997;151:1–6. doi: 10.1016/S0378-5173(97)04893-X. [DOI] [Google Scholar]
- 11.Otto DP, de Villiers MM. Physicochemical principles of nanosized drug delivery systems. In: de Villiers MM, Aramwit P, Kwon GS, editors. Nanotechnology in drug delivery. New York: Springer; 2009. pp. 4–5. [Google Scholar]
- 12.Heng D, Ogawa K, Cutler DJ, Chan H-K, Raper JA, Ye L, et al. Pure drug nanoparticles in tablets: what are the dissolution limitations? J Nanoparticle Res. 2010;12(5):1743–1754. doi: 10.1007/s11051-009-9759-y. [DOI] [Google Scholar]
- 13.Finholt. Influence of formulation on dissolution rate. In: Leeson LJ, Carstensen JT editors. Dissolution Technology, The Industrial Pharmaceutical Technology Section of the Academy of Pharmaceutical science, Washington, 1974, pp. 106–46.
- 14.Hu J, Johnston KP, Williams RO., III Nanoparticle engineering processes for enhancing the dissolution rates of poorly water soluble drugs. Drug Dev Ind Pharm. 2004;30(3):233–245. doi: 10.1081/DDC-120030422. [DOI] [PubMed] [Google Scholar]
- 15.Bhakay A, Merwade M, Bilgili E, Dave RN. Novel aspects of wet milling for the production of microsuspensions and nanosuspensions of poorly water-soluble drugs. Drug Dev Ind Pharm. 2011;37(8):963–976. doi: 10.3109/03639045.2010.551775. [DOI] [PubMed] [Google Scholar]
- 16.Merisko-Liversidge E, Liversidge GG, Cooper ER. Nanosizing: a formulation approach for poorly-water-soluble compounds. Eur J Pharm Sci. 2003;18(2):113–120. doi: 10.1016/S0928-0987(02)00251-8. [DOI] [PubMed] [Google Scholar]
- 17.Shafiq-un-Nab S, Shakeel F, Talegaonkar S, Ali J, Baboota S, Ahuja A. Formulation development and optimization using nanoemulsion technique: a technical note. AAPS Pharm Sci Tech. 2007;8(2):28–34. doi: 10.1208/pt0802028. [DOI] [PMC free article] [PubMed] [Google Scholar]
- 18.Rogers TL, Gillespie IB, Hitt JE, Fransen KL, Crowl CA, Tucker CJ, et al. Development and characterization of a scalable controlled precipitation process to enhance the dissolution of poorly water-soluble drugs. Pharm Res. 2004;21:3990–4005. doi: 10.1023/B:PHAM.0000048196.61887.e5. [DOI] [PubMed] [Google Scholar]
- 19.Browne DC, Kieselmann S. Low-level drug release-rate testing of ocular implants using USP apparatus 4 dissolution and HPLC end analysis. Diss Tech. 2010;17(1):12–14. [Google Scholar]
- 20.Bhardwaj U, Burgess DJ. A novel USP apparatus 4 based release testing method for dispersed systems. Int J Pharm. 2010;388:287–294. doi: 10.1016/j.ijpharm.2010.01.009. [DOI] [PubMed] [Google Scholar]
- 21.Neubert A, Sternberg K, Nagel S, Harder C, Schmitz KP, Kroemer HK. Development of a vessel-simulating flow-through cell method for the in vitro evaluation of release and distribution from drug-eluting stents. J Control Release. 2008;130:2–8. doi: 10.1016/j.jconrel.2008.05.012. [DOI] [PubMed] [Google Scholar]
- 22.Zhang GH, Vadino WA, Yang TT, Cho WP, Chaudry IA. Evaluation of the flow-through cell dissolution apparatus: effects of flow rate, glass beads and tablet position on drug release from different type of tablets. Drug Dev Ind Pharm. 1994;20(13):2063–2078. doi: 10.3109/03639049409050222. [DOI] [Google Scholar]
- 23.Gjellan K, Graffner C. Comparative dissolution studies of rectal formulations using the basket, the paddle and the flow-through methods: II. Ibuprofen in suppositories of both hydrophilic and lipophilic types. Int J Pharm. 1994;112(3):233–240. doi: 10.1016/0378-5173(94)90359-X. [DOI] [PubMed] [Google Scholar]
- 24.Perng CY, Kearney AS, Palepu NR, Smith BR, Azzarano LM. Assessment of oral bioavailability enhancing approaches for SB-247083 using flow-through cell dissolution testing as one of the screens. Int J Pharm. 2003;250(1):147–156. doi: 10.1016/S0378-5173(02)00521-5. [DOI] [PubMed] [Google Scholar]
- 25.Nicklasson M, Orbe A, Lindberg J, Borga B, Magnusson AB, Nilsson G, et al. A collaborative study of the in vitro dissolution of phenacetin crystals comparing the flow through method with the USP Paddle method. Int J Pharm. 1991;69(3):255–264. doi: 10.1016/0378-5173(91)90367-W. [DOI] [Google Scholar]
- 26.Rawat A, Burgess DJ. USP apparatus 4 method for in vitro release testing of protein loaded microspheres. Int J Pharm. 2011;409(1–2):178–184. doi: 10.1016/j.ijpharm.2011.02.057. [DOI] [PubMed] [Google Scholar]
- 27.Nicklasson M, Wennergren B, Lindberg J, Persson C, Ahlgren R, Palm B. A collaborative in vitro dissolution study using the flow-through method. Int J Pharm. 1987;37:195–202. doi: 10.1016/0378-5173(87)90029-9. [DOI] [Google Scholar]
- 28.Gjellan K, Magnusson AB, Ahlgren R, Callmer K, Christensen DF, Espmarker U, et al. A collaborative study of the in vitro dissolution of acetylsalicylic acid gastro-resistant capsules comparing the flow-through cell method with the USP paddle method. Int J Pharm. 1997;151(1):81–90. doi: 10.1016/S0378-5173(97)04891-6. [DOI] [Google Scholar]
- 29.Wennergren L, Lindberg L, Nicklasson M, Nilsson G, Nyberg G, Ahlgren R. A collaborative in vitro dissolution study: comparing the flow-through method with the USP paddle method using USP prednisone calibrator tablets. Int J Pharm. 1989;53:35–41. doi: 10.1016/0378-5173(89)90358-X. [DOI] [Google Scholar]
- 30.Bhattachar S, Wesley J, Fioritto A, Martin P, Babu S. Dissolution testing of a poorly soluble compound using the flow-through cell dissolution apparatus. Int J Pharm. 2002;236:135–143. doi: 10.1016/S0378-5173(02)00027-3. [DOI] [PubMed] [Google Scholar]
- 31.Heng D, Cutler D, Chan H, Yun J, Raper J. What is a suitable dissolution method for drug nanoparticles? Pharm Res. 2008;25(7):1696–1701. doi: 10.1007/s11095-008-9560-0. [DOI] [PubMed] [Google Scholar]
- 32.Dixit RP, Puthli SP. Oral strip technology: overview and future potential. J Control Release. 2009;139:94–107. doi: 10.1016/j.jconrel.2009.06.014. [DOI] [PubMed] [Google Scholar]
- 33.Shimoda H, Taniguchi K, Nishimura M, Matsuura K, Tsukioka T, Yamashita H. Preparation of a fast dissolving oral thin film containing dexamethasone: a possible application to antiemesisduring cancer chemotherapy. Eur J Pharm Biopharm. 2009;73:361–365. doi: 10.1016/j.ejpb.2009.08.010. [DOI] [PubMed] [Google Scholar]
- 34.Garsuch V, Breitkreutz J. Comparative investigations on different polymers for the preparation of fast-dissolving oral films. J Pharm Pharmacol. 2010;62(4):539–545. doi: 10.1211/jpp.62.04.0018. [DOI] [PubMed] [Google Scholar]
- 35.Bess W, Kulkarni N, Ambike S, Ramsay M, inventors. McNeil-PPC, Inc., assignee. Fast dissolving orally consumable films containing a taste masking agent. Us Patent 7,648,712. 19 Jan 2010.
- 36.Sievens-Figueroa L, Bhakay A, Jerez-Rozo J, Pandya N, Romañach R, Michniak-Kohn B, et al. Preparation and characterization of hydroxypropyl methyl cellulose films containing stable BCS class II drug nanoparticles for pharmaceutical applications. Int J Pharm. 2012;423(2):496–508. doi: 10.1016/j.ijpharm.2011.12.001. [DOI] [PubMed] [Google Scholar]
- 37.The United States Pharmacopeia. US Pharmacopeia (USP 35-NF 30).
- 38.Rao VM, Lin M, Larive CK, Southard MZ. A mechanistic study of griseofulvin dissolution into surfactant solutions under laminar flow conditions. J Pharm Sci. 1997;86(10):1132–1137. doi: 10.1021/js9604974. [DOI] [PubMed] [Google Scholar]
- 39.Kakhi M. Classification of the flow regimes in the flow-through cell. Eur J Pharm Sci. 2009;37(5):531–544. doi: 10.1016/j.ejps.2009.04.003. [DOI] [PubMed] [Google Scholar]
- 40.Liu Y, Sun C, Hao Y, Jiang T, Zheng L, Wang S. J Pharm Pharmaceut Sci. 2010;13(4):589–606. doi: 10.18433/j3530j. [DOI] [PubMed] [Google Scholar]
- 41.Kakran M, Sahoo NG, Li L, Judeh Z, Wang Y, Chong K, et al. Int J Pharm. 2010;383:285–292. doi: 10.1016/j.ijpharm.2009.09.030. [DOI] [PubMed] [Google Scholar]
- 42.Monteiro A, Afolabi A, Bilgili E. Continuous Production of drug nanoparticle suspensions via wet stirred media milling: a fresh look at the rehbinder effect. Drug Dev. Ind. Pharm. 2012. doi: 10.3109/03639045.2012.676048) [DOI] [PubMed]
- 43.D’Arcy DM, Corrigan OI, Healy AM. Evaluation of hydrodynamics in the basket dissolution apparatus using computational fluid dynamics-dissolution rate implications. Eur J Pharm Sci. 2006;27:259–267. doi: 10.1016/j.ejps.2005.10.007. [DOI] [PubMed] [Google Scholar]
- 44.D’Arcy D, Liu B, Bradley G, Healy A, Corrigan O. Hydrodynamic and species transfer simulations in the USP 4 dissolution apparatus: Considerations for dissolution in a low velocity pulsing flow. Pharm Res. 2010;27(2):246–258. doi: 10.1007/s11095-009-0010-4. [DOI] [PubMed] [Google Scholar]
- 45.Wang Y, Armenante PM. A novel off-center paddle impeller (OPI) dissolution testing system for reproducible dissolution testing of solid dosage forms. J Pharm Sci. 2012;101(2):746–760. doi: 10.1002/jps.22783. [DOI] [PubMed] [Google Scholar]
- 46.Bai G, Armenante PM. Hydrodynamic, mass transfer, and dissolution effects induced by tablet location during dissolution testing. J Pharm Sci. 2009;98(4):1511–1531. doi: 10.1002/jps.21512. [DOI] [PubMed] [Google Scholar]


