

Abstract
The present studies entail formulation development of novel solid self-nanoemulsifying drug delivery systems (S-SNEDDS) of valsartan with improved oral bioavailability, and evaluation of their in vitro and in vivo performance. Preliminary solubility studies were carried out and pseudoternary phase diagrams were constructed using blends of oil (Capmul MCM), surfactant (Labrasol), and cosurfactant (Tween 20). The SNEDDS were systematically optimized by response surface methodology employing 33-Box–Behnken design. The prepared SNEDDS were characterized for viscocity, refractive index, globule size, zeta potential, and TEM. Optimized liquid SNEDDS were formulated into free flowing granules by adsorption on the porous carriers like Aerosil 200, Sylysia (350, 550, and 730) and Neusilin US2, and compressed into tablets. In vitro dissolution studies of S-SNEDDS revealed 3–3.5-fold increased in dissolution rate of the drug due to enhanced solubility. In vivo pharmacodynamic studies in Wistar rats showed significant reduction in mean systolic BP by S-SNEDDS vis-à-vis oral suspension (p < 0.05) owing to the drug absorption through lymphatic pathways. Solid-state characterization of S-SNEDDS using FT-IR and powder XRD studies confirmed lack of any significant interaction of drug with lipidic excipients and porous carriers. Further, the accelerated stability studies for 6 months revealed that S-SNEDDS are found to be stable without any change in physiochemical properties. Thus, the present studies demonstrated the bioavailability enhancement potential of porous carriers based S-SNEDDS for a BCS class II drug, valsartan.
KEY WORDS: BCS, bioavailability, in vitro dissolution, porous carriers, XRD
INTRODUCTION
Valsartan is a competitive antagonist of angiotensin II which shows higher affinity for angiotensin type I receptor. By blocking the action of angiotensin II, it dilates blood vessels and reduces mean systolic blood pressure (BP). It is used for the management of high BP, congestive heart failure, and post-myocardial infarction (1). It is a BCS class II drug, exhibits low aqueous solubility < 0.1 mg/mL with high log P value of 5.8 and low oral bioavailability (<25%) (2). Further, it undergoes extensive hepatic first-pass metabolism, high P-gp efflux and shows variable oral bioavailability in the presence of food, which decreases the AUC by 40% and peak plasma concentration by 50% (3,4).
Several formulation approaches have already been employed such as inclusion complexes with cyclodextrin, solid dispersions, surfactants (5), lipidic excipients (6), and nanoparticles (7) to enhance the oral bioavailability of valsartan but yielded limited fruition due to their solubility enhancement characteristic alone (8). Lately, self-emulsifying drug delivery systems (SEDDS) are found to be highly promising technique to enhance the oral bioavailability of poorly water-soluble drugs by circumnavigation of the hepatic first-pass effect, metabolism by gut cytochrome-P450 family of isozymes, inhibition of P-gp efflux, protection of drug degradation in the gastric acidic environment and drug absorption through lymphatic pathways (9,10).
SEDDS are preconcentrate containing isotropic mixture of oils, surfactants, cosurfactant and/or cosolvents, which undergo emulsification by gentle agitation in presence of aqueous phase/gastric fluid to form fine o/w emulsion. SEDDS with globule size ranging between 20 and 200 nm are called as self-nanoemulsifying drug delivery system (SNEDDS), whereas globule size ranging between 100 and 200 nm are known as self-microemulsifying drug delivery system (SMEDDS) (11–13).
Recent technological advancements in the SEDDS formulation have evolved myriad self-emulsifying (SE) systems like liquids, solids, spray-dried, porous carrier-based, eutectic, osmotic, cationic, supersaturable systems, etc. (14,15). Such systems invariably contains holistic interplay of lipidic and solidifying excipients to formulate different dosage forms like SE controlled release tablets, pellets, granules, microspheres, minicapsules, etc. Among these, the solid SNEDDS (S-SNEDDS) formulations have explored widely due to their potential advantages to surmount the ostensible problems associated with liquid SNEDDS like lower formulation stability, plausible interaction of lipidic excipients with capsule shell, irritating effect on GI mucosa and low drug loading (16,17).
SNEDDS contains diverse class of formulation excipients which may invariably affect the performance of a dosage form. Hence, application of experimental design methodology such as factorial design, Box–Behnken design (BBD), central-composite design, D-optimal design, and mixture design for systematic optimization helps in optimizing drug delivery systems to obtain robust formulations (18,19). BBD is most widely acceptable approach for systematic optimization of SNEDDS to obtain robust formulations. It is the simplest and cost-effective approach over others due to ease of design execution and interpretation. Other advantages include its less complex structure, fewer experimental runs required, and time economy. Literature reports the application of BBD in systematic optimization of SNEDDS formulations by many researchers such as Nazzal and Khan (2002) for optimization of ubiquinone SNEDDS (20), Shaji and Lodha, (2008) to optimize the celecoxib SMEDDS (21), and Rajput et al. (2011) for development and optimization of isradipine SNEDDS (22).
Thus, the present work embarks upon development of optimized SNEDDS of valsartan using rational blend of lipidic excipients, surfactants, and cosurfactants to enhance the oral bioavailability. The suitability of SMEDDS for bioavailability enhancement of valsartan has already been discussed in the prior art (23). However, in order to understand the relationship between the phase behaviors of the mixture to delineate the nanoemulsion region, more exhaustive study was carried out. The concentration of oil and surfactant/cosurfactant mixture were varied from 10 to 90% v/v at all the Smix ratios (1:1, 1:2, 1:3, 2:1, 2:3, 3:4) to obtain the maximal region and to select best possible formulations with enhanced solubility and bioavailability. Further, drug-loaded SNEDDS were converted into free flowing solid granules (S-SNEDSS) using porous carriers like Aerosil 200, Sylysia (350, 550, and 750) and Neusilin US2 by adsorption technique. The prepared S-SNEDDS formulations were characterized for in vitro physiochemical performance, in vivo pharmacodynamic potential, solid-state compatibility, and stability studies in order to get a best possible formulation.
MATERIALS AND METHODS
Materials
Valsartan was obtained as a generous gift sample from M/s Aurobindo Pharma (Hyderabad, India). Labrasol, Labrafac PG, and Labrafil M were gifted by M/s Gattefosse (Saint Priest Cedex, France), Cremophor RH40, Captex 200P, Captex 355, and Capmul MCM were gifted by M/s Abitec (Janesville, USA). Different grades of Sylysia (350, 550, and 730) were obtained as gift samples from M/s Fuji chemicals (Toyama, Japan), and Neusilin US2 from M/s Gangwal Chemicals (Mumbai, India). Various tableting excipients like Avicel 112, Aerosil 200, cross povidone, and magnesium stearate were purchased from M/s FMC Biopolymer (Mumbai, India). Deionized double distilled water was used throughout the study obtained from Milli-Q-water purification system Millipore (Massachusetts, USA), while all other chemicals and reagents used were of analytical reagent grade.
Methods
Solubility Studies
Screening of excipients was carried out for determining the equilibrium solubility of valsartan in different oils, surfactants, and cosurfactants. An excess quantity of valsartan was added to 2.0 mL of each excipient taken in 5-mL vials and mixed for 5 min using CM101, Cyclomixer (Remi, Mumbai, India) (24). The mixtures in vials were shaken for 48 h using RS12R Rotary shaker (Remi, Mumbai, India). After solubilization, extra amount of drug was added to the vials containing drug–excipient mixture. The process was repeated until saturation solubility of valsartan, indicated by presence of undissolved drug. The mixtures were kept at room temperature for 24 h and centrifuged using 12C micro-centrifuge (Remi, Mumbai, India) at 3,000 rpm for 15 min. The separated supernatant fraction was suitably diluted with methanol. The drug concentration was analyzed spectrophotometrically at λmax 248 nm using UV–visible spectrophotometer (Shimadzu-1800, Japan).
Construction of Pseudoternary Phase Diagrams
Self-nanoemulsifying systems form fine o/w emulsions when introduced into aqueous media with gentle agitation. Surfactant and cosurfactant get preferentially adsorbed at the interface, reduce the tension, and provide mechanical barrier to prevent the globules from coalescence. The decrease in free energy required for emulsion formation consequently improves the thermodynamic stability. The selected oil, surfactant, cosurfactant on the basis of solubility studies were used to develop the pseudoternary phase diagrams using water titration method. The various surfactant–cosurfactant (Smix) ratios were prepared using different proportions of surfactant and cosurfactant (1:1, 1:2, 1:3, 2:3, 3:4) to fulfill HLB value requirement (between 12 and 16) for formation of transparent clear solution. A series of oil/Smix mixtures were prepared at all nine combinations (1:9, 2:8, 3:7, 4:6, 5:5, 6:4, 7:3, 8:2 and 9:1) and titrated with water to identify the nanoemulsion region. The total water consumed was noted in terms of w/w and during titration oil–Smix ratio and observations were made for phase clarity. The concentration of water at which turbidity‐to‐transparency and transparency‐to‐turbidity transitions occur were derived from the weight measurements. These values were used to determine the boundaries of the nanoemulsion region corresponding to the selected value of oil and Smix ratio. Phase diagrams were constructed using PRO SIM Ternary phase diagram software (STRATEGE, Cedex, France).
Formulation and Optimization of SNEDDS as Per Experimental Design
The liquid SNEDDS were formulated as per the experimental design employing a three-factor, three-level (33) Box–Behnken design (BBD) using Design-Expert 8.0.5 software (Stat-Ease Inc., Mineapolis, USA) by selecting the volume (microliter) of Capmul MCM (X1), Labrasol (X2), and Tween 20 (X3) as independent variables, while self-emulsification time in sec (Y1), percent drug release after 15 min (Y2), and globule size in nanometer (Y3) as responses. Response surface analyses were carried out to identify the effect of different independent variables on the observed responses. Table I illustrates the factor levels selected from the phase diagram for the BBD. A fixed dose of the drug (40 mg) was admixed with the oil, surfactant, and cosurfactant at ambient temperature with continuous stirring in a vortex mixer (Remi, Mumbai, India) to achieve complete solubilization in the formulation components to obtain a homogeneous mixture. Table II illustrates the experimental runs obtained from BoxBehnken design and their observed responses. The responses were statistically evaluated using ANOVA procedure. Further, the optimum formulation was selected by the numerical optimization procedure using the desirability function.
Table I.
Ranges of the Factors Investigated Using Box–Behnken Experimental Design
| Independent variables (factors) | Range | |
|---|---|---|
| Low | High | |
| X 1 = Amount of Capmul MCM (μL) | 100.00 | 135.00 |
| X 2 = Amount of Labrasol (μL) | 162.50 | 180.00 |
| X 3 = Amount of Tween 20 (μL) | 162.50 | 180.00 |
Table II.
Experimental Runs Obtained from Box–Behnken Design and Observed Responses
| RUN | X 1 | X 2 | X 3 | Y 1 | Y 2 | Y 3 |
|---|---|---|---|---|---|---|
| Capmul (μl) | Labrasol (μl) | Tween 20 (μl) | SEF time (secs) | % Drug Release after 15 min | Globule size (nm) | |
| 1 | 100.00 | 162.00 | 171.00 | 35 | 86 | 82 |
| 2 | 135.00 | 162.00 | 171.00 | 20 | 82 | 87 |
| 3 | 100.00 | 180.00 | 171.00 | 42 | 92 | 78 |
| 4 | 135.00 | 180.00 | 171.00 | 55 | 81 | 79 |
| 5 | 100.00 | 171.00 | 162.00 | 45 | 84 | 76 |
| 6 | 135.00 | 171.00 | 162.00 | 18 | 88 | 89 |
| 7 | 100.00 | 171.00 | 180.00 | 15 | 82 | 93 |
| 8 | 135.00 | 171.00 | 180.00 | 30 | 71 | 84 |
| 9 | 117.50 | 162.00 | 162.00 | 28 | 91 | 85 |
| 10 | 117.50 | 180.00 | 162.00 | 25 | 84 | 87 |
| 11 | 117.50 | 162.00 | 180.00 | 35 | 82 | 85 |
| 12 | 117.50 | 180.00 | 180.00 | 65 | 92 | 78 |
| 13 | 117.50 | 171.00 | 171.00 | 71 | 89 | 77 |
| 14 | 117.50 | 171.00 | 171.00 | 64 | 85 | 68 |
| 15 | 117.50 | 171.00 | 171.00 | 66 | 84 | 91 |
| 16 | 117.50 | 171.00 | 171.00 | 68 | 88 | 56 |
| 17 | 117.50 | 171.00 | 171.00 | 62 | 87 | 86 |
Characterization of SNEDDS
Dispersibility Studies and Self-Emulsification Time
The dispersibility studies were carried out to observe the self-emulsification efficiency and self-emulsification time (SEF time). One milliliter of each of the SNEDDS was added to 500 mL of distilled water in a glass beaker with gentle agitation by placing it on a magnetic stirrer at 50 rpm with temperature at 37°C. The process of self-emulsification was visually monitored for the rate of emulsification and appearance of produced microemulsion.
Globule Size
One milliliter of the formulation was taken in a volumetric flask and diluted with 25 mL water with gentle mixing. The globule size of the resultant emulsions was determined using Malvern Particle size analyzer (Zetasizer, Model Nano75 Malvern, UK).
In Vitro Drug Release Studies
In vitro dissolution profile of liquid SNEDDS formulation were carried out in USP type-II apparatus (Electrolab TDT06L, Mumbai, India) using 1,000 mL of simulated gastric fluid (SGF) pH 1.2 containing 0.2% (w/v) sodium lauryl sulfate at 50 rpm and 37 ± 0.5°C temperature. At predetermined time intervals (5, 15, 25, 35, 45, 60, 90, and 120 min), an aliquot (5 mL) of the sample was collected with replacement, filtered, diluted, and analyzed spectrophotometrically at 205 nm using Shimadzu-1800 UV–visible spectrophotometer (Shimadzu, Japan). Similarly, dissolution study was also conducted on pure drug in an analogous manner. A plot was made between cumulative percentage drug release with respect to time (minute).
Thermodynamic Stability
The liquid SNEDDS were subjected to six refrigerator cycles between temperatures of 4°C to 45°C with storage not less than 48 h in a heating–cooling incubator (Remi). Formulations stable at these temperatures were further subjected to centrifugation test at 3,500 rpm for 30 min using 12C micro-centrifuge (Remi). Formulations which did not show any phase separation upon centrifugation were taken for freeze thaw stress test by three cycles between −21°C and 25°C temperature for 48 h. Based on the thermodynamic stability studies the SNEDDS formulations were selected.
Optical Birefringence
The optical clarity of the optimized liquid SNEDDS formulation was determined in terms of refractive index using Abbes’ refractrometer (Mettler Toledo, Mumbai, India).
Viscosity
The viscosity of the optimized liquid SNEDDS was determined by placing 1 mL of the formulation in a Brookfield viscometer R/S CPS Plus (Brookfield Engineering Laboratories Inc., Middleboro, MA) using spindle C 50–1 at 25 ± 0.5°C temperature. The spindle no. 50 was used at a speed of 70 rpm at shear stress of 413 per min and wait time was kept at 15 min. Finally, shear rate produced as a parameter of viscocity was noted in terms of centipoise.
Transmission Electron Microscopy
The visual observation of the emulsion droplet was observed by transmission electron microscopy (TEM) (PHILIPS TECNAI 12, The Netherlands). The optimized liquid SNEDDS formulation was diluted with distilled water 1:25 and mixed by slight shaking, and a drop of the sample was placed on copper grid, stained with 1% w/v phosphotungstic acid solution for 30 s and visually observed under microscope.
Preparation of S-SNEDDS
The optimized liquid SNEDDS formulation was transformed into free flowing granules using various porous carriers like Aerosil 200, Sylysia 350, 550, 730, and Neusilin US2 as adsorbent due to their oil adsorption property (25). The liquid SNEDDS formulation was poured onto the porous carriers placed in a small stainless-steel bowl, mixed, and wet granulation was performed with hand to obtain the homogeneous mass. It was passed through sieve (BSS 22) to achieve the uniformly free flowing self-nanoemulsifying granules (SNEGs). Finally, the SNEGs were compressed into tablets by direct compression using 12-mm flat circular punch in a rotary multistation tablet compression machine (Cadmach Ltd., Ahmedabad, India), by addition of various tableting excipients like Avicel 112 as filler, Crosspovidone as super-disintegrant, and magnesium stearate as lubricant.
Optimization of S-SNEDDS
The S-SNEDDS prepared using different porous carriers were optimized based upon their oil adsorption capacity, micromeritic properties, and in vitro drug release. Oil adsorption capacity was determined by allowing the self-nanoemulsifying formulations to adsorb onto the porous carriers till it solidifies and estimating the drug content. Various micromeritic properties (bulk density, tapped density, angle of repose, Carr’s index, and Hausner’s ratio) of the prepared granules were determined. In vitro drug release from prepared S-SNEDDS tablets were determined by dissolution studies.
Characterization of S-SNEDDS
The S-SNEDDS tablets prepared from different SNEGs were evaluated for hardness, weight variation, friability (percent), and disintegration time as per the USPXXII procedure. Hardness measurement was carried out by Pfizer tester (Sangmeshwar Int., India). Weight variation test was carried out using 20 tablets and determining their weight with the help of electronic balance (Scientech Ltd., USA). Friability (percent) was calculated by taking 20 tablets with the help of Roche’s friability tester (Key International Inc., NJ). Disintegration test was carried out in USPXXII disintegration test apparatus (Electrolab) using 900 mL of SGF.
Drug Content Estimation
Liquid SNEDDS, SNEGs, and S-SNEDDS containing valsartan, each equivalent to 40 mg was dispersed in suitable quantity of methanol. The samples were mixed thoroughly to dissolve the drug in SGF, centrifuged at 3,000 rpm for 15 min using 12C micro-centrifuge (Remi, Mumbai, India) to separate the undissolved excipients. The supernatant was suitably diluted and analyzed spectrophotometrically at λmax 205 nm using Shimadzu 160A UV–visible spectrophotometer.
Comparative In Vitro Drug Release Studies
The comparative in vitro dissolution profile studies were carried out for pure drug, marketed preparation (Valzaar® 40, Torrent Pharma, Ahmedabad, India), optimized liquid SNEDDS and S-SNEDDS, each containing valsartan equivalent to 40 mg. The dissolution studies were carried out in USP type-II dissolution apparatus (Electrolab TDT06L, Mumbai, India) as per the dissolution conditions specified by FDA guidelines for dissolution testing of immediate release tablets of valsartan in 1,000 mL of SGF pH 1.2 (0.2% (w/v) sodium lauryl sulfate) and pH 6.8 phosphate buffer (official FDA recommended media) at 50 rpm and 37 ± 0.5°C temperature (26). At predetermined time intervals (5, 15, 25, 35, 45, 60, 90, and 120 min), aliquot (5 mL) samples were collected with replacement, filtered, diluted, and analyzed spectrophotometrically at 205 and 248 nm for SGF pH 1.2 and pH 6.8 phosphate buffer, respectively. A plot was made between cumulative percentage drug release with respect to time (minute).
In Vivo Pharmacodynamic Studies
The in vivo study protocol was approved by Institutional Ethics Committee, Roland Institute of Pharmaceutical Sciences, Berhampur under the protocol number RIPS/IAEC/46/2011. The study was conducted as per committee for prevention, control, and supervision of experimental animals (CPCSEA) guidelines. The in vivo antihypertensive activity was carried out in 18 male Wistar rats (200–250 g) of either sex, divided into three groups (groups A, B, and C) with n = 6. The animals were housed in polypropylene cages six per cage, kept under standard laboratory conditions, at 25 ± 2°C temperature and 55 ± 5% RH. The animals have free access to standard laboratory diet (Lipton feed, Mumbai, India) and water ad libitum. Before commencement of the study, to reduce the spontaneous variations in BP, animals were adjusted to the experimental cage by bringing them into the restraining cage three to four times for a period of 30 min. After attaining at normal condition, the initial systolic BP of normotensive animals were recorded using small animal tail noninvasive blood pressure system, NIBP200A (Biopac System Inc., California, USA) based on tail cuff technique. After recording the initial BP of rats, hypertension was induced in all the three groups of animals by subcutaneous injection of methyl prednisolone acetate (MPA) (20 mg/kg/week) for 2 weeks (27). After induction of hypertension, the animals in group A were treated as control where no treatment was given; however, the animals in groups B and C considered as treatment groups were given oral suspension of pure drug and optimized S-SNEDDS formulation, each equivalent to 40 mg of valsartan. The mean systolic BP of animals was recorded after treatment at predetermined time intervals (0, 0.25, 0.5, 1, 2, 4, 6, 8, and 12 h). A plot was made between mean systolic BP (mm of Hg) with respect to time (hour). The statistical analysis was carried out by applying paired t test to identify the significant difference between the groups.
Fourier Transformed Infrared Spectroscopy
The drug–excipient compatibility study was carried out by Fourier transformed infrared (FT-IR) spectroscopy. The FT-IR spectra of physical mixture of drug with self-emulsifying excipients and porous carriers were carried out using KBr disk. The spectra were recorded employing the Shimadzu IR-affinity-1 FT-IR spectrophotometer (Shimadzu, Japan).
Powder XRD Studies
Powder X-ray diffraction studies were carried out for solid-state characterization and to observe the crystallographic structure of pure drug and SNEGs. X-ray diffraction patterns of pure drug, physical mixture with porous carrier were recorded on Philips PW 17291 powder X-ray diffractometer (Jeol, Peabody, MA) using Ni-filtered, Cu kV radiation, a voltage of 40 kV and a 25-mA current. The scanning rate employed was maintained at 1° min−1 over the 10–40° 2θ range.
Accelerated Stability Studies and Shelf-life Estimation
For accelerated stability studies, the optimized liquid SNEDDS and S-SNEDDS were stored at 40°C/75% RH for 6 months. Samples were withdrawn after specified time intervals (0, 1, 2, 3, and 6 months) and observed for SEF time, globule size, drug release in 15 min and disintegration time. For estimation of shelf life, the optimized S-SNEDDS was suitably packed in high-density polyethylene plastic bottles and stored at different temperatures such as 30 ± 0.5, 40 ± 0.5, 50 ± 0.5 and 60 ± 0.5°C up to a period of 3 months. Samples were withdrawn after specified time intervals (0, 1, 2, 3, and 6 months), concentration, and log concentration of drug remaining was analyzed. Order of reaction was determined to identify the degradation kinetics under accelerated conditions. The reaction rate constant (K) for drug degradation was measured from the slope of the lines at each elevated temperature using Eq (1):
 |
1 |
Arrhenius plot was made between log K values at various elevated temperatures against the reciprocal of absolute temperature. From the plot, K value at 25°C (K25) was determined and used to calculate shelf life (t90) by substituting in the Eq. (2):
 |
2 |
RESULTS AND DISCUSSION
Solubility Studies
The comparative solubility studies of the drug in various oils, surfactants, and cosurfactants are reported in Figs. 1 and 2, respectively. As portrayed from the figures, among the oils Capmul MCM (365 ± 1.9 mg/mL), among the surfactants Labrasol (520 ± 1.8 mg/mL) and among the cosurfactants PEG 600 (387.5 ± 2.3 mg/mL), and Tween 20 (194.5 ± 2.0 mg/mL) showed highest solubility for valsartan. Hence, they were selected for phase titration studies for construction of pseudoternary phase diagrams.
Fig. 1.
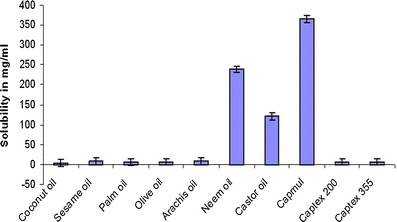
Equilibrium solubility of valsartan in various oils in mg/ml, data represented as mean ± SD; (n = 3)
Fig. 2.
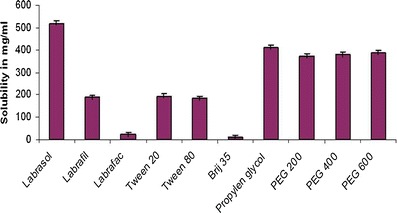
Equilibrium of valsartan in various surfactants and cosurfactants in milligrams per milliliter, data represented as mean ± SD; (n = 3)
Construction of Pseudoternary Phase Diagrams
The pseudoternary phase diagrams were constructed in the absence of drug to identify the self-emulsifying regions and to optimize the concentration of oil, surfactant, and cosurfactant in the SNEDDS formulations. Figures 3 and 4 depict the phase diagrams of the systems containing Capmul MCM as oil, Labrasol as surfactant, and Tween 20 and PEG 600 as cosurfactants. It was observed that efficiency of emulsification was good when the Smix concentration was more than 65% of SNEDDS formulation. Further, increasing the concentration of surfactant increased the spontaneity of the self-emulsification process. However, it was also observed that emulsification was not efficient with less than 50% of Smix ratio. The increase in cosurfactant decreases the region of emulsion formation, as cosurfactant have very little effect on reducing the interfacial tension directly rather they help the surfactants to reduce the interfacial tension (24). In a comparative study between the selected cosurfactants, Tween 20 showed larger self-emulsification region than PEG 600, due its hydrophilic nature. Higher hydrophilicity property favors faster emulsification of the oil–surfactant mixture in contact with water (28). Based on the various combinations, Capmul MCM, Labrasol, and Tween 20 (1:1) were selected for formulation development, as the above Smix ratio showed highest area for nanoemulsion formation.
Fig. 3.
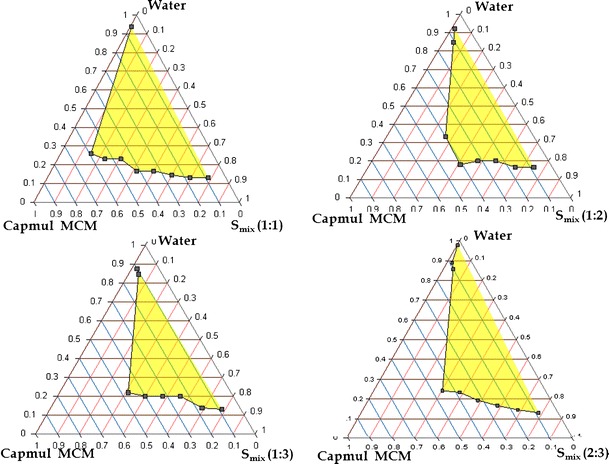
Pseudoternary phase diagram of systems containing 1:1, 1:2, 1:3, 2:3 ratio of S/CoS such as Labrasol and Tween 20, Capmul MCM as oil
Fig. 4.
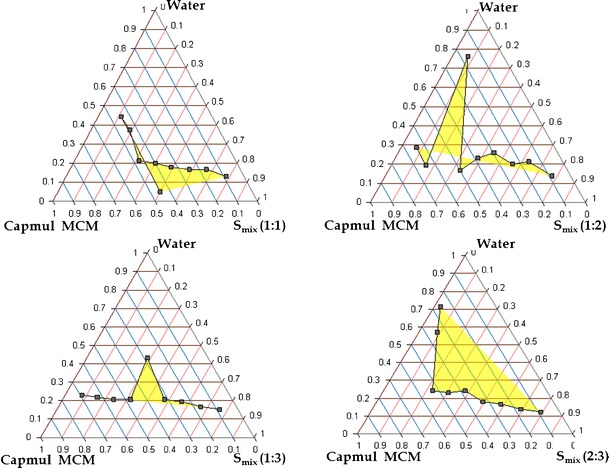
Pseudoternary phase diagram of systems containing 1:1, 1:2, 1:3, 2:3 ratio of S/CoS such as Labrasol and PEG 600, Capmul MCM as oil
Optimization of SNEDDS
A total 17 formulations were prepared as per the experimental design and characterized for various responses like SEF time, % drug release in 15 min and globule size as shown in Table II. The response surface analysis was carried out to understand the effect of selected independent variables on the observed responses. The mathematical relationships were established and coefficients of the second order polynomial equation (Eq. 3), generated using MLRA for SEF time, percent drug release in 15 min and globule size were found to be quadratic in nature with interaction terms. The coefficients of the polynomials fit well to the data, with the values of R2 ranging between 0.9350 and 0.9942 (p < 0.05 in all the cases).
 |
3 |
Figure 5 (a–c) depicts the 3D-response surfaces for various response variables. Figure 5a depicts a dome-shaped response surface plot, characterizing initial increase in the SEF time with increasing the concentration of both oil (Capmul MCM) and surfactant (Labrasol), followed by a gradual decrease. Hence, it can be revealed that at the intermediate levels of oil and surfactant, the SEF time was found to be maximum. Similarly, Fig. 5b depicts a relationship between surfactant and co-surfactant on drug release. It was observed that at low concentration of oil, surfactant, and intermediate concentration of cosurfactant, percent drug release in 15 min was larger. Figure 5c portrays an interaction effect and relationship between oil (Capmul MCM) and cosurfactant (Tween 20) on the globule size as the response variable. A curvilinear plot was observed, where with increasing the amount of Capmul MCM and Tween 20, a linear increase in the globule size was observed. Hence, at low levels of oil (Capmul MCM) and cosurfactant (Tween 20) and intermediate levels of surfactant (Labrasol), the globule size was ideal. All the response surfaces were best fitted with quadratic polynomial models, and able to predict the interaction effects too. Finally, the model was observed for ANOVA (p < 0.001), which revealed that the model terms for main effects and interaction effects were statistically significant. The ANOVA results are enumerated in Table III. Finally, the optimized formulation was selected by numerical optimization method from the Design-Expert 8.0.5 having the desirability value as 1. The composition of the optimized SNEDDS formulation was found to be Capmul MCM (117.50 μL), Labrasol (171.00 μL), Tween 80 (171.00 μL), and valsartan 40 mg, respectively.
Fig. 5.
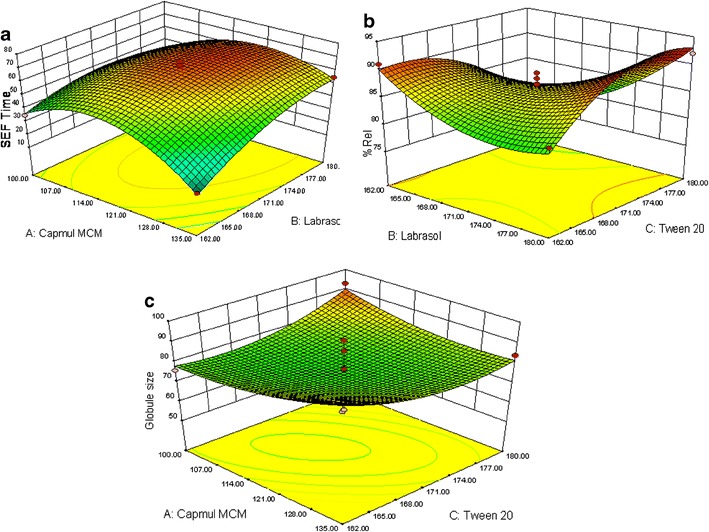
Response surface analysis: a response surface graph representing the effect of Capmul MCM and Labrasol on SEF time of SNEDDS, b response surface graph representing the effect of Labrasol and Tween 20 on %Rel15min of SNEDDS, c response surface graph representing the effect of Capmul MCM and Tween 20 on globule size of SNEDDS
Table III.
ANOVA Results of Various Responses Using Experimental Design
| ANOVA parameters | Y 1 (SEF time) | Y 2 (% drug release after 15 min) | Y 3 (globule size) |
|---|---|---|---|
| SS | 2446.17 | 5900.67 | 287.23 |
| df | 9 | 9 | 9 |
| MS | 271.80 | 655.63 | 31.91 |
| F value | 6.27 | 3.20 | 37.82 |
| Prob > F | 0.1451 | 0.2610 | 0.0260 |
| Std. deviation | 6.59 | 14.32 | 0.92 |
| R 2 value | 0.9658 | 0.9350 | 0.9942 |
| Suggested model | Quadratic | Quadratic | Quadratic |
Characterization of SNEDDS
All the liquid SNEDDS formulation prepared as per the experimental design showed good self-emulsification efficiency and forms nanoemulsion immediately after dilution with aqueous phase within 1 min. In vitro drug release studies showed more than 80% drug release in initial 15 min and complete drug release was observed within 30 min. This was attributed due to solubility enhancement by selected lipidic excipients (29). Figure 6 represents the globule size distribution of liquid SNEDDS were found to be within the nanometric range (56–91 nm). Refractive index and viscocity were found to be 1.398 ± 0.021 and 28.38 ± 0.63 cPs, which indicated that formulations were clear and transparent with good pourability. TEM image of the optimized SNEDDS after dilution appeared as dark globules as shown in Fig. 7.
Fig. 6.
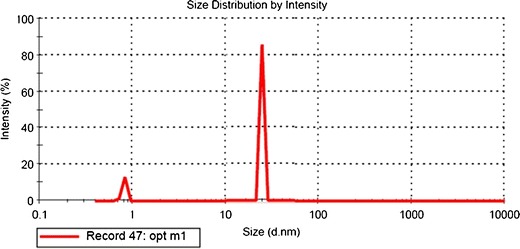
Particle size distribution of optimized liquid SNEDDS formulation
Fig. 7.
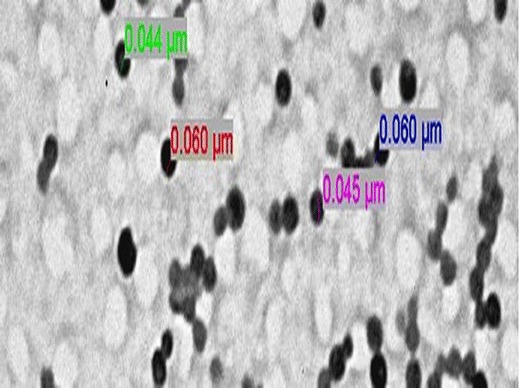
TEM image of the optimized liquid SNEDDS formulation representing the dark emulsion globules
Optimization of S-SNEDDS
The formulation composition of different batches of SNEGs and S-SNEDDS prepared are shown in Table IV. The SNEGs prepared using porous carriers were optimized based on their oil adsorption capacity, faster drug release property, and flow characteristics. The micromeritic properties and drug content of different granules indicating oil adsorption tendency of porous carriers as depicted in Table V. All the batches of SNEGs showed good flow characteristics with Carr’s index between 12 and 16, Hausner’s ratio less than 1.25 and angle of repose (θ) < 25. Oil adsorption capacity was determined by drug content estimation showed that Sylysia 350 and Neusilin US2 containing granules (G2 and G5) showed highest oil adsorption tendency due to highly porous nature and presence of larger interparticulate void space in the particles, however, Aerosil 200-containing granules showed lowest oil adsorption tendency. It has also been observed that in case of Sylysia-containing granules, oil adsorption tendency was decreased with higher grades of Sylysia in order of Sylysia 350 (G2) > Sylysia 500 (G3) > Sylysia 730 (G4), owing to increase in particle size which decreases the porosity (30, 31). Further, the oil adsorption tendency of Neusilin US2-containing granules (G5) was found to be better over Sylysia 500, 730, due to highly porous structure. The in vitro dissolution studies of the S-SNEDDS revealed that all formulations showed faster drug release property with more than 75% drug release in first 15 min and complete drug release within 30 min. Among Sylysia 350-containing granules-based tablet formulations (T2–T4), T2 showed faster dissolution with highest drug release up to 91%. Thus, T2 was finally selected as the optimized S-SNEDDS formulation.
Table IV.
Composition of S-SNEDDS Prepared Using SNEGs
| Component(s) | G1 | G2 | G3 | G4 | G5 |
|---|---|---|---|---|---|
| SNEDDS (μL) | 500 | 500 | 500 | 500 | 500 |
| Aerosil 200 (mg) | 450 | – | – | – | – |
| Sylysia 350 (mg) | – | 270 | – | – | – |
| Sylysia 550 (mg) | – | – | 375 | – | – |
| Sylysia 730 (mg) | – | – | – | 425 | – |
| Neusilin US2 (mg) | – | – | – | – | 310 |
| Component(s) | T1 | T2 | T3 | T4 | T5 |
| Avicel 112 (mg) | 110 | 140 | 135 | 135 | 100 |
| Cross povidone (mg) | 80 | 80 | 80 | 80 | 80 |
| Mg stearate (mg) | 10 | 10 | 10 | 10 | 10 |
| Total (mg/tablet) | 650 | 500 | 600 | 650 | 500 |
Table V.
Micromeritic Properties and Drug Content Estimation of SNEGs
| SNEGs | Hausner’s ratio | Carr’s index | Angle of repose (θ) | %Drug content |
|---|---|---|---|---|
| G1 | 1.02 ± 0.09 | 15 ± 3 | 21.0 ± 2 | 86 ± 0.14 |
| G2 | 1.09 ± 0.05 | 16 ± 5 | 25.0 ± 5 | 100 ± 0.23 |
| G3 | 1.13 ± 0.08 | 15 ± 2 | 24.0 ± 3 | 97 ± 0.31 |
| G4 | 1.03 ± 0.03 | 14 ± 7 | 23.5 ± 7 | 95 ± 0.36 |
| G5 | 1.07 ± 0.04 | 14 ± 4 | 23.0 ± 6 | 98 ± 0.17 |
Characterization of S-SNEDDS
The tablet hardness was found to be 6 kg/cm2, friability was less than 1%, disintegration time was less than 2 min, and weight variation was found to be within the pharmacopoeial acceptance limits. This indicated immediate release nature of the prepared tablets due to the porous carriers.
Comparative In Vitro Drug Release Studies
Dissolution profile of pure drug valsartan, marketed preparation (Valzaar® 40), optimized liquid SNEDDS and S-SNEDDS (T2) was carried out using standard conditions in SGF and phosphate buffer pH 6.8 are shown in Fig. 8. The drug release studies portrayed optimized liquid SNEDDS and S-SNEDDS formulations exhibited faster drug release up to 98.91% and 93% within 30 min in SGF vis-à-vis the pure drug and marketed preparation showed maximum drug release up to 29.2% and 31% in 30 min, respectively. This confirmed that prepared S-SNEDDS formulations showed 3–3.5-fold increase in the dissolution rate of valsartan due to enhanced solubility. The faster drug release from SNEDDS is attributed due to spontaneous formation of nanoemulsion due to low surface free energy at oil–water interface, which causes immediate solubilization of drug in dissolution medium. During emulsification with water, oil, surfactant, and cosurfactant effectively swells and decreases; the globule size leads to decrease in surface area and surface free energy, thus eventually increases the drug release rate (23).
Fig. 8.
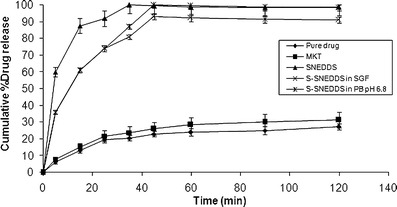
Comparative in vitro drug release profile of pure drug, marketed preparation (Valzaar®40), optimized SNEDDS and S-SNDDS formulations containing Sylysia 350 in SGF and pH 6.8 phosphate buffer. Data represented are cumulative percent drug release versus time (minute) in terms of mean ± SD. (n = 3)
Further, upon deep investigation it has been revealed that drug release from S-SNEDDS was slightly slower compared to SNEDDS, because additional steps like disintegration of tablet into granules desorption of liquid SNEDDS from silica surface and interparticulate voids of porous carrier slows down the release process (25). However, the difference in drug release between liquid SNEDDS and S-SNEDDS was not statistically significant (p > 0.1). This confirmed that S-SNEDDS preserved the property of liquid SNEDDS. The mean dissolution time (MDT) was used to predict dissolution efficiency of prepared formulations. Lower MDT with SNEDDS (MDT = 7.97 min) and S-SNEDDS (MDT = 9.03 min) indicated higher dissolution efficiency and faster solubilization of drug compared to pure drug (MDT = 25.76 min) and marketed preparation (MDT = 22.95 min).
The in vitro drug release from S-SNEDDS prepared using porous carriers can be explained by the rapid desorption of the liquid SNEDDS from silica surface owing to the stronger physical interactions between silica and SGF compared to silica and liquid SNEDDS (25,32). Further, high specific surface area of these particles contributes to improved dissolution compared to pure drug. Additional parameters influencing dissolution rate of S-SNEDDS are the improved wetting of dispersion granules due to accelerated penetration of dissolution medium into the voids and capillaries of these granules. Mathematical modeling of dissolution data revealed that drug release from S-SNEDDS follows non-Fickian zero order kinetic. Other mechanisms including diffusion and convection of liquid SNEDDS when porous carriers come in contact with dissolution medium governs the drug release from S-SNEDDS (33).
In Vivo Pharmacodynamic Studies
Figure 9 represents the comparison of mean systolic BP of different groups of animal after treatment with oral suspension of pure drug and optimized S-SNEDDS of valsartan. The comparison of mean systolic BP of rats before and after MPA treatment for 2 weeks revealed that hypertension was successfully induced in the normotensive rats due to excessive production of glucocorticoids. Administration of MPA raised the mean BP to 198.13–220.23 mm of Hg in normotensive animals. However oral administration of valsartan suspension and S-SNEDDS formulations revealed a significant reduction in mean systolic BP.
Fig. 9.
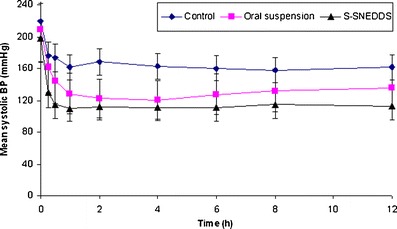
In vivo pharmacodynamic study representing the mean systolic BP (millimeter in Hg) by control, oral suspension, and S-SNEDDS. Data represented are cumulative percent drug release versus time (minute) in terms of mean ± SD. (n = 3)
In the control group, the mean systolic BP was found to be constant throughout the study period with minimum BP was recorded to be 161.53 ± 2.31 mm of Hg at 12 h, while in treatment group received the oral suspension of valsartan observed reduction of mean systolic BP to 144.75 ± 1.85 mm of Hg after 0.5 h and 122.34 ± 2.26 mm of Hg in 2 h. However administration of S-SNEDDS formulation of valsartan observed a significant reduction in mean systolic BP to 114.54 ± 1.84 mm of Hg after 0.5 h and 112.01 ± 2.27 mm of Hg in 2 h i.e., animals reaches to normotensive state due to faster onset of action attributed by enhanced bioavailability potential of self-nanoemulsifying formulations (Fig. 9) (34). The S-SNEDDS upon peroral administration undergo emulsification in gastric milieu to produce nanoemulsion, which get easily absorbed through lymphatic pathways. Statistical analysis by paired t test revealed that significant difference (p < 0.05) in mean systolic BP reduced by S-SNEDDS and oral suspension of valsartan.
Fourier Transformed Infrared Spectroscopy
The FT-IR spectra of physical mixture of drug with various excipients observed no specific physiochemical interaction. There was no significant difference found in wave number (per centimeter) or functional group of the drug in all spectra (Fig. 10).
Fig. 10.
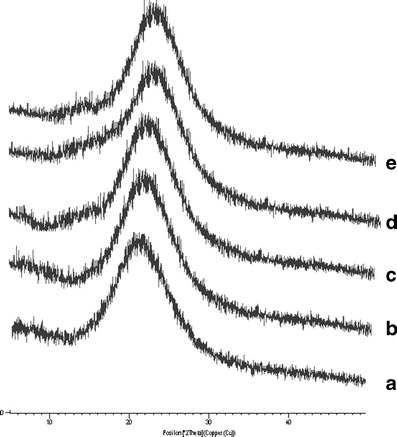
Powder XRD spectra of valsartan with different solid excipients: a valsartan, b physical mixture of valsartan and Sylysia 350, c physical mixture of valsartan and Neusilin US2, d valsartan-loaded self-nanoemulsifying granules using Sylysia 350, e valsartan-loaded self-nanoemulsifying granules using NeusilinTM US2
Powder XRD Studies
Powder X-ray diffraction patterns confirmed physical nature of the valsartan and prepared SNEGs (G2 and G5) containing Sylysia 350 and Neusilin US2 (Fig. 11). X-ray diffractogram of pure drug showed no sharp peak indicating its amorphous nature. Similar observations were seen for SNEGs, as they showed no intense peaks dictating the drug is present in solubilized state in lipidic excipients. The diffuse peaks observed in the spectra are may be due to the porous carriers (6,22).
Fig. 11.
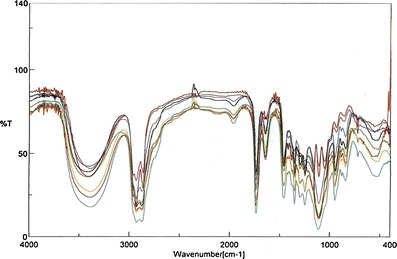
FT-IR spectra of valsartan and different formulations: a valsartan, b physical mixture of valsartan and Capmul MCM, c physical mixture of valsartan and Labrasol, d physical mixture of valsartan and Tween-20, e optimized SNEDDS formulation, f valsartan-loaded self-nanoemulsifying granules in Sylysia 350, g valsartan-loaded self-nanoemulsifying granules in Neusilin US2, h optimized S-SNEDDS tablet formulation T2
Accelerated Stability Studies and Shelf-life Estimation
During accelerated stability studies (40°C/75%RH), different formulation parameters like SEF time, globule size, percent drug release in 15 min and disintegration time of prepared self-nanoemulsifying formulations were evaluated at specified time intervals (0, 1, 2, 3, and 6 months) are depicted in Table VI. Results showed that there was no significant change in these parameters with respect to temperature. Further, to find out the shelf life of prepared S-SNEDDS stored at 30 ± 0.5°C, 40 ± 0.5°C and 50 ± 0.5°C for 3 months, the concentration and log concentration of drug remaining was determined. The order of degradation of valsartan in formulation was found to follow first-order kinetics. The reaction rate constant “K” for the degradation was measured from the slope of the lines at each elevated temperature (Table VII). Arrhenius plot for the S-SNEDDS at each elevated temperature was drawn between log K values against the reciprocal of absolute temperature as shown in Fig. 12. From the plot, K value at 25°C (K25) was determined and used to calculate shelf life. Finally, shelf life of the optimized S-SNEDDS at room temperature was calculated to be 617 days or 1.76 years.
Table VI.
Characterization of S-SNEDDS After Accelerated Stability Study at 40°C/75%RH
| Sampling time (months) | SEF time (s) | Globule size (nm) | %Rel15min | Dt (min) |
|---|---|---|---|---|
| 0 | 16 ± 0.2 | 46 ± 0.6 | 101.5 ± 0.7 | 3.3 ± 1.1 |
| 1 | 16 ± 0.8 | 48 ± 0.7 | 99.9 ± 2.7 | 3.7 ± 1.1 |
| 2 | 18 ± 0.3 | 47 ± 0.3 | 98.8 ± 3.1 | 4.3 ± 2.3 |
| 3 | 17 ± 0.7 | 47 ± 0.4 | 97.7 ± 3.7 | 3.9 ± 1.1 |
| 6 | 18 ± 0.5 | 51 ± 0.3 | 96.6 ± 0.8 | 4.2 ± 0.2 |
Table VII.
Observation Table for Calculation of Shelf Life
| Temperature (°C) | Absolute temperature (K) | Slope | K | K × 10-3 (month–1) | Log K | 1/T × 103 |
|---|---|---|---|---|---|---|
| 25 | 298.00 | – | 0.00017 | 1.7 | −3.769 | 3.355704 |
| 30 | 303.00 | −0.0008 | 0.0008 | 1.8424 | −2.7346 | 3.300330 |
| 40 | 313.00 | −0.0014 | 0.0032 | 3.2042 | −2.4943 | 3.194488 |
| 50 | 323.00 | −0.0034 | 0.0078 | 7.8302 | −2.1062 | 3.095975 |
| 60 | 333.00 | −0.0053 | 0.0122 | 12.2059 | −1.9134 | 3.003003 |
Fig. 12.
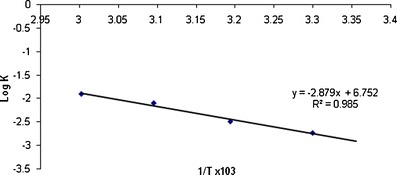
Arrhenius plot for the optimized S-SNEDDS tablet formulation
CONCLUSION
The present studies successfully developed a novel S-SNEDDS of valsartan employing porous carriers for augmenting its oral bioavailability. The application of experimental design and response surface methodology helped in analyzing the effect of independent variables on responses viz. self-emulsification time, percentage drug release, and globule size, which acts as parameters for performance evaluation of SNEDDS. Among the porous carriers utilized viz. Sylysia 350, 550, 730 and Neusilin US2, the Sylysia 350 showed better drug release property. In vitro dissolution studies showed that S-SNEDDS had a faster drug release rate than conventional marketed preparation and pure drug. The optimized S-SNEDDS formulation exhibited 3–3.5-fold enhancement in dissolution rate as evident from in vitro dissolution studies. Further, the FT-IR and XRD study showed no interaction of porous carriers used with developed self-emulsifying system. Thus, it can be concluded that the S-SNEDDS can be suitable formulation approach for bioavailability enhancement of valsartan.
ACKNOWLEDGMENTS
The authors are highly thankful to SAIF Panjab University, Chandigarh for carrying out the powder X-ray diffraction study and also thankful to Institute of Life Sciences, Bhubaneswar for providing the facility to determine the globule size and AIIMS, New Delhi for TEM study.
Conflict of Interest
Authors declare no conflict(s) of interest.
REFERENCES
- 1.Chioléro A, Burnier M. Pharmacology of valsartan, an angiotensin II receptor antagonist. Expert Opin Investig Drugs. 1998;7:1915–1925. doi: 10.1517/13543784.7.11.1915. [DOI] [PubMed] [Google Scholar]
- 2.Valsartan. Drug bank. http://www.drugbank.ca/drugs/APRD00133. Accessed on 12 August 2011.
- 3.Park YJ, Lee HK, Im YB, Lee W, Han HK. Improved pH-independent dissolution and oral absorption of valsartan via the preparation of solid dispersion. Arch Pharm Res. 2010;33:1235–1240. doi: 10.1007/s12272-010-0814-0. [DOI] [PubMed] [Google Scholar]
- 4.Dixit AR, Rajput SJ, Patel SG. Preparation and bioavailability assessment of SMEDDS containing valsartan. AAPS Pharm Sci Tech. 2010;11:314–321. doi: 10.1208/s12249-010-9385-0. [DOI] [PMC free article] [PubMed] [Google Scholar]
- 5.Yana YD, Sunga JH, Kima KK, Kimb DW, Kima JO, Leec BJ, Yonga CS, Cho HG. Novel valsartan-loaded solid dispersion with enhanced bioavailability and no crystalline changes. Int J Pharm. 2012;422:202–210. doi: 10.1016/j.ijpharm.2011.10.053. [DOI] [PubMed] [Google Scholar]
- 6.Shrivastava AR, Kapadia UB. Design, optimization, preparation and evaluation of dispersion granules of valsartan and formulation into tablets. Curr Drug Deliv. 2009;6:28–37. doi: 10.2174/156720109787048258. [DOI] [PubMed] [Google Scholar]
- 7.Liyan W. Valsartan liposome, preparation method thereof and medicinal composition containing same, CN 101819580 (2010)
- 8.Singh B, Khurana L, Bandyopadhyay S, Kapil R, Katare OP. Development of optimized self-nano-emulsifying drug delivery systems (SNEDDS) of carvedilol with enhanced bioavailability potential. Drug Deliv. 2011;18:599–612. doi: 10.3109/10717544.2011.604686. [DOI] [PubMed] [Google Scholar]
- 9.Constantinides PP. Lipid microemulsions for improving drug dissolution and oral absorption: physical and biopharmaceutical aspects. Pharm Res. 1995;12:1561–1572. doi: 10.1023/A:1016268311867. [DOI] [PubMed] [Google Scholar]
- 10.Gursoy RN, Benita S. Self-emulsifying drug delivery systems (SEDDS) for improved oral delivery of lipophilic drugs. Biomed Pharmacother. 2004;58:173–182. doi: 10.1016/j.biopha.2004.02.001. [DOI] [PubMed] [Google Scholar]
- 11.Pouton CW. Formulation of self-emulsifying drug delivery systems. Adv Drug Deliv Rev. 1997;25:47–58. doi: 10.1016/S0169-409X(96)00490-5. [DOI] [Google Scholar]
- 12.Mou D, Chen H, Du D, Mao C, Wan J, Xu H, Yang X. Hydrogel-thickened nanoemulsion system for topical delivery of lipophilic drugs. Int J Pharm. 2008;353:270–276. doi: 10.1016/j.ijpharm.2007.11.051. [DOI] [PubMed] [Google Scholar]
- 13.Porter CJH, Pouton CW, Cuine JF, Charman WN. Enhancing intestinal drug solubilisation using lipid-based delivery systems. Adv Drug Deliv Rev. 2008;60:673–691. doi: 10.1016/j.addr.2007.10.014. [DOI] [PubMed] [Google Scholar]
- 14.Cole ET, Cadé D, Benameur H. Challenges and opportunities in the encapsulation of liquid and semi-solid formulations into capsules for oral administration. Adv Drug Deliv Rev. 2008;60:747–756. doi: 10.1016/j.addr.2007.09.009. [DOI] [PubMed] [Google Scholar]
- 15.Kohli K, Chopra S, Dhar D, Arora S, Khar RK. Self-emulsifying drug delivery systems: an approach to enhance oral bioavailability. Drug Discov Today. 2010;15:958–965. doi: 10.1016/j.drudis.2010.08.007. [DOI] [PubMed] [Google Scholar]
- 16.Tang B, Cheng G, Gu JC, Xu CH. Development of solid self-emulsifying drug delivery systems: preparation techniques and dosage forms. Drug Discov Today. 2008;13:606–612. doi: 10.1016/j.drudis.2008.04.006. [DOI] [PubMed] [Google Scholar]
- 17.Singh A, Worku ZA, vanden Mooter G. Oral formulation strategies to improve solubility of poorly water-soluble drugs. Expert Opin Drug Deliv. 2011;8:1361–1378. doi: 10.1517/17425247.2011.606808. [DOI] [PubMed] [Google Scholar]
- 18.Hwang RC and Kowalski DL. Design of experiments for formulation development. Pharm Tech. 2005,1–5.
- 19.Singh B, Kumar R, Ahuja N. Optimizing drug delivery systems using systematic “design of experiments.” Part I: fundamental aspects. Crit Rev Ther Drug Carrier Syst. 2005;22(1):27–105. doi: 10.1615/CritRevTherDrugCarrierSyst.v22.i1.20. [DOI] [PubMed] [Google Scholar]
- 20.Nazzal S, Khan MA. Response surface methodology for the optimization of ubiquinone self-nanoemulsified drug delivery system. AAPS Pharm Sci Tech. 2002;3:23–31. doi: 10.1208/pt030103. [DOI] [PMC free article] [PubMed] [Google Scholar]
- 21.Shaji J, Lodha S. Response surface methodology for the optimization of celecoxib self-microemulsifying drug delivery system. Ind J Pharm Sci. 2008;70:585–590. doi: 10.4103/0250-474X.45395. [DOI] [PMC free article] [PubMed] [Google Scholar]
- 22.Dixit RP, Nagarsenker MS. Self-nanoemulsifying granules of ezetimibe: design, optimization and evaluation. Eur J Pharm Sci. 2008;35:183–192. doi: 10.1016/j.ejps.2008.06.013. [DOI] [PubMed] [Google Scholar]
- 23.Nazzal S, Nutan M, Palamakula A, Shah R, Zaghloul AA, Khan MA. Optimization of a self-nanoemulsified tablet dosage form of ubiquinone using response surface methodology: effect of formulation ingredients. Int J Pharm. 2002;240:103–114. doi: 10.1016/S0378-5173(02)00130-8. [DOI] [PubMed] [Google Scholar]
- 24.Kommuru TR, Gurley B, Khan MA, Reddy IK. Self-emulsifying drug delivery systems (SEDDS) of coenzyme Q10: formulation development and bioavailability assessment. Int J Pharm. 2001;212:233–246. doi: 10.1016/S0378-5173(00)00614-1. [DOI] [PubMed] [Google Scholar]
- 25.Ahuja G, Pathak K. Porous carriers for controlled/modulated drug delivery. Indian J Pharm Sci. 2009;71:599–607. doi: 10.4103/0250-474X.59540. [DOI] [PMC free article] [PubMed] [Google Scholar]
- 26.Dissolution methods database. [Online] Available at: http://www.accessdata.fda.gov/scripts/cder/dissolution/dsp_SearchResults_Dissolutions.cfm. Accessed 7 July 2011.
- 27.Aqil M, Sultana Y, Ali A, Dubey K, Najmi AK, Pillai KK. Transdermal drug delivery systems of a beta blocker: design, in vitro, and in vivo characterization. Drug Deliv. 2004;11:27–31. doi: 10.1080/10717540490265225. [DOI] [PubMed] [Google Scholar]
- 28.Rizwan M, Aqil M, Azeem A, Talegaonkar S, Sultana Y, Ali A. Enhanced transdermal delivery of carvedilol using nanoemulsion as a vehicle. J Exp Nanosci. 2010;5:390–411. doi: 10.1080/17458080903583964. [DOI] [Google Scholar]
- 29.Beg S, Jena SS, Patra CN, Rizwan M, Swain S, Sruti J, Rao MEB, Singh B. Development of solid self-nanoemulsifying granules (SSNEGs) of ondansetron hydrochloride with enhanced bioavailability potential. Colloids and Surfaces B: Biointerfaces. 2013;101:414–423. doi: 10.1016/j.colsurfb.2012.06.031. [DOI] [PubMed] [Google Scholar]
- 30.Wang L, Cui FD, Sunada H. Preparation and evaluation of solid dispersions of nitrendipine prepared with fine silica particles using the melt-mixing method. Chem Pharm Bull. 2006;54:37–43. doi: 10.1248/cpb.54.37. [DOI] [PubMed] [Google Scholar]
- 31.Lee BJ, On DH, Kim JO, Hong MJ, Jee JP, Kim JA, You BK, Wo JS, Yong CS, Choi HG. Enhanced oral bioavailability of dexibuprofen by novel solid self-emulsifying drug delivery system (SEDDS) Eur J Pharm Biopharm. 2009;72:539–545. doi: 10.1016/j.ejpb.2009.03.001. [DOI] [PubMed] [Google Scholar]
- 32.Planisek O, Kovacic B, Vrecer F. Carvedilol dissolution improvement by preparation of solid dispersions with porous silica. Int J Pharm. 2011;406:41–48. doi: 10.1016/j.ijpharm.2010.12.035. [DOI] [PubMed] [Google Scholar]
- 33.Sharma S, Sher P, Bardve S, Atmaram PP. Adsorption of meloxicam on porous calcium silicate: characterization and tablet formulation. AAPS Pharm Sci Tech. 2005;6:E618–E625. doi: 10.1208/pt060476. [DOI] [PMC free article] [PubMed] [Google Scholar]
- 34.Pouton CW. Effects of inclusion of a model drug on the performance of self-emulsifying formulations. J Pharm Pharmacol. 1985;37:1–11. doi: 10.1111/j.2042-7158.1985.tb14073.x. [DOI] [Google Scholar]