Abstract
A method is described using rapid and sensitive Fourier transform near-infrared spectroscopy combined with high-performance liquid chromatography–diode array detection for the simultaneous identification and determination of four bioactive compounds in crude Radix Scrophulariae samples. Partial least squares regression is selected as the analysis type and multiplicative scatter correction, second derivative, and Savitzky–Golay filter were adopted for the spectral pretreatment. The correlation coefficients (R) of the calibration models were above 0.96 and the root mean square error of predictions were under 0.028. The developed models were applied to unknown samples with satisfactory results. The established method was validated and can be applied to the intrinsic quality control of crude Radix Scrophulariae.
KEY WORDS: crude Radix Scrophulariae, FT-NIRS, HPLC-DAD, quality control, quantification
INTRODUCTION
Radix Scrophulariae known as “Xuanshen” in Chinese, derived from the dried root of Scrophularia ningpoensis Hemsl, is one of the most widely and commonly used herbs within traditional Chinese medicine (TCM) (1,2). Pharmacological studies and clinical practice have demonstrated that Radix Scrophulariae possesses various bioactivities, including antichronic inflammatory, antihypertensive, abirritative, antispasmodic, antihepatitis B virus, and immunological enhancement. The efficacy of this herb results from the synergetic action of the various constituents covering iridoid glycosides, phenylpropanoid glycosides, as well as cinnamic acid (CA). Harpagoside (HG) is a characteristic and active constituent of Radix Scrophulariae and some researchers also showed that HG has some pharmacological effects which are closely related to the nourishment of yin for lowering fire (3–5).
Several analytical methods have been developed to investigate the contents of the main components in Radix Scrophulariae, for instance, high-performance liquid chromatography (HPLC) coupled with different detectors, such as diode array detection (DAD), ion trap mass spectrometry, and electrospray ionization time-of-flight mass spectrometry (6–8).
Near-infrared spectroscopy (NIRS) is currently widely applied to quantify active pharmaceutical ingredients in many pharmaceutical formulations (9–12). It provides a rapid, nondestructive method without complicated sample preparation. Thus, it plays a significant role in the quality control of TCM. To date, for Radix Scrophulariae, only the quantification of HG and CA by NIRS has been reported (13) and those alone do not fully reflect the chemical characteristics of Radix Scrophulariae.
In the present study, a new application based on NIRS and HPLC-DAD, partial least squares (PLS) regression, and multiplicative signal correction (MSC) was developed for the simultaneous determination of four main components including HG, CA, acteoside (AT), and angroside C (ARC) for the first time. The precision and accuracy of the new NIR method were validated, comparing with the standard HPLC method. On the basis of this new NIRS quantitative model, 10 batches of Radix Scrophulariae samples were also analyzed. This technology shows satisfactory results and could be broadly used for the quality control of TCM.
MATERIALS AND METHODS
Samples and Reagents
A total of 51 crude Radix Scrophulariae from different areas in China were collected and analyzed (Table I). These samples were authenticated by Professor Yun Zhang (Research Center of TCM Processing Technology, Zhejiang Chinese Medical University, Hangzhou, China). Voucher specimens were deposited at the Research Center of TCM Processing Technology. The reference standards of HG, CA, AT, and ARC were purchased from the National Institute for the Control of Pharmaceutical and Biological Products (Beijing, China). The purities of all four standards were ≥98% by HPLC analysis. The structures of these four compounds were shown in Fig. 1. The HPLC-grade acetonitrile was purchased from Merck (Darmstadt, Germany), phosphoric acid was purchased from Tedia (Fairfield, Ohio, USA), and ultrapure water was prepared by a Milli-Q50 SP Reagent Water System (Millipore, Billerica, Massachusetts, USA) for the preparation of samples and buffer solutions. Other reagents were of analytical grade.
Table I.
The Origin and Respective Voucher Number of Crude Radix Scrophulariae
| Sample no. | Origin |
|---|---|
| 1 | Dongyang, Zhejiang A |
| 2 | Dongyang, Zhejiang B |
| 3 | Dongyang, Zhejiang C |
| 4 | Dongyang, Zhejiang D |
| 5 | Dongyang, Zhejiang E |
| 6 | Dongyang, Zhejiang F |
| 7 | Panan, Zhejiang A |
| 8 | Henan A |
| 9 | Dongyang, Zhejiang G |
| 10 | Hunan |
| 11 | Dongyang, Zhejiang H |
| 12 | Anhui |
| 13 | Panan, Zhejiang B |
| 14 | Dongyang, Zhejiang I |
| 15 | Panan, Zhejiang C |
| 16 | Dongyang, Zhejiang J |
| 17 | Xianju, Zhejiang A |
| 18 | Xianju, Zhejiang B |
| 19 | Chongqing |
| 20 | Shandong A |
| 21 | Dongyang, Zhejiang K |
| 22 | Jinyun, Zhejiang A |
| 23 | Jinyun, Zhejiang B |
| 24 | Jinyun, Zhejiang C |
| 25 | Jinyun, Zhejiang D |
| 26 | Jinyun, Zhejiang E |
| 27 | Jinyun, Zhejiang F |
| 28 | Panan, Zhejiang D |
| 29 | Panan, Zhejiang E |
| 30 | Panan, Zhejiang F |
| 31 | Panan, Zhejiang G |
| 32 | Fuyang, Zhejiang |
| 33 | Zhejiang I |
| 34 | Henan |
| 35 | Shandong B |
| 36 | Zhejiang II |
| 37 | Jiangxi |
| 38 | Hubei |
| 39 | Zhejiang III |
| 40 | Zhejiang IV |
| 41 | Zhejiang V |
| 42 | Shandong C |
| 43 | Shandong D |
| 44 | Zhejiang VI |
| 45 | Panan, Zhejiang D |
| 46 | Panan, Zhejiang E |
| 47 | Panan, Zhejiang F |
| 48 | Panan, Zhejiang G |
| 49 | Henan B |
| 50 | Henan C |
| 51 | Henan D |
Fig. 1.

The chemical structures of four active components in crude Radix Scrophulariae
Standard Solutions and Sample Preparation
Primary stock standard solutions of the four compounds were prepared by dissolving them with methanol, respectively, to get a concentration of 0.0543 mg/mL (AT), 0.0284 mg/mL (ARC), 0.0204 mg/mL (HG), and 0.0275 mg/mL (CA). Working mixed standard solutions were prepared daily by mixing the stock solutions and diluted to a series of standard mixed solutions with methanol. The solutions were all stored at 4°C.
All crude Radix Scrophulariae samples were milled into powder with a grinder and then dried at 60°C for 2 h prior to analysis to avoid the effect of moisture. The powder of crude Radix Scrophulariae samples were precisely weighed (0.500 g) and transferred into dark brown volumetric flasks. They were extracted with 50 mL of 50% methanol in an ultrasonic bath for 45 min. Additional 50% methanol was added to make up the volume lost to evaporation. The extracts were filtered through a 0.45-μm membrane prior to injection.
HPLC Analysis
Chromatographic analyses were carried out on an Agilent 1200 HPLC system (Agilent Technologies, Palo Alto, California, USA) with diode array detector. An Agilent Zorbax Extend C18 (250 × 4.6 mm, 5 μm) was used with a flow rate of 1.0 mL/min. Detection wavelength was set at 280 nm. The injection volume was 10 μL and the column temperature was maintained at 30°C. The mobile phase was composed of (A) aqueous phosphoric acid (0.03%, v/v) and (B) acetonitrile using a gradient elution of 3–6% B at 0–8 min, 6–15% B at 8–18 min, 15–20% B at 18–25 min, 20–35% B at 25–35 min, 35–47% B at 35–38 min, 47% B at 38–40 min, 47–75% B at 40–45 min, and 75–80% B at 45–50 min.
NIR Spectra Collection
The NIR spectra of Radix Scrophulariae powder samples were collected using a Thermo ANTARIS II FT-NIR spectrometer (Thermo Electron Co., Madison, Wisconsin, USA) equipped with an InGaAs detector, an integrating sphere, sample cup, and rotary tables. The system was operated by the RESULT operating system and the spectral data were analyzed by the TQ Analyst software package (version 8.0).
The spectra were obtained with an 8 cm−1 resolution over a wavelength range of 10,000–4,000 cm−1 with 64 scans per spectrum. Both sample and background scan times were 32 s, and air absorption is recorded as a reference standard. An average spectrum was obtained after each sample was measured three times. Powdered samples were weighed precisely each time and put in the sample cup. A slight tap was needed to make the powder more uniform before the measurements.
Preprocessing Method
In this work, several data preprocessing methods, including derivation, MSC, Savitzky–Golay (SG), first derivative (1-Der), and second derivative (2-Der) were investigated for NIR spectra in order to minimize the interfering effect such as correction of scatter effect, elimination of baseline shift, systematic noise, path length differences, and smoothing spectrum, etc.
Parameters for Evaluating Models
To build a robust PLS calibration model, the optimum preprocessing method was selected based upon root mean square error of calibration (RMSEC), root mean square error of prediction (RMSEP), root mean square error of cross-validation (RMSECV), prediction residual error sum of squares (PRESS), and correlation coefficients (R) (14).
RMSEC and RMSEP indicate the capability of the developed NIRS model. Generally, the values of RMSEC and RMSEP are better approaching to zero. The R values are suitable for most application models with values of 0.92–0.96 including quality control and those above 0.98 for all applications. PRESS and RMSECV were used to determine the optimum number of principal components. Usually, PRESS is plotted as a function of the number of PLS factors. When the PRESS value reaches minimum, its corresponding PLS factors is selected as the optimum one for a PLS quantitative model.
RESULTS AND DISCUSSION
Quantitative Analysis of HG, CA, AT, and ARC by HPLC Method
Figure 2 shows a typical HPLC-DAD chromatogram of crude Radix Scrophulariae extract solution and four mixed standard solutions. The HPLC method was validated by defining the linearity, limits of quantification and detection, identification and quantification of the analytes, repeatability, precision, stability, and recovery. Four calibration curves were constructed from peak areas of the reference standards versus their concentrations. All criteria for assessing the suitability of the system are listed in Table II. The calibration curves of four standards show good linearity (R2 > 0.9998), covering the range of quantification. These data demonstrated the suitability of this HPLC method for simultaneous quantification.
Fig. 2.

Typical HPLC-DAD chromatogram of a crude Radix Scrophulariae and b mixed standard solution
Table II.
The Methodology Parameters and the Calibration Plots of the Reference Method (n = 6)
| Compounds | t R (min) | Regression equation | R 2 | Linearity range (μg/mL) | LOD (μg/mL) | Repeatability RSD% | Recovery % |
|---|---|---|---|---|---|---|---|
| HG | 36.091 |

|
0.9999 | 2.55–30.60 | 0.05 | 1.13 | 99.39 |
| CA | 39.462 |

|
0.9999 | 3.44–41.25 | 0.09 | 1.21 | 99.75 |
| AT | 29.681 |

|
0.9999 | 6.78–81.45 | 0.16 | 0.92 | 99.75 |
| ARC | 32.196 |

|
0.9998 | 3.55–42.60 | 0.07 | 1.00 | 99.85 |
Spectral Analysis
PLS is a full-spectrum calibration method and all four NIRS models were based on it. Figure 3 shows the raw NIR spectra of 51 batches of crude Radix Scrophulariae over the 10,000–4,000 cm−1 range. Intensive spectral peaks of original spectra are mainly in the range of 7,400–4,000 cm−1. These are caused by the stretch and vibration of the C–H, N–H, and O–H groups that are the typical chemical groups of HG, CA, AT, and ARC. Therefore, the region of 8,000–4,000 cm−1 was selected for the PLS calibration model. The correlation coefficients of the spectra also verified the accuracy of band selection. Taking AT as an example, the correlogram of R and wave numbers (WN) is shown in Fig. 4, in which it can be clearly seen that the WN with higher coefficients (>0.5) are mainly distributed in the selected band region.
Fig. 3.
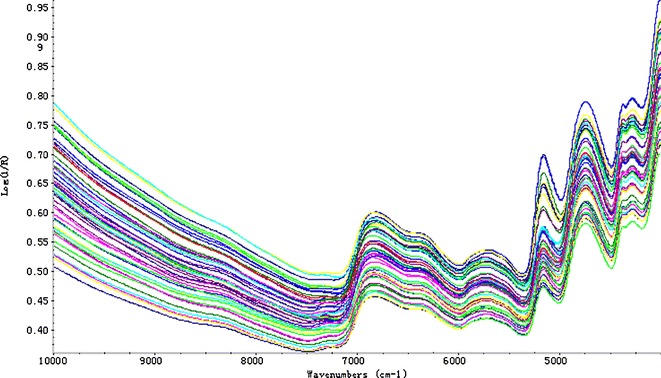
The original NIRS spectra of crude Radix Scrophulariae
Fig. 4.
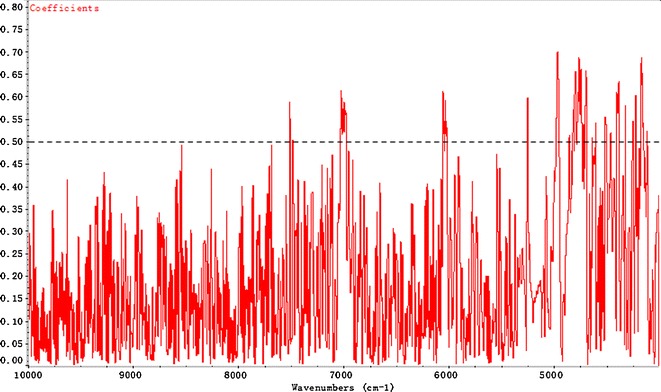
The correlogram of the NIR spectra and the AT concentrations
Calibration of NIRS Models
The integrating sphere module was adopted as the sampling technique based on diffusion reflection. MSC was used to correct the light scattering effects due to particle size distribution by adjusting the spectra based on ranges of wavelengths carrying no specific chemical information (15,16). Considering some influence factors like baseline shift, systematic noise, intense band overlapping, and difference between various samples (17), 1-Der and 2-Der are quite needed. Derivative processing was used to correct the baseline shift and reinforce spectral resolution. Meanwhile, smooth processing was also introduced to eliminate enhanced noise signals (18). Two classical smoothing techniques, SG filter and Norris derivative filter, were investigated and compared. Whether these processing methods qualified for the models or not are evaluated by R, RMSEC, RMSEP, and RMSECV. Taking AT as an example, the comparison of different methods was listed in Table III. After comparison of diverse spectra pretreatments, 2-Der with SG filter was demonstrated as an optimum pretreatment and its spectra were illustrated in Fig. 5. After pretreatment with 2-Der, there was no distinct change over the wavelength range of 10,000–7,400 cm−1 which mostly contains baseline information.
Table III.
The Impact of Different Pretreatment Methods on the Model
| Pretreatment methods | R | RMSEC | RMSEP | RMSECV |
|---|---|---|---|---|
| Original spectra | 0.943 | 0.0544 | 0.0527 | 0.0720 |
| 1-Der+no smoothing | 0.924 | 0.0629 | 0.0434 | 0.0823 |
| 1-Der+SG | 0.919 | 0.0647 | 0.0428 | 0.0824 |
| 1-Der+Norris | 0.867 | 0.0816 | 0.0520 | 0.0884 |
| 2-Der+no smoothing | 0.999 | 0.0018 | 0.0784 | 0.0500 |
| 2-Der+SG | 0.999 | 0.0089 | 0.0273 | 0.0236 |
| 2-Der+Norris | 0.960 | 0.0457 | 0.0435 | 0.0361 |
Fig. 5.
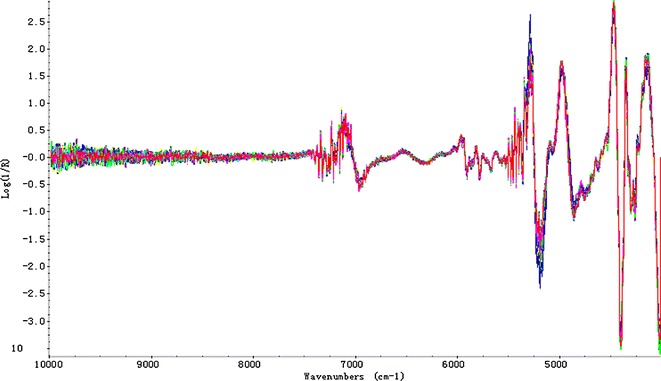
NIRS spectra pretreated with 2-Der
The number of PLS factors would significantly affect the precision of a quantitative model. An optimum choice should fully reflect the spectral changes resulting from the changes in the concentration of the measured components and exclude the spectral noise. The three-dimensional correlograms for factors, PRESS, and RMSECV were illustrated in Fig. 6. The optimal number of factors were 6, 2, 7, and 3 for HG, CA, AT, and ARC, respectively.
Fig. 6.
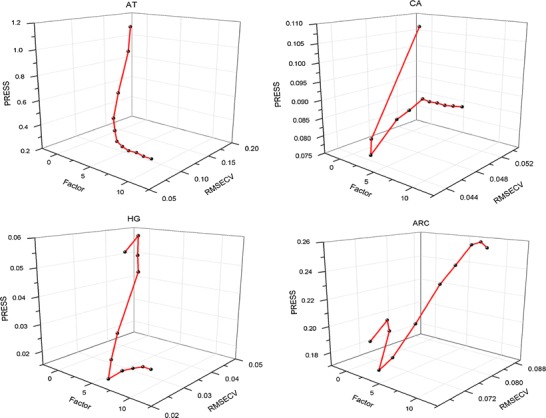
Correlogram of number of PLS factors and PRESS and RMSECV values for calibration models
Results of Calibration Model
Generally, RMSEC, RMSEP, RMSECV, and correlation coefficients (R) are used for evaluating an NIR model. RESEC, RESEP, and RMSECV close to 0 and R approaching to 1 indicate a robust model. Table IV shows the results of these four evaluating parameters as well as the corresponding number of PLS factors for each model. It can be concluded that the coefficients of determination are all above 0.96. RMSEC, RMSEP, and RMSECV are below 0.045, indicating a satisfactory correlation between the HPLC-calculated value and the model-predicted value.
Table IV.
The Results of RMSEC, RMSEP, RMSECV, and R of Four Quantitative Models
| Compounds | R | RMSEC | RMSEP | RMSECV | Factor |
|---|---|---|---|---|---|
| HG | 0.9670 | 0.0101 | 0.0225 | 0.0227 | 6 |
| CA | 0.9618 | 0.0141 | 0.0244 | 0.0442 | 2 |
| AT | 0.9985 | 0.0089 | 0.0273 | 0.0236 | 7 |
| ARC | 0.9613 | 0.0189 | 0.0219 | 0.0328 | 3 |
Figure 7 shows the correlogram between the actual reference values obtained by HPLC and NIRS-predicted concentration values. The results show a good linearity and suggest that the established models can be applied to the determination of main components in crude Radix Scrophulariae.
Fig. 7.
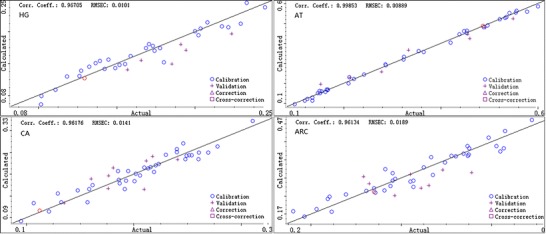
Correlation diagrams between the NIR-predicted values and the reference values of HG, CA, AT, and ARC concentrations
Validation of Developed NIRS Model
Four separate NIRS models for the quantification of HG, CA, AT, and ARC have been developed corresponding to their reference HPLC methods. To investigate their robustness, 10 batches of unknown crude Radix Scrophulariae have been picked up and analyzed by the models. The concentration results were compared with those analyzed by HPLC, showing good prediction accuracy with R exceeding 0.9. The correlations between measured values by HPLC and NIR prediction values for HG, CA, AT, and ARC were showed in Fig. 7. Tailed t test has also been applied to validate the results obtained by the HPLC and NIR methods. Taking HG as an example, the value of t is 0.927, less than t(0.05,9) = 2.262 with the significance level of 0.05 which convincingly indicates the accuracy of the established NIR models.
CONCLUSIONS
In this study, PLS-NIRS models have been developed for the simultaneous determination of the four main components, namely, HG, CA, ARC, and AT, in crude Radix Scrophulariae with HPLC-DAD analysis as reference method. The overall results proved the feasibility of quantification and quality control of TCM with shorter time and less pretreatment. Good and optimized models were established. This suggests that the major components in original TCM could be analyzed quickly and simultaneously without extraction. This technique could greatly accelerate the development of quantification methods and improve the efficacy of the chemical analysis of TCM especially in routine quality control of the herbs.
ACKNOWLEDGMENTS
The authors are grateful for the financial support of a project funded by the Priority Academic Program Development of Jiangsu Higher Education Institutions, PAPD(ysxk-2010) and the Open Project Program of National First-Class Key Discipline for Traditional Chinese Medicine of Nanjing University of Chinese Medicine (2011ZYX2-006) and National Natural Science Foundation of China (no. 30873438) and Science and technology of Chinese medicine of Zhejiang province (no. 2009CB008) and the fund of Zhejiang modernization of traditional Chinese medicine item ([2008]436) and Zhejiang Province Chinese medicine research program (2011ZB101) and Science Foundation of Zhejiang Chinese Medical University (7211093).
REFERENCES
- 1.Gu WL, Chen CX, Wu Q, Lü J, Liu Y, Zhang SJ. Effects of Chinese herb medicine Radix Scrophulariae on ventricular remodeling. Pharmazie. 2010;65:770–775. [PubMed] [Google Scholar]
- 2.Wu Q, Yuan Q, Liu EH, Qi LW, Bi ZM, Li P. Fragmentation study of iridoid glycosides and phenylpropanoid glycosides in Radix Scrophulariae by rapid resolution liquid chromatography with diode-array detection and electrospray ionization time-of-flight mass spectrometry. Biomed Chromatogr. 2010;24:808–819. doi: 10.1002/bmc.1368. [DOI] [PubMed] [Google Scholar]
- 3.Huang XY, Chen CX, Zhang XM, Liu Y, Wu XM, Li YM. Effects of ethanolic extract from Radix Scrophulariae on ventricular remodeling in rats. Phytomedicine. 2012;19:193–205. doi: 10.1016/j.phymed.2011.09.079. [DOI] [PubMed] [Google Scholar]
- 4.Park SU, Chae YA, Facchini PJ. Genetic transformation of the figwort, Scrophularia buergeriana Miq., an Oriental medicinal plant. Plant Cell Rep. 2003;21:1194–1198. doi: 10.1007/s00299-003-0639-0. [DOI] [PubMed] [Google Scholar]
- 5.Wang S, Zheng Z, Weng Y, Yu Y, Zhang D, Fan W, Dai R, Hu Z. Angiogenesis and anti-angiogenesis activity of Chinese medicinal herbal extracts. Life Sci. 2004;74:2467–2478. doi: 10.1016/j.lfs.2003.03.005. [DOI] [PubMed] [Google Scholar]
- 6.Zhang Y, Cao G, Ji JY, Cong XD, Wang SB, Cai BC. Simultaneous chemical fingerprinting and quantitative analysis of crude and processed Radix Scrophulariae from different locations in China by HPLC. J Sep Sci. 2011;34:1429–1436. doi: 10.1002/jssc.201100136. [DOI] [PubMed] [Google Scholar]
- 7.Jing J, Chan CO, Xu L, Jin D, Cao X, Mok DK, Parekh HS, Chen S. Development of an in-line HPLC fingerprint ion-trap mass spectrometric method for identification and quality control of Radix Scrophulariae. J Pharm Biomed Anal. 2011;56:830–835. doi: 10.1016/j.jpba.2011.07.032. [DOI] [PubMed] [Google Scholar]
- 8.Liang X, Zhang X, Dai WX, Lv YH, Yan SK, Zhang WD. A combined HPLC-PDA and HPLC-MS method for quantitative and qualitative analysis of 10 major constituents in the traditional Chinese medicine Zuo Gui Wan. J Pharm Biomed Anal. 2009;49:931–936. doi: 10.1016/j.jpba.2009.02.004. [DOI] [PubMed] [Google Scholar]
- 9.Li WL, Qu HB. Rapid quantification of phenolic acids in radix Salvia miltiorrhiza extract solutions by FT-NIR spectroscopy in transflective mode. J Pharm Biomed Anal. 2010;52:425–431. doi: 10.1016/j.jpba.2010.01.009. [DOI] [PubMed] [Google Scholar]
- 10.Lu HY, Wang SS, Cai R, Meng Y, Xie X, Zhao WJ. Rapid discrimination and quantification of alkaloids in Corydalis Tuber by near-infrared spectroscopy. J Pharm Biomed Anal. 2012;59:44–49. doi: 10.1016/j.jpba.2011.09.037. [DOI] [PubMed] [Google Scholar]
- 11.Wu ZS, Xu B, Du M, Sui CL, Shi XY, Qiao YJ. Validation of a NIR quantification method for the determination of chlorogenic acid in Lonicera japonica solution in ethanol precipitation process. J Pharm Biomed Anal. 2012;62:1–6. doi: 10.1016/j.jpba.2011.12.005. [DOI] [PubMed] [Google Scholar]
- 12.Chan CO, Chu CC, Mok DK, Chau FT. Analysis of berberine and total alkaloid content in cortex phellodendri by near infrared spectroscopy (NIRS) compared with high-performance liquid chromatography coupled with ultra-visible spectrometric detection. Anal Chim Acta. 2007;592:121–131. doi: 10.1016/j.aca.2007.04.016. [DOI] [PubMed] [Google Scholar]
- 13.Wang ZM, Xiang BR. Application of artificial neural network to determination of active principle ingredient in pharmaceutical quality control based on near infrared spectroscopy. Microchem J. 2008;89:52–57. doi: 10.1016/j.microc.2007.11.016. [DOI] [Google Scholar]
- 14.Lee DY, Kim SH, Kim YC, Kim HJ, Sung SH. Discrimination of Scrophulariae Radix according to geographical origin and determination of active constituents by near infrared spectroscopy (NIRS) Microchem J. 2011;99:213–217. doi: 10.1016/j.microc.2011.05.008. [DOI] [Google Scholar]
- 15.Liu YD, Sun XD, Ouyang AG. Nondestructive measurement of soluble solid content of navel orange fruit by visible–NIR spectrometric technique with PLSR and PCA-BPNN. LWT Food Sci Technol. 2010;43:602–607. doi: 10.1016/j.lwt.2009.10.008. [DOI] [Google Scholar]
- 16.Candolfi A, De Maesschalck R, Jouan-Rimbaud D, Hailey PA, Massart DL. The influence of data pre-processing in the pattern recognition of excipients near-infrared spectra. J Pharm Biomed Anal. 1999;21:115–132. doi: 10.1016/S0731-7085(99)00125-9. [DOI] [PubMed] [Google Scholar]
- 17.Zhao HH, Yan YL. The effects of noise on NIR analysis and related mathematic pretreatments and models. Spectrosc Spectr Anal. 2006;26:842–845. [PubMed] [Google Scholar]
- 18.Cen H, He Y. Theory and application of near infrared reflectance spectroscopy in determination of food quality. Trends Food Sci Technol. 2007;18:72–83. doi: 10.1016/j.tifs.2006.09.003. [DOI] [Google Scholar]


