

Abstract
A novel drug-in-adhesive matrix was designed and prepared. A thermoplastic elastomer, styrene–isoprene–styrene (SIS) block copolymer, in combination with tackifying resin and plasticizer, was employed to compose the matrix. Capsaicin was selected as the model drug. The drug percutaneous absorption, adhesion properties, and skin irritation were investigated. The results suggested that the diffusion through SIS matrix was the rate-limiting step of capsaicin percutaneous absorption. [SI] content in SIS and SIS proportions put important effects on drug penetration and adhesion properties. The chemical enhancers had strong interactions with the matrix and gave small effect on enhancement of drug skin permeation. The in vivo absorption of samples showed low drug plasma peaks and a steady and constant plasma level for a long period. These results suggested that the possible side effects of drug were attenuated, and the pharmacological effects were enhanced with an extended therapeutic period after application of SIS matrix. The significant differences in pharmacokinetic parameters produced by different formulations demonstrated the influences of SIS copolymer on drug penetrability. Furthermore, the result of skin toxicity test showed that no skin irritation occurred in guinea pig skin after transdermal administration of formulations.
Key words: adhesion, in vivo absorption, skin irritation, thermoplastic elastomer, transdermal drug delivery
INTRODUCTION
In the last decades, hot melt pressure-sensitive adhesives (HMPSA) attracted more and more attentions in transdermal drug delivery applications, especially in drug-in-adhesives (DIA) devices (1). Comparing with other types of pressure-sensitive adhesives (PSAs) such as polyisobutylene, silicones, and acrylics, they possess some superior characteristics such as better economics in production, more stable structure, and less medication/adhesive interactions.
Styrene–isoprene–styrene (SIS) block copolymers, in combination with tackifying resin and plasticizer, are the main compositions of HMPSA (2). SIS copolymer is a thermoplastic elastomer made of [SI] diblock and [SIS] triblock. The entanglement network structure of the copolymer is formed by the soft polyisoprene phase and the rigid polystyrene phase. This microphase-separated structure provides a specific viscoelastic behavior due to the variations of styrene/diblock and/or [SI]/[SIS] ratios (3).
The chemical and physical properties of SIS have been extensively investigated and characterized including adhesiveness (4), morphological, rheological properties (5–7), and thermodynamic behaviors (8,9). But the usage of this copolymer in transdermal device is sparingly reported (10). In our previous work (11), we prepared DIA patches based on SIS copolymer. The release behaviors of different drugs were evaluated. The results suggested that the SIS structure and formulation compositions significantly influenced the morphological and rheological properties of the patch, leading to a controllable drug release profile. But the skin permeation property and adhesion of the patch were not discussed in that paper.
In this article, drug skin permeation and PSA adhesion properties were further evaluated to correlate the performances of the PSA matrix with its structure and composition. Drug penetration study was conducted by Franz diffusion cells using rat skin (12). Capsaicin (8-methyl-N-vanillyl-6-nonenamide, CS) was chosen as a model drug because it is widely used in transdermal devices to treat various diseases (13). The chemical structure of CS was shown in Fig. 1. Tack force, shear adhesion, and peel strength were measured as the adhesion properties of matrix. The in vivo absorption was performed to evaluate the bioavailability of this transdermal device. Additionally, skin irritation test was carried out using guinea pigs to investigate the toxicity of the matrix.
Fig. 1.

Structure of capsaicin and p-phenylphenol
MATERIALS AND METHODS
Materials
The SIS block copolymer selected for this study included Kraton D1113, D1163, D1107 (Kraton, USA), and Zeon 3620 (Zeon, Japan). A synthetic hydrocarbon resin, Hikorez A 1100S (C-5, Kolon, Korea), was selected as the tackifying resin, and a liquid paraffin (LinFeng chemical Co. Ltd, Shanghai, China) was selected as the plasticizer. Antioxidant 1010 (3, 5-di-tert-butyl-4-hydroxyhydrocinnamate) was purchased from JiYi Chemical Co. Ltd (Beijing, China). Capsaicin was obtained from BangCheng Chemical Co. Ltd (Shanghai, China). Penetration enhancers including azone (AZ), l-menthol (MT), isopropyl myristate (IPM), 1, 2-propylene glycol (PG), and oleic acid (OA) were gifts from the National Pharmaceutical Engineering and Research Center of China. Acetonitrile (HPLC grade) and p-phenylphenol (Fig. 1) were purchased from Merck Co. Ltd (USA). Backing sheet of non-woven fabrics (200 μm, medical grade) and anti-stickiness liner (silicone-coated polyethylene terephthalate film, 50 μm) were supported by YiDong Co. Ltd (Shanghai, China). Methanol, isopropyl alcohol, and other chemicals and solvents were obtained from LinFeng Chemical Co. Ltd (Shanghai, China).
Method of Preparing DIA Matrix
Preparing HMPSA Matrix
Method of preparing HMPSA matrix has been described in detail in our previous work (11): The SIS block copolymer, C-5 hydrocarbon resin, liquid paraffin, and antioxidant were blended in a three-neck flask. The system was heated and maintained at 130°C. The blends were stirred at 500 rpm (IKA agitator) for 30 min until the PSA specimens became transparent. A dry nitrogen atmosphere was maintained during the whole producing process. In formulations, the amounts of C-5 resin and liquid paraffin were set at 3.0 and 6.0 g, respectively, in ratio of 1:2. The amount of SIS block copolymer was weighted in proportion according to the schedule listed in Table I.
Table I.
Formulations and Compositions of Samples
| Formulation | SIS copolymer | C-5 resin | Liquid paraffin | Penetration enhancer | |
|---|---|---|---|---|---|
| Trade name | Content (%) | Content (%) | Content (%) | ||
| F1 | D1107 | 39.0 | 19.5 | 39.0 | \ |
| F2 | D1163 | 39.0 | 19.5 | 39.0 | \ |
| F3 | D1113 | 39.0 | 19.5 | 39.0 | \ |
| F4 | 3620 | 39.0 | 19.5 | 39.0 | \ |
| F5 | 3620 | 58.5 | 13.0 | 26.0 | \ |
| F6 | 3620 | 48.7 | 16.3 | 32.6 | \ |
| F7 | 3620 | 29.3 | 22.7 | 45.5 | \ |
| F8 | 3620 | 24.4 | 24.4 | 48.7 | \ |
| F9 | 3620 | 27.7 | 21.6 | 43.2 | AZ |
| F10 | 3620 | 27.7 | 21.6 | 43.2 | MT |
| F11 | 3620 | 27.7 | 21.6 | 43.2 | IPM |
| F12 | 3620 | 27.7 | 21.6 | 43.2 | PG |
| F13 | 3620 | 27.7 | 21.6 | 43.2 | OA |
The concentrations of antioxidant 1010, capsaicin, and penetration enhancers in the formulations were set at 0.5%, 2%, and 5% (w/w), respectively
Preparing Drug-Loaded Matrix
A certain amount of capsaicin was accurately weighted and dissolved in ethanol in ratio of 1:2 (w/v). The drug solutions were then ultrasonically treated for 30 min to make the mixture homogeneous.
The drug-loaded matrix was prepared by a direct coating method (11): A certain amount of HMPSA matrix was heated to 90°C until it melted into liquid. Then, certain volume of penetration enhancer and/or drug solution was added into the adhesive solution and mixed thoroughly. The resulting drug-PSA specimens were then quickly melt-coated onto the backing sheet using a film applicator (HongWei Trading Co., Guangzhou, China). After solidified, an anti-stickiness liner was placed onto the sample surface.
Determination of Initial Drug Amount in the PSA Matrix
The matrix was accurately cut into a certain area and immersed into 15 ml methanol with a reflux extraction for 3 h. The drug extraction solution was filtered through a filter membrane with a pore size of 0.45 μm (Millex ® GV, Millipore, USA) before chromatograph analysis.
Evaluation of Drug State in Matrix
Differential Scanning Calorimetry
The differential scanning calorimetry (DSC) thermograms of pure drug, blank matrix, and drug-loaded matrix were recorded by a thermogravimetric analyzer (DSC 200 PC Phox®, German). A certain amount of sample (10–15 mg) was placed in a sealed aluminum pan and heated at a heating rate of 10°C/min in the range of 25°C to 200°C. A nitrogen atmosphere at a flow rate of 80 ml/min was maintained during the whole process.
X-Ray Diffractometry
Crystal states of drugs in matrix were evaluated by wide-angle X-ray diffraction (XRD) using a Rigaku (Japan) D/max 2250 VB/PC X-diffractometer. All the samples were measured at 100 mA and 40 KV with the scan range of 3–50° and the scan interval of 0.02°.
Evaluations of Adhesion Properties
Tack Force
The measurement of tack force was carried out using auto tensile tester (Kaka Technologies Ltd, Shanghai, China) equipped with a probe and a tension sensor. Samples were attached to a stainless steel probe with a diameter of 2.5 cm. The contact force was 5 N, and the contact time was 2 s. After the contact of the probe with the adhesive layer, probe moved back at a rate of 300 mm/min, and the maximum force was recorded. Each sample was reduplicate tested for three times. Tack force was calculated using the equation given below, where A is the contact area.
 |
1 |
Shear Adhesion
Shear adhesion test was carried out using a CZY-S lasting adhesive tester (Languang M&E Tech Development Center, Jinan, China). After removal of the anti-stickiness liner, samples were cut into 8 × 5 cm2, applied to a stainless steel test panel, and smoothened thrice with a 2-kg roller. Then, the whole system was hung vertically and subjected to a shearing force by means of a given weight (1,000 g) suspended from the panel. The time for the sample detaching from the test panel was recorded as the value of the shear strength.
Peel Strength
One hundred eighty degree peel adhesion test method was adopted to measure the peel strength. Samples were cut into 2.5 × 15 cm2, applied to an adherent plate made of Bakelite, smoothened thrice with a 2-kg roller, and pulled from the substrate at 180° angle at a constant rate of 300 mm/min. The average force during the peel process was recorded, and the peel strength was calculated using the following equation:
 |
2 |
Where peel force represented the average force of the peeling process, and width represented the width of the PSA sample (2.5 cm).
Evaluations of Skin Penetration Properties
In Vitro
Male Wistar rats (180–220 g, 6–8 weeks old) used in all experiments were supplied by the SLAC Laboratory Animal Co. Ltd (Shanghai, China). The experiments were performed in accordance with the International Guiding Principles for Biomedical Research Involving Animals developed by the Council for International Organizations of Medical Sciences. The rats were anesthetized with urethane (20%), and the abdomen was carefully shaved with a razor after removal of hair by electric clippers. After sacrificing the rats by dislocating the spinal cord, full thickness skin (i.e., epidermis with stratum corneum and dermis) was excised from the shaved abdominal site. The skin integrity was carefully ascertained by microscope observation, and any skin that had low uniformity was rejected. The sub-dermal tissues were surgically removed, and the dermal side was wiped with isopropyl alcohol to remove adhering fat. Then, the skin was washed with phosphate-buffered saline, wrapped in aluminum foil, and stored at −20°C (used within 1 week of preparation). Before starting the experiments, the skin samples were allowed to reach room temperature. This skin preparation procedure was performed in accordance with a previous report (14).
Penetration profiles were evaluated by drug transdermal diffusion apparatus (KaKa TD-120, KaKa, Shanghai, China) equipped with Franz cells. Skins were mounted on Franz cells with stratum corneum (SC) on the top side. PSA samples were applied on the skin completely covering the exposed skin area (3.14 cm2). The receptor compartment contained 17.5 ml of phosphate buffer solution (pH 7.4) with 10% ethanol to increase drug solubility (15) and preserve the skin from damage. The receiver compartment was stirred at a constant speed of 200 rpm. The whole penetration process was conducted at 37.5°C. At 1, 2, 3, 4, 6, 8, 10, 12, and 24 h, 1.0 ml of the receptor solution was withdrawn from the cell, and the aliquot of fresh receptor solution was added to keep the volume constant. Sink conditions were maintained throughout the experiment. For each formulation, penetration experiments were duplicated six times.
In Vivo
Eighteen male Wistar rats (200–240 g, 8–10 weeks old) were used in this study. Before administration, rats were fasted overnight but were allowed access to water. The animals were divided into three equal groups, and weights of animals were measured and recorded before experiment. Stock solution of capsaicin (5 mg/ml) for intravenous administration was prepared by dissolving capsaicin in 0.9% normal saline solution with 10% ethanol and 10% Tween 80 (16). The rats in group A were given an intravenous administration of capsaicin (160 μg/kg) via the tail vein. Groups B and C were given transdermal application of drug-loaded matrix. On the day before the start of the experiment, the test areas on the abdominal site of rats were carefully shaved without skin damage. A sample containing 2.7 mg (dosage, 12.3 mg/kg) drug with an area of 3 × 3 cm2 was applied to the shaved skin and removed after an interval of 60 h. The animals in group B were treated with F2 as control group, while the animals in group C were treated with the formulation with the maximum skin penetrability.
Blood samples of 0.5 ml were collected from the retro-orbital plexus of rats into dried heparinized tubes at 3, 4.5, 6, 9, 12, 15, 20, 30, 45, 60, 90, and 120 min after intravenous administration and 1, 2, 4, 6, 12, 24, 30, 36, 48, 60 h after transdermal administration. Plasma samples were separated immediately by centrifugation at 3,000 rpm for 10 min, and stored at −20°C until analysis.
Analytical Methods
In Vitro
Samples in vitro were identified and quantified directly using an Agilent 1100 automated chromatograph fitted with a 5-μm C18 250 × 4.6-mm column (Capcell Pak, Shiseido, Japan). The mobile phase comprised of 52% acetonitrile (HPLC grade, Merck & Co., Inc, USA) and 48% phosphoric acid solution (0.1%, v/v). The UV detector was set at 280 nm. The injection volume was 10 μl, and the flow rate was 1.0 ml min−1.
In Vivo
Plasma sample (0.3 ml) was pipetted into a 2-ml centrifuge tube. Ten microliters of p-phenylphenol solution (5.0 μg/ml) was added into the centrifuge tube as internal standard and vaporized in advance (16). The plasma sample was extracted with 1.5 ml chloroform followed by mechanical shaking for 30 min. After centrifugation for 20 min at 10,000 rpm, 1.2 ml chloroform phase was transferred to another tube and evaporated to dryness by compressed nitrogen. The residue was then redissolved in 50 μl methanol (HPLC grade); 10 μl aliquot of this solution was injected into the HPLC directly. The analytical progress was performed under the same situation with in vitro studies.
HPLC methods were previously validated, including sensitivity, precision, accuracy, and stability. For in vivo study, standard curve was prepared following the same operation method of plasma samples. Under the experimental condition described above, the limit of detection (S/N = 3) and limit of quantification were 4.5 and 13.9 ng/ml, respectively. Both in vitro and in vivo evaluations showed good linear relationships between drug concentrations and peak areas. Samples in vivo were diluted prior to mixing with internal standard if needed.
Statistical Analysis
In Vitro Data Analysis
The cumulative amount of capsaicin (micrograms per centimeter) penetrated through the skin at each collection time was plotted against time (hours). Linear regression of the steady-state portion of the curve was used to estimate drug flux (J). The enhancement ratio (ER) was determined using the following equation:
 |
3 |
Statistical significance was checked by Student’s t test and considered to be granted at P < 0.05, unless otherwise indicated.
In Vivo Pharmacokinetic Analysis
Pharmacokinetic (PK) parameters, such as Cmax (the maximal plasma drug concentration) and Tmax (time to maximal plasma drug concentration), were read directly from the individual plasma concentration–time profiles. The other PK parameters, such as AUC0-∞ (area under the time concentration curve from time 0 to ∞), T1/2 (the half-life of elimination from plasma), and mean residence time (MRT), were calculated by non-compartmental analyses using PKSolver, an add-in program for pharmacokinetic analysis in Microsoft Excel (17). Absolute bioavailability (F) was calculated from the following equation:
 |
4 |
Skin Irritation Test
Eighteen male guinea pigs (300–450 g) were used in skin irritation test (18). The animals were divided into three groups randomly. Group A received normal saline solution (negative control), group B received drug-free PSA matrix, while group C was treated with drug-loaded formulation. Twenty-four hours prior to the first application, the dorsal skins of animals were shaved carefully. On the first day of the study, 1 ml saline solution or a PSA matrix (3 × 3 cm2) was applied on the back of the animal. Samples were given at a 12-h interval and lasted for 1 week. The treatment sites were covered with sterile gauze and secured with surgical tape to prevent falling off of the samples from the skin (19). The application sites were observed visually every day. At the end of the last administration, the animals were sacrificed. The skins at the test site were excised and stored in 10% formalin solution in phosphate-buffered saline (pH 7.4) before embedding in paraffin for fixing. Sections of 3–5-μm thickness skins were cut for histopathological examination under light microscope (Leica, Germany). Epidermal liquefaction and edema of collagen fiber in dermis and/or hypodermis were examined.
RESULT AND DISCUSSION
Preparation and Characterization of PSA Matrix
Different formulations (Table I) were prepared. For all the formulations, drug concentration was examined and controlled. The weight of the PSA matrix (excluding the weights of backing sheet and anti-stickiness liner) was 14.8 ± 0.6 mg/cm2. The amount of the drug was fixed at 294 ± 14 μg/cm2. The thickness of matrix was measured by a micrometer and calculated by subtracting the combined thickness of backing sheet and anti-stickiness liner from the thickness of the whole matrix. The thickness of all the samples was controlled at 100 ± 8 μm.
The solubility of capsaicin in the matrix is very low, as we investigated previously (11). Hence, ethanol was used as the solvent. In producing process, capsaicin was first dissolved in ethanol, and then the drug solution was dispersed thoroughly into the matrix, as described above. The compatibility of capsaicin with PSA matrix was evaluated by XRD and DSC as depicted in Fig. 2. Since both XRD and DSC results showed no characteristic peaks in the curves of drug-loaded matrix, it can be inferred that capsaicin was dispersed well in PSA matrix as no crystallizations occurred in drug-loaded matrix when drug concentration reached 2% (20).
Fig. 2.
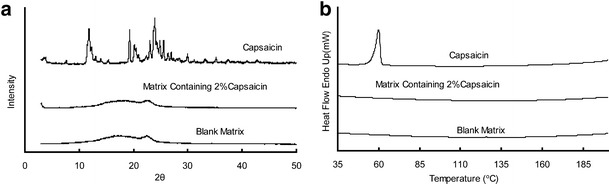
XRD (a) and DSC (b) analysis of capsaicin, blank matrix, and drug-loaded matrix. All matrices were prepared in the formulation of F2
In Vitro Evaluation
In DIA patches, PSA matrix provides several functions, including skin adhesion, drug reservoir, controlling drug/enhancer delivery rate, and governing their partitioning into the SC (21). In our present work, formulations with different compositions were prepared and evaluated to explore the correlations between compositions of the SIS matrix and its performances.
Effect of SIS Copolymer Structure
The weight average molecular weight, the number average molecular weight, and the molecular weight distribution of the SIS copolymers were determined in our previous work (11). The results suggested no significant differences existed for all the copolymers. The styrene/isoprene ratios were 15/85 for D1107, D1163, 3620, and 16/84 for D1113, respectively. The diblock proportions increased in the order of D1107 (15%) < D1163 (38%) < D1113 (56%) < 3620 (78%).
Samples of F1–F4 were prepared with different kinds of SIS copolymer. The skin permeation profiles and adhesive properties were investigated as shown in Table II. Steady and continuous permeation profiles from all the samples were observed (Fig. 3), implying a uniform and constant release behavior of capsaicin in the PSA matrix (21). It was interesting to find that there was no obvious lag time in the drug penetration profile, which was attributed to the high diffusion rate of capsaicin in the skin (22).
Table II.
Effect of SIS Structure on Drug Penetration and Matrix Adhesion Properties
| Formulation | J (μg/cm2/h)a | Q 24 (μg/cm2)a | R 2 | Tack force (N/cm2)b | Peel strength (N/cm)b | Shear adhesion (h)b |
|---|---|---|---|---|---|---|
| F1 | 1.89 ± 0.38 | 39.86 ± 5.70 | 0.9934 | 2.67 ± 0.25 | 1.61 ± 0.13 | 10.21 ± 2.41 |
| F2 | 2.77 ± 0.40 | 49.79 ± 6.07 | 0.9881 | 2.70 ± 0.17 | 1.53 ± 0.19 | 7.72 ± 3.88 |
| F3 | 3.11 ± 0.19 | 61.98 ± 5.73 | 0.9835 | 2.74 ± 0.19 | 1.63 ± 0.25 | 6.33 ± 1.63 |
| F4 | 4.18 ± 0.22 | 86.31 ± 5.99 | 0.9924 | 2.76 ± 0.14 | 1.59 ± 0.14 | 6.08 ± 1.02 |
aThe data are presented as mean ± SD, n = 6
bThe data are presented as mean ± SD, n = 3
Fig. 3.
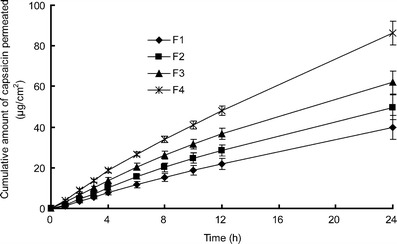
In vitro skin permeation profiles of capsaicin from PSA matrix with different SIS structures. Each data represents mean ± SD of six determinations (n = 6)
F1 gave the lowest value of steady flux and accumulative amount (J = 1.89 ± 0.38 μg/cm2/h, Q24 = 39.86 ± 5.70 μg/cm2). On the contrary, F4 showed the highest skin penetration ability (J = 4.18 ± 0.22 μg/cm2/h and Q24 = 86.31 ± 5.99 μg/cm2), followed by F3 and F2. It was depicted in Fig. 4a that the drug penetration flux was improved by the increased [SI] content but inversely proportional to styrene/diblock ratio (Fig. 4b). Since capsaicin could be easily penetrated into the deeper layer of the skin (23), the diffusion rate through matrix was the rate-limiting step controlling drug percutaneous absorption (24). [SI] content and styrene/diblock ratio, which were the structure parameters of SIS copolymer, had a direct correlation with drug release behavior (11). Higher content of [SI], together with lower styrene/diblock ratio, provided the copolymer with a more homogeneous microstructure, reflected by a softer matrix with lower storage modulus and viscosity. Consequently, the softer matrix facilitated the drug distribution from PSA to the skin surface by increasing the diffusion rate in matrix. Guy (25) indicated that the surface concentration of drug in contact with skin was an important factor influencing drug penetration. Since high drug concentration gradient between the skin surface and the receptor compartment resulted in a significant permeation enhancement, F4 presented the maximum skin penetrability of all (P < 0.05).
Fig. 4.
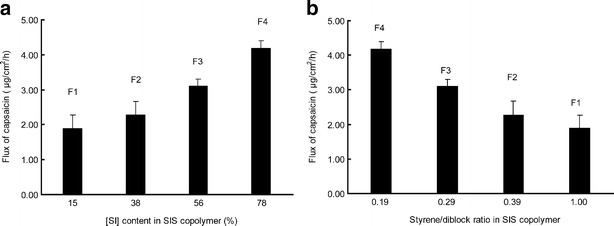
a Effect of [SI] proportion on capsaicin skin permeation. b Effect of styrene/diblock ratio on capsaicin skin permeation. Each data represents mean ± SD of six determinations (n = 6)
Furthermore, the adhesion properties were also evaluated as listed in Table II. Skin is the best material to serve as substrate in the adhesion test because it can provide reasonable and reliable data of adhesive properties. However, the required size and integrity of skin samples for tests could hardly be achieved for the limitation of our lab. Hence, stainless steel was used as the substrate in tack force and shear strength test, which was widely accepted before (20,26,27). Additionally, in peel strength test, Bakelite was used as a substrate, which was deemed to be similar to skin.
Adhesion is not an inherent property of SIS copolymer but a response to the combined effects of tackifying resin and plasticizer (2), as well as the substrate used in the test (4). Because the amounts of plasticizer and tackifying resin were kept constant in formulations, tack force and peel strength among F1 to F4 exhibited no significant differences (P > 0.05) from each other. But regarding the shear adhesion, the formulations were ranked as F1 > F2 > F3 > F4 with F4 being significantly lower than F1 (P < 0.05). Shear adhesion refers to the cohesive strength of the matrix (28). The block copolymer with more soft [SI] fractions gave a lower value of cohesive strength (11), resulting in a short time of shear adhesion. Although lower than other samples, the shear adhesion time of F4 was far beyond the standard level, as reported previously (26,27).
Effect of SIS Copolymer Proportion
Formulations of F4–F8 were prepared with the same type of SIS copolymer but different in SIS proportion. The proportions of tackifying resin and plasticizer were kept in a ratio of 1:2 as listed in Table I. The skin permeation experiments and adhesive tests of these formulations were performed. The obtained results were shown in Table III and Fig. 5.
Table III.
Effect of SIS Proportion on Drug Penetration and Matrix Adhesion Properties
| Formulation | J (μg/cm2/h)a | Q 24 (μg/cm2)a | R 2 | Tack force (N/cm2)b | Peel strength (N/cm)b | Shear adhesion (h)b |
|---|---|---|---|---|---|---|
| F4 | 4.18 ± 0.22 | 86.31 ± 5.99 | 0.9924 | 2.76 ± 0.14 | 1.59 ± 0.14 | 6.08 ± 1.02 |
| F5 | 2.08 ± 0.15 | 50.15 ± 3.86 | 0.9938 | 0.31 ± 0.09 | 0.53 ± 0.11 | 13.16 ± 4.01 |
| F6 | 2.67 ± 0.13 | 63.44 ± 3.72 | 0.9985 | 0.79 ± 0.20 | 0.77 ± 0.08 | 8.72 ± 2.88 |
| F7 | 4.70 ± 0.27 | 100.99 ± 7.56 | 0.9892 | 3.31 ± 0.23 | 1.34 ± 0.12 | 2.77 ± 0.73 |
| F8 | / | / | / | 3.94 ± 0.36 | Cohesive failure | 0.31 ± 0.11 (Cohesive failure) |
aThe data are presented as mean ± SD, n = 6
bThe data are presented as mean ± SD, n = 3
Fig. 5.

a In vitro skin permeation profiles of capsaicin from PSA matrix with different SIS proportions. b Effect of SIS proportion on capsaicin skin permeation. Each data represents mean ± SD of six determinations (n = 6)
F5 exhibited the lowest skin penetrability. The 24-h cumulative permeated amount of capsaicin was only 50.15 ± 3.86 μg/cm2, whereas the values for F6 and F7 were 63.44 ± 3.72 and 100.99 ± 7.56 μg/cm2, respectively. For F7, both flux and permeated amount were twofold greater than that of F5 (P < 0.05). Taking the composition of these formulations into consideration, we found that the skin penetrability was inversely proportional to SIS copolymer content in matrix, as depicted in Fig. 5b. The drug diffusion mechanism can help to explain this phenomenon (11): the block copolymer provides an entanglement network structure and a viscoelastic solid behavior for the PSA (2). This entanglement structure can be diluted by the low molecular weight components such as tackifying resin and plasticizer, resulting in a weakened cohesive strength and a low viscosity. Since the free volume of the network was expanded with reduction of SIS proportion, the drug diffusion rate significantly increased, reflected by an improvement on drug percutaneous absorption.
Furthermore, adhesion evaluations were also performed and listed in Table III. Tack is a low rate process where the adhesive should be able to flow sufficiently to promote intimate contact between itself and the skin (29). In our formulations, it depended on the proportions of tackifying resin and plasticizer. Hence, F5 showed the minimum tack value of 0.31 ± 0.09 N/cm2, while F8 gave the maximum of 3.94 ± 0.36 N/cm2 (P < 0.05). Peeling is a high rate process where the adhesive should be solid-like (29). It relates to the cohesive strength and the adhesiveness of the substance (4). In our work, peel strength was enhanced by tackifying resin but weakened by plasticizer (2). The two inner-restrained factors produced a maximum value of peel strength as SIS proportion reached 39% (F4, 1.59 ± 0.14 N/cm). This result was supported by Poh and his coworkers (30). Shear adhesion time was ranked as F5 > F6 > F4 > F7 with F7 being significantly lower than F5 (P < 0.05), as a response to the decreasing of SIS proportion in formulations. Additionally, the proportion of SIS should maintain in a certain range with regard to adhesion properties. F8, which had the lowest SIS proportion, was failed to afford the required physical strength in adhesion tests due to the cohesive failure. This formulation had the poor performance in shear adhesion (0.31 ± 0.11 h), which was significantly lower than the others (P < 0.05). Similarly, it left residues on the substrate in peel strength test, as a response to the loss of cohesive energy (31). Therefore, the SIS proportion in PSA matrix should be kept in a certain range, although lower SIS proportion is related to higher drug diffusion rate.
Effect of Penetration Enhancers
Chemical penetration enhancers are usually incorporated in the transdermal formulations to improve the drug skin permeation. It was reported that the physicochemical characteristics of the enhancers, such as molar volume, polarity, functional group, as well as viscosity, influenced the properties of PSA matrix (32,33). Hence, it was important to evaluate the interactions between the enhancers and the PSA matrix. F7 was selected as the control sample. Several penetration enhancers, including AZ, MT, IPM, PG, and OA, were employed to evaluate the effects of the penetration enhancers on PSA matrix properties (Table I). The concentration of all the enhancers was fixed at 5% as suggested by the literature (14).The percutaneous absorption data were summarized in Table IV and shown in Fig. 6. A maximum permeation enhancement was observed when MT was incorporated into the formulation (F10), and the minimum was obtained with OA (F13).
Table IV.
Effect of Penetration Enhancer on Drug Penetration and Matrix Adhesion Properties
| Formulation | J (μg/cm2/h)a | Q 24 (μg/cm2)a | ER | R 2 | Tack force (N/cm2)b | Peel strength (N/cm)b | Shear adhesion (h)b |
|---|---|---|---|---|---|---|---|
| F7 (control) | 4.70 ± 0.27 | 100.99 ± 7.56 | 1 | 0.9892 | 3.31 ± 0.23 | 1.34 ± 0.12 | 2.77 ± 0.73 |
| F9 (AZ) | 6.21 ± 0.51 | 119.88 ± 8.25 | 1.32 | 0.9801 | 3.07 ± 0.13 | 1.03 ± 0.19 | 2.08 ± 1.02 |
| F10 (MT) | 7.17 ± 0.59 | 148.26 ± 8.30 | 1.53 | 0.9908 | 3.16 ± 0.09 | 1.15 ± 0.10 | 2.55 ± 0.61 |
| F11 (IPM) | 6.63 ± 0.47 | 124.37 ± 10.70 | 1.41 | 0.9688 | 2.97 ± 0.21 | 1.19 ± 0.17 | 1.92 ± 0.44 |
| F12 (PG) | 6.31 ± 0.35 | 121.72 ± 8.84 | 1.34 | 0.9813 | 2.76 ± 0.16 | 1.01 ± 0.09 | 1.89 ± 0.86 |
| F13 (OA) | 5.37 ± 0.58 | 105.98 ± 8.73 | 1.14 | 0.9835 | 1.70 ± 0.12 | 0.46 ± 0.07 | 0.92 ± 0.30 |
aThe data are presented as mean ± SD, n = 6
bThe data are presented as mean ± SD, n = 3
Fig. 6.

a In vitro skin permeation profiles of capsaicin form PSA matrix containing different chemical enhancers. b Effect of chemical enhancers on capsaicin percutaneous absorption. Each data represents mean ± SD of six determinations (n = 6)
These permeation enhancers can have several modes on penetration enhancement, i.e., by changing thermodynamic activity of drug, such as PG, or by improving skin/vehicle partition coefficient, such as MT, or by altering the lipid properties of SC, such as AZ, OA, and IPM (34). Although MT gave the highest enhancement of capsaicin, the observed ER values were not as expectable as compared with early studies (27). On one hand, capsaicin is a naturally occurring alkaloid with high lipophilic property. It has high skin penetration ability as it can directly penetrate through the SC, which is mainly composed of lipid (15). Besides this, capsaicin itself can act as a skin permeation enhancer because of the similarity of chemical structure to AZ (35). Hence, the enhancers which exerted influence on SC properties could only produce limited enhancements on skin penetration of capsaicin. On the other hand, the relatively low ER values (Table IV) might be attributed to a strong interaction between these enhancers and PSA matrix (36). The liquid paraffin, acting as the solvent, can dissolve all of the enhancers. After solidified in production, the PSA-enhancer specimens formed a stable matrix. The penetration enhancers were firmly combined with PSA matrix. Hence, their enhancement effects were also negatively affected.
The effects of penetration enhancers on adhesion properties were investigated and listed in Table IV. All the formulations showed weakened adhesion properties in different extent, as compared with the control sample. IPM, PG, and OA significantly affected adhesion performances of tack and shear (P < 0.05), while AZ and MT showed slight decreases without statistical differences (P > 0.05). The results of peel test suggested that all the enhancers reduced the peel strength significantly (P < 0.05). Chemical enhancers are usually low molecular weight compounds. After added into the formulation, they weakened the cohesive strength and diluted the PSA matrix, as reflected by the reduction in adhesion properties (20).
In Vivo Evaluations
For in vivo analysis, the retention times were found to be 8.2 and 10.4 min for internal standard and capsaicin, respectively. A clear separation between drug and internal standard was observed. The extraction efficiency was 85.21 ± 3.66% for capsaicin.
The mean whole plasma concentration–time profiles after intravenous administration in rats were given in Fig. 7. The PK parameters were calculated using a non-compartmental model and listed in Table V. After intravenous administration of 160 μg/kg capsaicin for 3 min, the plasma drug concentration reached a peak at 876.87 ± 136.20 ng/ml. The plasma concentration was too low to be detected in plasma after 1 h with a short T1/2 of 0.40 ± 0.11 h, which indicated a rapid elimination of capsaicin by intravenous administration, as reported previously (16).
Fig. 7.
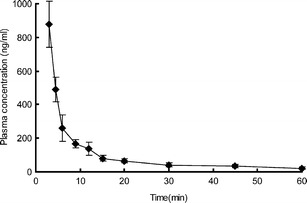
In vivo absorption of capsaicin in rats after intravenous administration. Each data represents mean ± SD of six determinations (n = 6)
Table V.
Main Pharmacokinetic Parameters of Capsaicin in Rats After Intravenous Injection and Transdermal Application of Samples F2 and F10 (mean ± SD, n = 6)
| Parameters | Intravenous | Transdermal | |
|---|---|---|---|
| F2 | F10 | ||
| Dose (mg/kg) | 0.16 | 12.3 | 12.3 |
| T max (h) | 0.05 | 12 | 12 |
| C max (ng/ml) | 876.87 ± 136.20 | 71.80 ± 14.36 | 106.24 ± 22.90 |
| T 1/2 (h) | 0.40 ± 0.11 | 8.39 ± 0.72 | 9.49 ± 0.65 |
| AUC0-∞ (ng h/ml) | 187.95 ± 31.78 | 2437.14 ± 162.41 | 4203.60 ± 349.63 |
| MRT (h) | 0.23 ± 0.06 | 24.62 ± 1.37 | 25.38 ± 1.45 |
| F (%) | / | 16.87 | 29.08 |
Since F10 provided the maximum permeation amount and suitable adhesiveness among the formulations, it was selected to perform the in vivo experiment. Furthermore, to evaluate the effects of PSA matrix and permeation enhancers on in vivo absorption, F2 was also employed in the study as a control sample because it possessed a fully different PSA composition and gave a much lower permeation amount of capsaicin when compared with F10. The PK parameters after transdermal application were also presented in Table V. The in vivo absorption showed a good correlation with in vitro permeation, as shown in Fig. 8. The drug plasma concentrations reached a platform at 6 h due to the fast drug diffusion rate in the skin without lag time. Concentration then maintained at a steady level for a long period before reduced gradually. The plasma concentrations were too low to be detected at 60 h for F10 and 48 h for F2, respectively. The steady levels of drug plasma concentrations from 6 to 24 h were attributed to the sustained skin permeation rate (Table VI). After 24 h, the permeation rate slowed down gradually, which accounted for the reduction in drug plasma concentration (Table VI). When comparing the transdermal application with intravenous injection, larger AUC and MRT values were achieved with increasing of apparent T1/2 values (P < 0.05), as shown in Table V. However, the Cmax were evidently reduced (P < 0.05). The results suggested that the possible side effects were attenuated due to the lower Cmax (37), while the pharmacological effects were enhanced with extended therapeutic periods. After dose normalization, the absolute bioavailabilities of transdermal administration were 29.08% for F10 and 16.87% for F2, respectively. By comparing the PK values between F10 and F2, significant differences were observed (P < 0.05). These findings further supported the conclusion that the structure and formulation of PSA matrix were important factors influencing drug skin penetration.
Fig. 8.

Transdermal administration of F2 and F10 in rats: a in vitro absorption, b in vivo absorption. Each data represents mean ± SD of six determinations (n = 6)
Table VI.
Steady Flux of In Vitro Percutaneous Absorption of Capsaicin (mean ± SD, n = 6)
| J 0-24h (μg/cm2/h) | R 2 | J 24-48h (μg/cm2/h) | R 2 | J 48-60h (μg/cm2/h) | R 2 | |
|---|---|---|---|---|---|---|
| F2 | 2.77 ± 0.40 | 0.9881 | 1.18 ± 0.12 | 0.9802 | 0.57 ± 0.04 | 0.9860 |
| F10 | 7.17 ± 0.59 | 0.9908 | 2.42 ± 0.05 | 0.9843 | 0.76 ± 0.12 | 0.9446 |
Fang and his coworkers evaluated the in vivo absorption of a capsaicin ointment (16). According to their report, the plasma–time profile after application of ointment bases (0.35%, w/w) was up to 14 h with AUC value of 0.85 μg h/ml and the absolute bioavailability of 27.33%. In our work, when drug was loaded in the SIS type matrix instead of the ointment, larger AUC values were achieved, corresponding to a prolonged therapeutic period. It can be attributed to two aspects. First, the stable matrix provided a constant and controlled release behavior, as reflected by the extended plasma–time profile. Second, the good bioadhesion of PSA to skin, which was better than ointment form, extended the application time and improved permeation efficacy (38).
Skin Irritation Test
It was reported that topical application of capsaicin in a high concentration might cause marked vasodilatation and produce skin erythema (38) in some extent. Additionally, the skin toxicity of PSA matrix based on SIS copolymer was rarely reported before. Hence, skin irritation potential of the formulations with/without drugs was carried out by preliminary histopathological evaluation. Guinea pigs were used as model animals and divided into three groups. Morphologies of skin samples after treatments were shown in Fig. 9. No histopathological findings were observed in both the epidermal and the dermal layers of the skin biopsies derived from the animals of group A (Fig. 9a, b). After a 7-day administration of samples, there was a slight swelling of the subepidermal layer for the animals of group B (F7 without drug loaded in) and group C (F10). Nevertheless, there were no obvious edema and tissue necrosis, as well as inflammatory cell infiltration observed in group B (Fig. 9c, d), which implied a good biocompatibility between the PSA and skin. Similarly, the histopathological examination results of group C (Fig. 9e, f) showed no obvious pathological changes compared with group A. These results indicated that no skin irritations were induced after transdermal administration.
Fig. 9.

Micrographs of guinea pig skin sections treated with: a and b, group A: normal saline solution. c and d, group B: blank PSA matrix; e and f, group C: capsaicin-loaded PSA matrix
CONCLUSION
The results of this work suggested that the SIS block copolymer was suitable to use in the DIA matrix. The matrix offered a steady and constant skin penetration rate and an adequate skin adhesion. The drug penetrability and the adhesion properties can be controlled both by the SIS structure and the composition of formulations. The PK parameters obtained in the in vivo absorption suggested that the possible side effects of loaded drugs would be attenuated, and the pharmacological effects would be enhanced with extended therapeutic periods as compared with intravenous and ointment administration. The differences between F2 and F10 further demonstrated the effects of PSA formulation on drug percutaneous absorption. The skin toxicity test indicated that no irritant skin reactions were induced after transdermal application of PSA matrix.
ACKNOWLEDGMENTS
This research was supported by the National Science and Technology Key Program for the 11th Five-Year Plan of China (2008BAI53B075).
REFERENCES
- 1.Webster I. Recent developments in pressure-sensitive adhesives for medical applications. Int J Adhes Adhes. 1997;17:69–73. doi: 10.1016/S0143-7496(96)00024-3. [DOI] [Google Scholar]
- 2.Galán C, Sierra CA, Gómez Fatou JM, Delgado JA. A hot-melt pressure-sensitive adhesive based on styrene–butadiene–styrene rubber: the effect of adhesive composition on the properties. J Appl Polym Sci. 1996;62:1263–1275. doi: 10.1002/(SICI)1097-4628(19961121)62:8<1263::AID-APP17>3.0.CO;2-8. [DOI] [Google Scholar]
- 3.Nazhat SN, Parker S, Patel MP. Isoprene–styrene copolymer elastomer and tetrahydrofurfuryl methacrylate mixtures for soft prosthetic applications. Biomaterials. 2001;22:2411–2416. doi: 10.1016/S0142-9612(00)00428-2. [DOI] [PubMed] [Google Scholar]
- 4.Kim DJ, Kim HJ, Yoon G. Effect of substrate and tackifier on peeling strength of SIS (styrene–isoprene–styrene)-based HMPSAs. Int J Adhes Adhes. 2005;25:288–295. doi: 10.1016/j.ijadhadh.2004.10.001. [DOI] [Google Scholar]
- 5.Laurer JH, Khan SA, Spontak RJ. Morphology and rheology of SIS and SEPS triblock copolymers in the presence of a midblock-selective solvent. Langmuir. 1999;15:7947–7955. doi: 10.1021/la981441n. [DOI] [Google Scholar]
- 6.Gibert FX, Marin G, Derail C, Allal A, Lechat A. Rheological properties of hot melt pressure-sensitive adhesives based on styrene–isoprene copolymers. PartI: a rheological model for [SIS-SI] formulations. J Adhesion. 2003;79:825–852. doi: 10.1080/00218460309552. [DOI] [Google Scholar]
- 7.Lee WL, Kim HD, Kim EY. Morphological reorientation by extensional flow deformation of a triblock copolymer styrene–isoprene–styrene. Curr Appl Phys. 2006;6:718–722. doi: 10.1016/j.cap.2005.04.026. [DOI] [Google Scholar]
- 8.Efrain RP, Michael CW. Thermodynamics of plasticized triblock copolymers. Part II: model verification by light transmittance and rheology. Polym Eng Sci. 1977;17:573–581. doi: 10.1002/pen.760170814. [DOI] [Google Scholar]
- 9.Zhang JY, Park YJ, Kim HY. A new approach on the thermal stability of SDS copolymer for HMPSA, Part I: oxidation kinetics for the whole process. Polym Degrad Stab. 2008;93:1008–1023. doi: 10.1016/j.polymdegradstab.2007.12.016. [DOI] [Google Scholar]
- 10.Myoung Y, Yamazaki T, Choi HK. Permeation of ciclopirox across porcine hoof membrane: effect of pressure sensitive adhesives and vehicles. Euro J Pharm Sci. 2003;20:319–325. doi: 10.1016/j.ejps.2003.07.001. [DOI] [PubMed] [Google Scholar]
- 11.Wang CX, Han W, Tang XZ, Zhang H. Evaluation of drug release profile from patches based on styrene–isoprene–styrene block copolymer: the effect of block structure and plasticizer. AAPS PharmSciTech. 2012;13:556–567. doi: 10.1208/s12249-012-9778-3. [DOI] [PMC free article] [PubMed] [Google Scholar]
- 12.Schmook FP, Meingassner JG, Billich A. Comparison of human skin or epidermis model with human and animal skin in in-vitro percutaneous absorption. Int J Pharm. 2001;215:51–56. doi: 10.1016/S0378-5173(00)00665-7. [DOI] [PubMed] [Google Scholar]
- 13.Fusco B, Giacovazzo M. Peppers and pain: the promise of capsaicin. Drugs (Basel) 1997;53:909–914. doi: 10.2165/00003495-199753060-00001. [DOI] [PubMed] [Google Scholar]
- 14.Thomas NS, Panchagnula P. Transdermal delivery of zidovudine: effect of vehicles on permeation across rat skin and their mechanism of action. Euro J Pharm Sci. 2003;18:71–79. doi: 10.1016/S0928-0987(02)00242-7. [DOI] [PubMed] [Google Scholar]
- 15.Fang JY, Wu PC, Huang YB, Tsai YH. In vitro permeation study of capsaicin and its synthetic derivatives from ointment bases using various skin types. Int J Pharm. 1995;126:119–128. doi: 10.1016/0378-5173(95)04105-2. [DOI] [Google Scholar]
- 16.Fang JY, Wu PC, Huang YB, Tsai YH. In vivo percutaneous absorption of capsaicin, nonivamide and sodium nonivamide acetate from ointment bases pharmacokinetic analysis in rabbits. Int J Pharm. 1996;128:169–177. doi: 10.1016/0378-5173(95)04274-1. [DOI] [Google Scholar]
- 17.Zhang Y, Huo MR, Zhou JP, Xie SF. PKSolver: an add-in program for pharmacokinetic and pharmacodynamic data analysis in Microsoft Excel. Comput Meth Prog Bio. 2010;99:306–314. doi: 10.1016/j.cmpb.2010.01.007. [DOI] [PubMed] [Google Scholar]
- 18.Frosch PJ, Schulze DA, Hoffmann M, Axthelm I, Kurte AU. Efficacy of skin barrier creams (I) the repetitive irritation test (RIT) in guinea pig. Contact Dermatitis. 1993;28:94–100. doi: 10.1111/j.1600-0536.1993.tb03350.x. [DOI] [PubMed] [Google Scholar]
- 19.Jibry N, Murdan S. In vivo investigation, in mice and in man, into the irritation potential of novel amphiphilogels being studied as transdermal drug carriers. Eur J Pharm Biopharm. 2004;58:107–119. doi: 10.1016/j.ejpb.2004.02.013. [DOI] [PubMed] [Google Scholar]
- 20.Zhang JH, Liu ZP, Du H, Zeng Y, Deng LD, Xing JF, et al. A novel hydrophilic adhesive matrix with self-enhancement for drug percutaneous permeation through rat skin. Pharm Res. 2009;26:1398–1406. doi: 10.1007/s11095-009-9850-1. [DOI] [PubMed] [Google Scholar]
- 21.Sun YH, Fang L, Zhu M, Li W, Meng P, Li L, et al. A drug-in-adhesive transdermal patch for S-amlodipine free base: in vitro and in vivo characterization. Int J Pharm. 2009;382:165–171. doi: 10.1016/j.ijpharm.2009.08.031. [DOI] [PubMed] [Google Scholar]
- 22.Magnusson MM, Koskinen LOD. In vitro percutaneous penetration of topically applied capsaicin in relation to in vivo sensation responses. Int J Pharm. 2000;195:55–62. doi: 10.1016/S0378-5173(99)00337-3. [DOI] [PubMed] [Google Scholar]
- 23.Fang JY, Wu PC, Huang YB, Tsai YH. In vivo percutaneous absorption of capsaicin, nonivamide and sodium nonivamide acetate from ointment bases: skin erythema test and non-invasive surface recovery technique in humans. Int J Pharm. 1996;131:143–151. doi: 10.1016/0378-5173(95)00178-6. [DOI] [Google Scholar]
- 24.Ho HO, Huang FC, Sokoloski TD, Sheu MT. The influence of cosolvents on the in-vitro percutaneous penetration of diclofenac sodium from a gel system. J Pharm Pharmacol. 1994;46:636–642. doi: 10.1111/j.2042-7158.1994.tb03873.x. [DOI] [PubMed] [Google Scholar]
- 25.Guy RH, Hadgraft J. Rate control in transdermal delivery. Int J Pharm. 1992;82:R1–R6. doi: 10.1016/0378-5173(92)90183-3. [DOI] [Google Scholar]
- 26.Ah YC, Choi JK, Choi YK, Ki HM, Bae JH. A novel transdermal patch incorporating meloxicam: in vitro and in vivo characterization. Int J Pharm. 2010;385:12–19. doi: 10.1016/j.ijpharm.2009.10.013. [DOI] [PubMed] [Google Scholar]
- 27.Ren CS, Fang L, Ling L, Wang Q, Liu SH, Zhao LG, et al. Design and in vivo evaluation of an indapamide transdermal patch. Int J Pharm. 2009;370:129–135. doi: 10.1016/j.ijpharm.2008.12.004. [DOI] [PubMed] [Google Scholar]
- 28.Poh BT, Kwo HK. Shear strength of SMR-based pressure-sensitive adhesives. Polym-Plast Techol. 2007;46:1021–1024. doi: 10.1080/03602550701521957. [DOI] [Google Scholar]
- 29.Yat HK, Dodou K. Rheological studies on pressure-sensitive silicone adhesives and drug-in-adhesive layers as a means to characterize adhesive performance. Int J Pharm. 2007;333:24–33. doi: 10.1016/j.ijpharm.2006.09.043. [DOI] [PubMed] [Google Scholar]
- 30.Poh BT, Heng SS. Effect of blend ratio on adhesion properties of pressure-sensitive adhesives prepared from SBR/SMR L blends. Polym-Plast Technol. 2008;47:325–329. doi: 10.1080/03602550701870081. [DOI] [Google Scholar]
- 31.Wokovich AM, Prodduturi S, Doub WH, Hussain AS, Buhse LF. Transdermal drug delivery system (TDDS) adhesion as a critical safety, efficacy and quality attribute. Eur J Pharm Biopharm. 2006;64:1–8. doi: 10.1016/j.ejpb.2006.03.009. [DOI] [PubMed] [Google Scholar]
- 32.Cheong HA, Choi HK. Effect of ethanolamine salts and enhancers on the percutaneous absorption of piroxicam from a pressure sensitive adhesive matrix. Euro J Pharm Sci. 2003;18:149–153. doi: 10.1016/S0928-0987(02)00254-3. [DOI] [PubMed] [Google Scholar]
- 33.Qvist MH, Ulla H, Kreiligaard B, Madesn F, Frokajer S. Release of chemical permeation enhancers from drug-in-adhesive transdermal patches. Int J Pharm. 2002;231:253–263. doi: 10.1016/S0378-5173(01)00893-6. [DOI] [PubMed] [Google Scholar]
- 34.Williams AC, Barry BW. Penetration enhancers. Adv Drug Deliver Rev. 2004;56:603–618. doi: 10.1016/j.addr.2003.10.025. [DOI] [PubMed] [Google Scholar]
- 35.Fang JY, Fang CL, Hong CT, Chen HY, Lin TY, Wei HM. Capsaicin and nonivamide as novel skin permeation enhancers for indomethacin. Euro J Pharm Sci. 2001;12:195–203. doi: 10.1016/S0928-0987(00)00118-4. [DOI] [PubMed] [Google Scholar]
- 36.Zhao LG, Li Y, Fang L, He ZG, Liu XT, Wang L, et al. Transdermal delivery of tolterodine by O-acylmenthol: in vitro/in vivo correlation. Int J Pharm. 2009;374:73–81. doi: 10.1016/j.ijpharm.2009.03.005. [DOI] [PubMed] [Google Scholar]
- 37.Zhao JH, Fu JH, Wang SM, Su CH. A novel transdermal patch incorporating isosorbide dinitrate with bisoprolol: in vitro and in vivo characterization. Int J Pharm. 2007;337:88–101. doi: 10.1016/j.ijpharm.2006.12.030. [DOI] [PubMed] [Google Scholar]
- 38.Wang YY, Hong TC, Chiu WT, Fang JY. In vitro and in vivo evaluations of topically applied capsaicin and nonivamide from hydrogels. Int J Pharm. 2001;224:89–104. doi: 10.1016/S0378-5173(01)00755-4. [DOI] [PubMed] [Google Scholar]