Abstract
As outlined in the ICH Q8(R2) guidance, identifying the critical quality attributes (CQA) is a crucial part of dosage form development; however, the number of possible formulation and processing factors that could influence the manufacturing of a pharmaceutical dosage form is enormous obviating formal study of all possible parameters and their interactions. Thus, the objective of this study is to examine how quality risk management can be used to prioritize the number of experiments needed to identify the CQA, while still maintaining an acceptable product risk profile. To conduct the study, immediate-release ciprofloxacin tablets manufactured via roller compaction were used as a prototype system. Granules were manufactured using an Alexanderwerk WP120 roller compactor and tablets were compressed on a Stokes B2 tablet press. In the early stages of development, prior knowledge was systematically incorporated into the risk assessment using failure mode and effect analysis (FMEA). The factors identified using FMEA were then followed by a quantitative assessed using a Plackett–Burman screening design. Results show that by using prior experience, literature data, and preformulation data the number of experiments could be reduced to an acceptable level, and the use of FMEA and screening designs such as the Plackett Burman can rationally guide the process of reducing the number experiments to a manageable level.
KEY WORDS: failure mode effect analysis (FMEA), Plackett–Burman, quality by design (QbD), quality risk management, roller compaction, tablet and ciprofloxacin
INTRODUCTION
The regulatory framework outlined in the ICH guidances Q8(R2) Pharmaceutical Development, ICH Q9 Quality Risk Management and ICH Q10 Pharmaceutical Quality Systems was introduced to improve pharmaceutical product quality and provide regulatory flexibility for the industry to improve their manufacturing processes (1–3). Figure 1 shows the principal steps needed for the development of a new drug using the Quality by Design (QbD) paradigm as outlined in the ICH Q8(R2), Q9, and Q10 guidances.
Fig. 1.
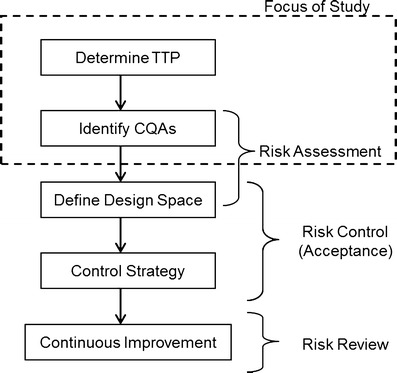
QbD drug product development flow chart showing principal steps
The first step in this process is to define the Quality Target Product Profile (QTPP). The ICH Q8(R2) guidance defines the QTPP as “A prospective summary of the quality characteristics of a drug product that ideally will be achieved to ensure the desired quality, taking into account safety and efficacy of the drug product” (1). In other words, one has to determine the performance attributes that need to be designed into the dosage form so that it achieves the desired performance aims. Performance attributes can include factors such as therapeutic dose, route of administration, type of dosage form, release profile that complements the pharmacokinetic characteristics of the active pharmaceutical ingredient (API) and optimizes drug delivery. This definition includes all of factors that influence product performance, from API and excipient stability/compatibility all the way through to packaging. For a successful dosage form, the characteristics that make up the QTPP should be designed into the drug product and serve as road map for the development process.
After defining the QTPP and developing a lead formulation and manufacturing process, the next step is to develop a process understanding by which the material inputs and manufacturing process parameters that affect the dosage performance or QTPPs can be identified, i.e., determine the critical quality attributes (CQAs; see Fig. 1). According to ICH Q8(R2) “A CQA is a physical, chemical, biological, or microbiological property or characteristic that should be within an appropriate limit, range, or distribution to ensure the desired product quality. CQAs are generally associated with the drug substance, excipients, intermediates (in-process materials) and drug product” (1). Examples of CQAs include those aspects affecting product purity, strength, drug release, and stability; for solid oral dosage forms, raw materials properties such as particle size distribution, bulk density, and moisture content can all be examples of CQAs that can affect product performance. Thus, a key goal of QbD is to identify the most important CQAs, i.e., formulation as well as process parameters that have the greatest influence on the QTPP, and to understand their relationships to product performance.
The QbD paradigm requires process understanding and the determination of the design space, which requires identifying the principal CQAs. The main challenge faced with process understanding is identifying the CQAs from the numerous possible formulation and process variables that could affect drug product quality, i.e., the QTPP. The problem is worsened by the fact that most pharmaceutical operations have no fundamental first principle models that can be used; thus, most of our knowledge of unit operation behavior is based upon empirical correlation; which is typically assessed by use of statistical methods. Traditional pharmaceutical product development uses factorial (full and/or fractional) statistical designs and response surface methodologies to systematically evaluate formulation/process variables and relate them to critical product quality attributes (4). These designs provide comprehensive process understanding and are invaluable in assessing the manufacturing process and the factors that affect end-product quality. However, statistical methodologies suffer from the practical limitation that for each variable added to the study many more experiments must be done and one can easily create a situation in which the number of experiments needed to complete an experimental design is not practically feasible. This is an issue, especially in the early stages of development where formulation and/or the process are not fixed and there are many sources of variability, from the API, excipients as well as those arising from each unit operation of the manufacturing process. The fundamental problem is that studying too many variables directly increases development costs, and requires more time to bring new products into market, which can potentially delay new therapies for patients who have life-threatening illnesses. In addition, there are many unmet therapeutic needs that have small market sizes and if it is too expensive to develop a drug, then no new therapies will be forthcoming. Alternatively, studying too few variables has the risks of insufficient process understanding, which can increase the likelihood of product failures or recalls and safety issues due to poor product performance, which also poses some risk to patients.
One way to optimize the use or resources in development is to use risk methods to prioritize the variables to be studied, i.e., identify the variables that present the most risk to product quality and study those variables more carefully. The goal of this paper is to illustrate how quality risk management tools can be used to rationally balance walking the fine line between too many and too few experiments during product development, and to focus resources on the factors that can have the greatest impact on patient health/product quality. Specifically, the goal is to apply quality risk management in the early stages of tablet formulation development of an IR tablet for the poorly soluble drug ciprofloxacin. The identification of key factors (sources of variability) in early stages of development was done using the failure mode and effect analysis (FMEA) followed by the Plackett–Burman (PB) design of experiments (DOE) method (5,6).
MATERIALS AND METHODS
Materials
Ciprofloxacin HCl USP (lot no. 6026) was purchased from R.J. Chemicals, Coral Springs, FL (manufactured by Quimica Sintetica, Madrid, Spain). Microcrystalline cellulose, Avicel® PH 102 (lot no. P208819026) and Avicel® PH 101 (lot no. P108819435) grades were obtained from FMC Biopolymer (Philadelphia, PA). Pregelatinized starch, Starch 1500® grade (lot no. IN502268) was obtained from Colorcon (West Point, PA) and Spress®B825 grade (lot no. S0430676) was obtained from grain processing corporation (Muscatine, IA). Hydroxypropyl cellulose, Klucel® EXF (lot no. 89510) and Klucel® JF (lot no. 89014) grades were obtained from Aqualon/Hercules (Wilmington, DE). Magnesium stearate, vegetable source (lot no. MO5676) was obtained from Covidien (Hazelwood, MO), and animal source (lot no. WQ0272) was obtained from Spectrum pharmacy products (Hazelwood, MO). Fumed silica, Aerosil® 200 (lot no. A07319D) was obtained from Evonik (Piscataway, NJ).
Roller Compaction and Tablet Production
To prepare a batch size of 500 g, the intragranular components (472.5 g) were blended in a twin-shell blender (Patterson-Kelley Company, East Stroudsburg, PA) without an intensifier bar for 5 min. The powder blend was compacted on a roller compactor (Model: WP 120 V Pharma, Alexanderwerk Inc., Horsham, PA) equipped with rollers (25 mm diameter) having a knurled surface. Granulation was performed using a fixed roll-gap of 1.5 mm. Studies carried out previously (7–9) have shown that there is no significant differences in the physical–mechanical properties of roller-compacted products processed at different feed screw speed (FSS) and roller speed (RS) settings if the ratios were kept constant; therefore, for the current study, we choose to investigate the influence of different FSS:RS ratios. Granules were produced at roll pressures (RP) of 80 and 140 bars, FSS/RS ratio(s) of 5:1 (FSS, 35 rpm; RS, 7 rpm) and 7:1 (FSS, 49 rpm; RS, 7 rpm) and granulator speed of 25 and 50 rpm. Ribbons were fed through the attached granulator and milled in two stages (coarse and fine) using screen size 10 and 16, respectively. The lubricant was combined with a portion of the previously prepared mix and passed by hand through a 20-mesh wire screen. This mix was then added to the same twin-shell blender with the remaining powder blend (27.5 g) and mixed for additional 2 min. Tablets were made on a Stokes® B2 rotary tablet press (Warminster, PA) rotating at 30 rpm and equipped with force transducers to monitor compression force.
Granule Characterization
Granule size was measured by laser diffraction using the Malvern Mastersizer X/S (Malvern Inc., Worcestershire, UK) and the Fraunhofer model analysis routine. The dry powder feeder was operated at an air pressure of 20 psi, a feed rate setting of 2.5 (arbitrary instrument setting), and a sample size of 5 g. The average D[4,3] particle size of three replicates was reported. The bulk density (Db) of a powder blend and the roller-compacted granules were determined using USP method <616>, method II. Tapped density (Dt) was determined using JEL Stampf® Volumeter Model STAV 2003 (Ludwigshafen, Germany) in accordance with USP method <616>. Due to material limitations tapped density were not replicated. Carr’s compressibility index (CI) was determined using the formula (10). A lower CI% value (<20) is generally an indication of good flow (10):
 |
1 |
Tablet Characterization
Dissolution studies were done using USP Apparatus II, model SR8Plus (Hanson Research; Chatsworth, CA). In accordance with the USP monograph for ciprofloxacin HCl, the dissolution was carried out in 900 mL of 0.01 N HCl at 37 ± 0.5°C and the paddles were operated at 50 rpm. Samples were collected at regular time intervals of 10, 20, 30, 45, and 60 min using an autosampler, Autoplus Maximizer, and further diluted with 0.01 N HCl using Autoplus™ Multifill™ (Hanson Research; Chatsworth, CA). The amount of ciprofloxacin HCl released was measured using UV–Visible spectroscopy (Pharmaspec UV-1700, Shimadzu) at 276-nm wavelengths. Disintegration testing was performed using a basket-rack assembly, in accordance with USP method <701>. Water was used as media and the temperature was maintained 37 ± 0.5°C. Six tablets were tested and the time to for each tablet to pass through the wire mesh was recorded. Tablet breaking force was determined using hardness tester (Model HT-300) manufactured by Key International, Inc. (Englishtown, NJ) and average value of six tablets were reported. In accordance with USP method <476>, friability test was performed using Vankel Inc. (Cary, NC) friability apparatus (Model 45–1000) on whole tablets corresponding to a total of 6.5 g.
Statistical Methods
Normal plots were used to determine effect significance for the 12 run PB studies. For the normal plots, if the responses fall in line with the expected values from a normal distribution, then the effect was considered insignificant. Conversely, if responses fall out of line with the expected values, the effect was considered significant. To confirm the half-normal plots, t tests and Pareto charts were generated using Design Expert® (version 8.0.4; Stat-Ease, Inc., Minneapolis, MN); a significant threshold of p < 0.05 was used. The Pareto charts help to visualize the relative size of each effect.
RESULTS AND DISCUSSION
The following sections describe the application of risk tools for the identification of the critical quality attributes. The analysis includes defining the target product profile, followed by qualitative risk assessment using FMEA, and finally, a PB DOE will be used to quantitatively identify the main effects, i.e., principal CQAs.
Quality Target Product Profile of Ciprofloxacin
As discussed above, the quality target product profile (QTPP) describes the design criteria for the product, and should therefore form the basis for determining the CQAs, critical process parameters, and Control Strategy. The first step is to define the QTPP, i.e., decide what you want the product to do, the type of dosage form and manufacturing method. The desired QTPP depends upon scientific and nonscientific considerations. For example, a scientific consideration might be determining if the drug is moisture labile and can withstand being wet granulated and dried at elevated temperatures. A nonscientific consideration might be the specification of a specific branded appearance of a dosage form or route of administration by the marketing department. Ciprofloxacin HCl was chosen for this study in part because most of the issues with the QTPP have been previously determined. Thus, other than describing our QTPP, the steps to define the QTPP are not discussed; however, when working with a new drug, the importance of these steps cannot be over emphasized, as they guide all the critical decisions in the drug development process.
Ciprofloxacin HCl belongs to biological classification system (BCS) Class II (poorly soluble and highly permeable), the API is a monohydrochloride monohydrate salt of 1-cyclopropyl-6-fluoro-1, 4-dihydro-4-oxo-7-(1-piperazinyl)-3-quinolinecarboxylic acid, which is a broad-spectrum antibiotic. It is amphoteric with pKa values of 6.2 and 8.59 at 37°C (11), and its solubility is pH dependent with high solubility at pHs below 5 (10–30 mg/ml in water) and at pHs above 10. Cipro has low solubility at neutral pH of 7.5 (0.07 mg/ml in phosphate buffer) (12). For this study, 200 mg ciprofloxacin HCl, immediate-release tablet formulation for oral dosing was chosen as a model product. A list of the key QTPP, which generally follows the USP monograph for the ciprofloxacin tablets, are given in Table I, and these parameters will be the focus of this study. Obviously, other factors such as stability are important, but we will limit our discussion to these key factors.
Table I.
Tablet Quality Target Product Profile (QTPP) of Ciprofloxacin Tablets
| Critical quality attribute | Values |
|---|---|
| Potency and assay | 200 mg range 90 to 110% |
| Friability | <1.0% |
| Tablet weight and content uniformity | 400 ± 10 mg |
| Tablet breaking force | 10–20 kp |
| Disintegration time | <10 min |
| Dissolution rate | Not less than 80% released in 30 min |
CQAs Identification Using a Quality Risk Management Approach
The desired quality attributes define the objectives for formulation and process design; however, the CQAs are also very dependent upon the type of dosage form, formulation, and manufacturing method chosen among many possible and clinically equivalent alternatives. For example, it is possible that if the drug has a good stability profile, then wet granulation and dry granulation via roller compaction could produce equivalent granules for an immediate-release tablet, but the CQA could be very different for the two processes. Thus, before beginning to identify the CQAs, some feasibility studies need to be performed to determine the dosage form type, lead formulation, and unit operations that make up the manufacturing process. Unfortunately, for solid oral dosage forms, there are no first principle models that can be used to design a dosage form a priory. Consequently, formulation and process development typically rely on empirical prior knowledge, small-scale feasibility studies and empirical statistical studies.
To develop a formulation, preformulation studies that included API solubility as a function of pH, particle size analysis, thermal, and flow characterization of the API and excipients were carried out. In addition, early development work examined API suitability for tablet compaction and roller compaction. The preformulation studies demonstrated that the drug was very stable, that flow and consequently content uniformity were poor and achieving the desired drug release rate would be the biggest formulation challenges. To address the problem of powder flow dry granulation, using slugging and roller compaction were tested and found to significantly improve powder flow. The Carr index of the formulation was significantly lowered from 33.98% before roller compaction to 24.85% and 20.34% after roller compaction for roll pressures of 40 and 80 bars, respectively, indicating the suitability of roller compaction. To achieve the desired release rate, formulations consisting of varying levels of Klucel® JF (7–9%) and Starch 1500® (2–5%) were granulated and compressed at varying compression forces (8, 12, and 16 kN). These studies showed that the Klucel® levels, disintegrant levels, roll pressure, and compression force are important factors influencing the disintegration time and dissolution rate. These studies led us to identify the base formulation and processing conditions (see Table II). As mentioned above, the compatibility and stability studies showed the drug to be very stable in our formulation, so the issues of stability will not be addressed further, but obviously this is a critical issue.
Table II.
Base Formulation and Processing Conditions Used for PB-DOE Studies
| Component | Amount (wt%) |
| Ciprofloxacin (intragranular) | 50 |
| MCC (intragranular) | 37 |
| Starch 1500 (intragranular) | 5 |
| HPC (intragranular) | 2 |
| Mg Stearate (intragranular) | 0.5 |
| Starch 1500 (extragranular) | 5 |
| Mg Stearate (extragranular) | 0.5 |
| Processing conditions | Parameter value |
| Blending time 1: intragranular blend, i.e., API + excipients other than magnesium stearate | 5 min |
| Blending time 1: intragranular blend, i.e., lubricant blend (magnesium stearate) | 2 min |
| Roll pressure | 80 bar |
| Feed screw speed (FSS/RP ratio = 5) | 20 rpm |
| Roll speed (FSS/RP ratio = 5) | 4 rpm |
| Blending time 3—extragranular blend: granules + extragranular excipient fraction | 2 min |
| Compression force | 12 kN |
The feed screw speed (FSS) to roller speed (RP) ratio was used as the independent variable; the table shows the individual values that make up the ratio
Based upon the preformulation and feasibility studies, we defined the following formulation and manufacturing method for 400-mg immediate-release tablets containing 200 mg ciprofloxacin. Each tablet contains the following excipients: Avicel® PH 102 (filler), Klucel® EXF (binder), Starch 1500® (disintegrant), and magnesium stearate (lubricant). Fifty percent of the disintegrant and lubricant amount was added extragranularly prior to tableting. The manufacturing process involves blending, roller compaction of the blend with microcrystalline cellulose, magnesium stearate, and pregelatinized starch, followed by addition of extragranular portion (magnesium stearate and pregelatinized starch) second blending with magnesium stearate, which was followed by compression on a rotary tablet press.
Qualitative Risk Analysis of CQAs
The FMEA method was used to perform the qualitative risk assessment, which could identify the CQAs that have the greatest chance of causing product failure, i.e., not meeting the QTPP (13). The first step in the risk assessment was to systematically gather up all the possible factors that could influence product quality (14). To identify these factors, we reviewed the literature, our past experiences (15,16), and data collected during the initial formulation development studies described above. These factors were organized hierarchically using an Ishikawa or “fishbone” diagram (see Fig. 2) (17). The parameters outlined in the Ishikawa chart aided in the identification of the failure modes (i.e., the ways or modes by which a system, process step, or piece of equipment might fail). FMEA are also used to describe the effects or consequences of specific failure modes. Using FMEA, the modes of failure can be prioritized for risk management purposes according to the seriousness of their consequences (effects), how frequently they occur and how easily they can be detected. From this information, the variables (CQAs) that need to be further studied and controlled can be identified. Another important aspect of FMEA, especially for larger organizations, is that the process of doing the analysis facilitates systematically gathering the current knowledge within the organization, and with a knowledge management system, it allows the information on risk to be stored for future use. This is important for companies in which turnover results in the loss of institutional memory (6).
Fig. 2.
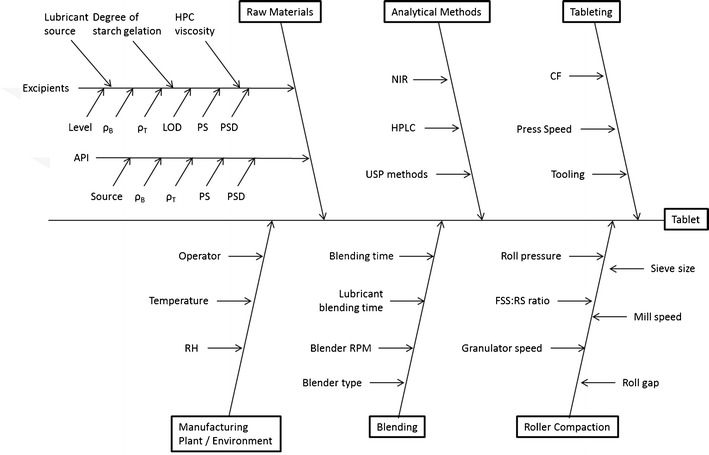
Ishikawa fish bone diagram for tablet production via roller compaction
The outcome of an FMEA are risk priority numbers (RPN) for each combination of failure mode severity, occurrence probability, and likelihood of detection, which can be used to rank the risk. FMEA defines the RPN as:
 |
2 |
where O is the occurrence probability or the likelihood of an event occurring; we ranked these as 5, likely to occur; 3, 50:50 chance of occurring; and 1, unlikely to occur. The next parameter S, the severity, which is a measure of how severe of an effect a given failure mode would cause; we ranked these as 5, severe effect; 3, moderate effect; and 1, no effect. The final parameter D is the detectability or the ease that a failure mode can be detected, because the more detectible a failure mode is, the less risk it presents to product quality. For D, we ranked 1 as easily detectable, 3 as moderately detectable, and 5 as hard to detect. Using this procedure, we created the ranking shown in Table III.
Table III.
Summary of FMEA Analysis
| Unit OP | Failure mode | Impact of change | S | Potential cause or route of failure | O | Detection or control method | D | RPN |
|---|---|---|---|---|---|---|---|---|
| Blending | Blending time | CU | 5 | Poor monitoring | 1 | NIR | 1 | 5 |
| Fill level | CU | 5 | Operator’s error | 2 | NIR | 1 | 10 | |
| Blender speed | CU | 5 | Operator’s error, equipment failure | 3 | NIR | 1 | 15 | |
| Humidity | CU | 3 | Poor air handling | 1 | NIR/hygrometer | 1 | 3 | |
| RC | Roll speed | Poor granule quality | 5 | Machine failure, poor development | 3 | Carr index, particle size | 4 | 60 |
| Feed screw speed | Granule uniformity | 5 | Machine failure, poor development | 3 | HPLC/NIR | 4 | 60 | |
| Roll pressure | Particle size, hardness | 5 | Machine failure, poor development | 5 | Malvern/hardness tester | 5 | 125 | |
| Mill speed | Particle size, hardness | 5 | Machine failure, poor development | 3 | Malvern | 4 | 60 | |
| Roller texture | Ribbon density | 1 | Machine failure, poor development | 1 | Carr index | 1 | 1 | |
| Tableting | Humidity | CU and hardness | 3 | Poor air handling | 3 | Hygrometer | 3 | 27 |
| Compression force | Hardness, dissolution | 5 | Poor granulations | 5 | Disintegration, dissolution, hardness tester | 4 | 100 | |
| Compression speed | CU | 3 | Operator’s error, equipment failure | 3 | NIR/HPLC | 3 | 27 | |
| Tooling shape | CU, tablet weight | 1 | Operator’s error, equipment failure | 1 | NIR/HPLC | 3 | 3 | |
| Raw Materials | Level | Dissolution, hardness | 5 | Operator error, poor development | 5 | Disintegration, dissolution, hardness tester | 5 | 125 |
| Vendor grade differences | Dissolution, hardness | 4 | Poor development, operator error | 5 | Disintegration, dissolution, hardness tester | 4 | 80 | |
| Different sources | Physical properties | 4 | Physical variation | 3 | Visual inspection | 3 | 36 | |
| Particle size | CU, dissolution, hardness | 5 | Material variation | 3 | Malvern/hardness tester | 4 | 60 |
S severity of excursion = 1 (low), 5 (high); O probability of occurrence of the excursion = 1 (low), 5 (high); D detection of excursion = 1(easy), 5 (hard); RPN risk priority number = S × O × D
1–29 low risk, 30–59 medium risk (in bold), 60–125 high risk (in italics)
In the present study, the greatest RPNs were used to identify the parameters that pose the most risk to product quality, and thus needed to be studied in more detail. Table III, is a partial listing of the factors considered when doing the FMEA. To begin the FMEA, we broke the failure modes down into those coming from the formulation or raw material inputs and those coming from the process. The process failure modes were further broken down by unit operations, which were blending intragranular ingredients, roller compaction, blending extragranular ingredients, and compression (15,16).
Changes to humidity leading to variability in product moisture content were considered to be lower risk because all the development work was conducted under GMP conditions and previous compatibility studies to assess the kinetic and equilibrium moisture content of the drug substance, excipients, and formulation blends demonstrated that there was no significant impact on the product quality attributes under relative humilities of 40 to 75% RH. In addition, variables that could affect in vivo performance have generally been scored high, while variables that are naturally controlled such as humidity, tooling shape were scored lower. This difference in scoring is linked to both the detectability and severity associated with each failure effect. For those failure effects that could have an impact on processing and product physical quality, detectability was high, occurring either during the unit operation, or finished product testing.
The initial quality risk assessment has allowed the highest risks to be identified. The highest risks have been identified as those associated with changes to the input raw materials (changes in API particle size, change to magnesium stearate source and change to the level of disintegrant:binder level) and process parameters for the roller compaction (roller pressure, ratio between roller speed/feed screw speed, and compression force) .
Quantitative CQA Identification Using Plackett–Burman Study Design
Based on the FMEA rankings (see Table III) the following potential CQAs were identified for further study: the API and filler-binder particle size, degree of starch gelatinization, viscosity and particle size of the hydroxypropyl cellulose, and source of the lubricant. Similarly, the key processing variables to be studied were roll pressure, roll speed to feed screw speed ratio (FSS/RS), granulator speed (also called a Chilsonator® style mill that grinds the ribbon flakes into granules), lubricant blending time, and tablet compression force were selected for further investigation. Using statistical methods like a full factorial design would require 211 (or 2,048) experiments. Clearly, at the early stages of development when there is only a preliminary lead formulation, a full factorial design may not be an optimal use of resources due to the large number of experiments and the scarcity of API. At this stage, the goal is to identify the CQAs for which future development efforts can be focused based upon the risk associated with each parameter. Thus, we chose the Plackett–Burman experimental design, which is a widely used screening design for the identification of “main factors” that cause variability in product quality (5,18). The advantage of the PB design is that many factors can be screened with a relatively few number of trials. The disadvantage of these designs is that interactions between variables are generally confounded and cannot be easily determined, as there are not enough degrees of freedom. Also, unless treatments are replicated, variability cannot be evaluated. While these are significant limitations, when a large number of studies would be needed to implement higher-resolution factorial designs, the Plackett–Burman can be a pragmatic solution (19).
For the Plackett–Burman designs, the number of factors to be evaluated is up to 1 less than the number of runs or trials in the study. These designs do not exist for all the possible number of runs. The original paper published 8, 12, 16, 20, 24 … 96, and 100 runs. Thus, it is possible to study 7 factors in 8 runs, 11 factors in 12 runs, or even 99 factors in 100 runs (5). To analyze the results, the study data are plotted against the expected values of a set of samples taken from a distribution of the absolute value of X (│X│) where X is distributed normally. The effect of factor Xi is calculated using:
 |
3 |
where Y is the response of an experiment, the bar indicates average value. The effect of Xi was calculated for each of the variables studied and plotted using a half-normal plot (5,18). The fit of these plots was used to determine significance of an effect; with half-normal plot, the non-significant effects tend to fall on a straight line through the origin, while significant effects deviate from this line (20).
For the PB-DOE, 11 formulation and processing parameters were chosen based upon the FMEA analysis (see above) and for each of the 11 variables two treatment levels were identified (see Table IV). The levels were determined by a combination of prior experience (15,16) and the preliminary formulation studies in which we did small-scale experiments to determine the range of formulation and processing parameters. Once the study variables and their levels have been chosen, the variables were randomly assigned to the 12 experiments of the Plackett–Burman DOE grid (see Table V) (5,18). The first column shows the assignments 11 variables from Table IV for the 12 experiments; the following columns show the + or − treatments. The quality attributes of the tablet that were measured included: weight variation (WV), tablet breaking force (BF), disintegration time (DT), and dissolution time (Q30). In addition, important granules properties such as granule size (X) and Carr index (%CI) were studied to better identify the CQAs important to the blending and granulation stages of manufacturing. The formulations were processed to produce granules and tablets using the conditions given in Tables IV and V, and characterized for their properties (CQAs). The results given in Table VI are broken into the granule properties and the final tablet properties.
Table IV.
Eleven Factors Studied in the Plackett–Burman DOE, and the Associated Treatment Levels
| Factor | Level (+1) | Level (−1) |
|---|---|---|
| X1 (A)—level of disintegrant gelatinization (categorical) | Partially gelatinized—Starch 1500 | Fully gelatinized—Spress® B825 |
| X2 (B)—tablet compression force (Pmax) (numerical) | 12 kN | 16 kN |
| X3 (C)—speed of granulator after roller compaction (numerical) | 50 rpm | 25 rpm |
| X4 (D)—roll pressure (dry granulation) (numerical) | 80 bar | 140 bar |
| X5 (E)—API particle size (categorical) | Cipro unsieved (d(0.5) = 15.47 μ) | Cipro sieved (d(0.5) = 8.87 μ) |
| X6 (F)—source/supplier of lubricant (categorical) | Vegetable source—Covidien | Animal source—Spectrum |
| X7 (G)—filler particle size (numerical) | Avicel PH 102 (90 μ) | Avicel PH 101 (50 μ) |
| X8 (H)—binder grade (hydroxypropyl cellulose) (categorical) | Low viscosity and small particle size—Klucel® EXF | Medium viscosity and larger particle size Klucel® JF |
| X9(J)—ratio of roll speed to feed screw speed (numerical) | Ratio = 5 (35/7) | Ratio = 7 (49/7) |
| X10(K)—blending time (API/excipient blend + lubricant blend + extragranular blend) (numerical) | 5 + 2 + 2 min | 20 + 2 + 2 min |
| X11(L)—glidant level (numerical) | No aerosil (0%) | Aerosil (0.25%) |
Table V.
Twelve Experiment Design Grid Used to Investigate 11 Variables
| Pattern | X1 | X2 | X3 | X4 | X5 | X6 | X7 | X8 | X9 | X10 | X11 | |
|---|---|---|---|---|---|---|---|---|---|---|---|---|
| 1 | +++++++++++ | 1 | 1 | 1 | 1 | 1 | 1 | 1 | 1 | 1 | 1 | 1 |
| 2 | −+−+++−−−+− | −1 | 1 | −1 | 1 | 1 | 1 | −1 | −1 | −1 | 1 | −1 |
| 3 | −−+−+++−−−+ | −1 | −1 | 1 | −1 | 1 | 1 | 1 | −1 | −1 | −1 | 1 |
| 4 | +−−+−+++−−− | 1 | −1 | −1 | 1 | −1 | 1 | 1 | 1 | −1 | −1 | −1 |
| 5 | −+−−+−+++−− | −1 | 1 | −1 | −1 | 1 | −1 | 1 | 1 | 1 | −1 | −1 |
| 6 | −−+−−+−+++− | −1 | −1 | 1 | −1 | −1 | 1 | −1 | 1 | 1 | 1 | −1 |
| 7 | −−−+−−+−+++ | −1 | −1 | −1 | 1 | −1 | −1 | 1 | −1 | 1 | 1 | 1 |
| 8 | +−−−+−−+−++ | 1 | −1 | −1 | −1 | 1 | −1 | −1 | 1 | −1 | 1 | 1 |
| 9 | ++−−−+−−+−+ | 1 | 1 | −1 | −1 | −1 | 1 | −1 | −1 | 1 | −1 | 1 |
| 10 | +++−−−+−−+− | 1 | 1 | 1 | −1 | −1 | −1 | 1 | −1 | −1 | 1 | −1 |
| 11 | −+++−−−+−−+ | −1 | 1 | 1 | 1 | −1 | −1 | −1 | 1 | −1 | −1 | 1 |
| 12 | +−+++−−−+−− | 1 | −1 | 1 | 1 | 1 | −1 | −1 | −1 | 1 | −1 | −1 |
Table VI.
Granule and Tablet Properties
| S. no | Granule properties | Tablet properties | |||||||
|---|---|---|---|---|---|---|---|---|---|
| X (μm) ± SD | Db (gm/cc)a | Dt (gm/cc) | CI (%) | Wt (mg) | Wt RSD (%) | BF (kp) ± SD | DT (min) ± SD | Q30 (%) ± SD | |
| API | 15.5 ± 3.8 | 0.23 | 0.45 | 48.4 | NA | NA | NA | NA | NA |
| F1 | 183.5 ± 5.6 | 0.59 | 0.76 | 22.4 | 406.5 | 1.1 | 13.4 ± 0.6 | 15.0 ± 2.2 | 63 ± 14.7 |
| F2 | 154.9 ± 6.2 | 0.60 | 0.76 | 22.0 | 401.8 | 0.7 | 14.2 ± 0.9 | 1.0 ± 0.0 | 99 ± 2.2 |
| F3 | 202.6 ± 10.5 | 0.62 | 0.77 | 19.7 | 402.7 | 2.1 | 11.3 ± 1.0 | 4.0 ± 0.0 | 93 ± 7.9 |
| F4 | 190.1 ± 6.0 | 0.59 | 0.75 | 21.9 | 398.7 | 0.8 | 18.6 ± 0.5 | 52.8 ± 2.0 | 46 ± 10.3 |
| F5 | 265.4 ± 11.1 | 0.64 | 0.78 | 17.4 | 407.8 | 1.6 | 10.7 ± 0.9 | 37.5 ± 4.3 | 57 ± 14.3 |
| F6 | 252.1 ± 14.2 | 0.69 | 0.83 | 17.1 | 401.2 | 0.6 | 11.3 ± 0.3 | 51.3 ± 4.8 | 37 ± 5.2 |
| F7 | 225.3 ± 7.0 | 0.60 | 0.75 | 20.0 | 395.3 | 1.0 | 15.0 ± 0.2 | 2.0 ± 0.0 | 98 ± 7.8 |
| F8 | 274.5 ± 9.4 | 0.62 | 0.81 | 23.8 | 403.0 | 1.0 | 14.8 ± 0.7 | 40.0 ± 3.0 | 70 ± 11.1 |
| F9 | 213.6 ± 5.5 | 0.61 | 0.79 | 22.7 | 401.2 | 0.8 | 9.1 ± 0.5 | 2.0 ± 0.0 | 98 ± 6.0 |
| F10 | 254.5 ± 10.3 | 0.64 | 0.77 | 17.6 | 394.2 | 1.3 | 10.0 ± 0.5 | 2.2 ± 0.4 | 95 ± 5.8 |
| F11 | 245.6 ± 10.9 | 0.59 | 0.76 | 22.2 | 403.0 | 0.8 | 12.9 ± 0.7 | 14.8 ± 6.9 | 96 ± 14.5 |
| F12 | 237.8 ± 16.9 | 0.62 | 0.77 | 19.9 | 394.7 | 1.7 | 18.2 ± 1.0 | 2.3 ± 0.5 | 98 ± 3.4 |
Note, due to material limitations the tapped density was not replicated, hence there is no standard deviation for Dt and the CI. For all of the formulations tested, the friability values were less than 1%, so this data was omitted from the table. Bold indicates out of specification results
X particle size, Db bulk density, Dt tapped density, CI Carr’s index, Wt ± weight variation RSD (i.e., 100× standard deviation/average), BF breaking force, DT disintegration time, Q30 amount released in dissolution media at 30 mins RSD, NA not applicable
aAll standard deviations were SD < 0.012
Granule Particle Size
Variability in the formulation and roller compaction process resulted in granules in the size range of 154.9 to 274.5 μm (Table VI). The Half-normal probability plots (see Fig. 3a), calculated from the particle size data shown in Table VI show that the Mg stearate type and roller pressure have a significant influence on granule particle size. The calculation of the t values (see Fig. 3b), confirmed that both parameters are significant. Thus, for the systems studied the substitution of the vegetable grade Mg stearate with the animal grade resulted in increase in the particle size of the granules. Increase in roll pressure from 80 to 140 bars increase the granule size.
Fig. 3.
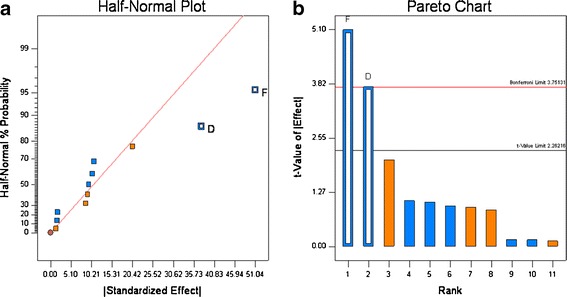
Half-normal probability (a) and Pareto plots (b) for granule particle size. Roll pressure (D) and lubricant source (F) were found to be significant
Although no difference in the physical properties such as particle size, bulk density, tapped density, and compressibility index was observed between the animal and plant sources of Mg stearate, they differ in fatty acid composition and surface area. It was reported that lubrication efficiency was different for tablets. Ejection forces were reported to be lower for tablets consisting of vegetable grade compared to animal grade during slugging experiments (21). It was also reported that Mg stearate has been known to affect ribbon density and mechanical strength (22), and it is the ribbon strength that affects the particle size of the granules when the ribbon is milled into granules.
Increase in roll pressure from 80 to 140 bars increases the granule size. Generally, increasing the compression force on the material in the nip zone of the roller compactor results in a higher degree of consolidation. The higher consolidation, which results from more bounding between particles and higher density, produces a ribbon with a higher tensile strength, and when these ribbons are milled they retain a relatively larger size compared to the ribbons produced at lower roll pressure. This type of behavior is commonly observed, see Dave et al. for example (15,16).
Granule Carr Index
The Carr index of the granules produced in the DOE, Table V, ranged from 17.1 to 23.8 (see Table VI). According to Carr’s classification (10), these values range from excellent to poor flow properties. The Half-normal probability plots showed that the addition of the glidant Aerosil® and roller pressure had the greatest effect on the Carr index (see Fig. 4a). The statistical tests (see Fig. 4b), show that the Aerosil® was significant and that roller pressure was not quite significant. The Carr index values were positively correlated, i.e., without Aerosil incorporation; the Carr index values were significantly higher, which is an indication of poor flow. The incorporation of Aerosil® (0.25% w/w) decreased the Carr index, which can be attributed to the glidant properties of silica.
Fig. 4.
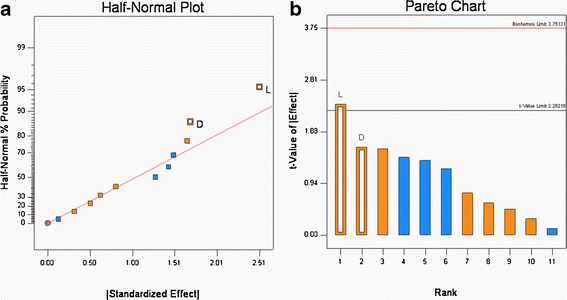
Half-normal probability (a) and Pareto plots (b) for Carr’s Index (percent). Glidant addition (L) was found to be significant
Similarly, roll pressure had a positive effect, which means that at the lower roll pressure of 80 bars, the Carr index was higher. This result coincides with the previous observation where roll pressure plays a critical role in the granule size and increase in roll pressure increases the granule size and thereby improving the flow characteristics. While statistical analysis shows that the roll pressure effect was not significant, it is still an important factor that needs to be controlled as it affects important properties such as flow and content uniformity.
Tablet Weight Variation
As shown in Table VI, the tablet weight (Wt) varied around a target weight of 400 mg, and the tablet weight variation as measured by the RSD% ranged from 0.6% to 2.1%. This narrow range, which meets the QTPP, was seen for all 12 experimental runs; these results show that roller compaction significantly improves powder flow. Recalling that the ciprofloxacin has a Carr Index of ∼48 (see Table VI) which is characteristic of materials that have poor flow. These results are consistent with our preliminary studies that found direct compression formulations could not meet weight or content uniformity requirements. The effect of each variable shown in Table IV was calculated, rank ordered, and plotted in a half-normal probability plot (5,18,20). Visual inspection of the Wt RSD% in Fig. 5a, indicates that the ciprofloxacin particle size may lie outside of the distribution; however, when the t value (Fig. 5b) for the effects was calculated, this had a t value < 2.22. Therefore, for these formulations and processing conditions, none of the 11 variable significantly affected the Wt RSD%.
Fig. 5.
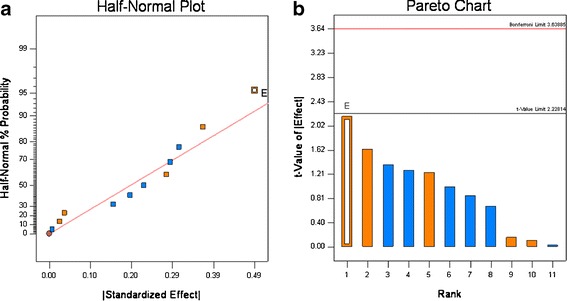
Half-normal (a) and Pareto plots (b) of rank ordered coefficient of critical quality attributes for weight variation RSD%
Tablet Breaking Force
The tablet breaking force ranged from 9.1 to 18.6 kiloponds (kp) with the variability in the formulation and process variables (see Tables IV and VI). For these 12 experiments, only one run was outside of the QTPP. The effect of each variable tested in Table IV was assessed by plotting the observed values on a half-normal % probability plot (see Fig. 6a); this graph shows that two parameters had a significant effect on breaking force, and they were roller pressure and tablet compression force. The visual observations were confirmed by t test (Fig. 6b) which also showed these parameters had statistically significant effects on breaking force. The raw data showed that roll pressure has a positive effect on the tablet breaking force, indicating a decrease in tablet hardness with increase in roll pressure. This can be explained by the “loss of compressibility” of the microcrystalline cellulose (Avicel®) at higher roll pressures resulting in decreased tablet hardness on subsequent compaction on the tablet press. This phenomena has been is well-known for microcrystalline cellulose undergoing roller compaction, see Sun et al. (23,24). The increase in tablet breaking force with compression force (Pmax) can be explained by the higher degree of compaction resulting in a tablet with higher tensile strength and a correspondingly higher tablet breaking force; these findings are consistent with numerous studied reported in the literature (15,16).
Fig. 6.
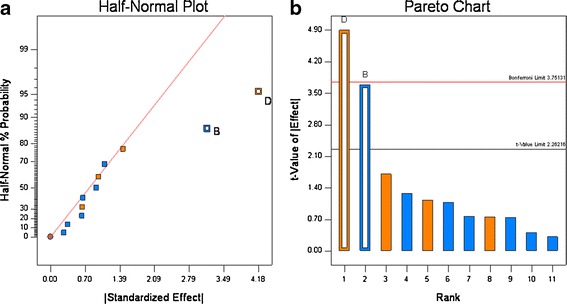
Half-normal (a) and Pareto plots (b) of rank ordered coefficient of critical quality attributes for tablet breaking force. Compression force (B) and roll pressure (D) were found to be significant
Tablet Disintegration and Dissolution
For the 12 experiments, the disintegration time varied from 1 to 53 min, and the amount that dissolved in 30 min (Q30) ranged from 37% to ∼100% (see Table VI). The dissolution graphs are shown in Fig. 7. These results show the formulation and processing conditions can significantly affect product quality, as six runs failed disintegration and five runs failed dissolution. Based upon rank order, the data show that disintegration and Q30 dissolution are highly correlated, as five of six experiments that failed disintegration also failed dissolution (see Table VI). The half-normal probability plots show that for disintegration, HPC grade, and compression force significantly affected disintegration, and the t test showed that HPC grade was highly significant, compression force was slightly significant (see Fig. 8a, b). For Q30 dissolution, the normal probability plots showed that HPC grade was highly significant, which was confirmed by the t test (see Fig. 9a and b).
Fig. 7.
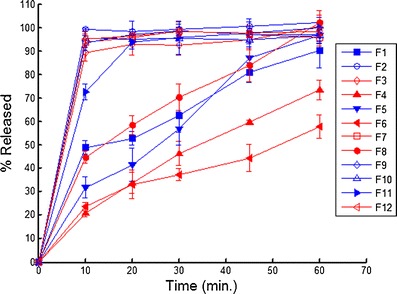
Dissolution profiles for the 12 experimental runs. The closed symbols correspond to the HPC EXF (+1 in PB), open symbols correspond to the HPC JF (−1 in PB), the red lines correspond to 16 kN Pmax (−1 in PB) and the blue lines correspond to 12 kN Pmax (−1 in PB)
Fig. 8.
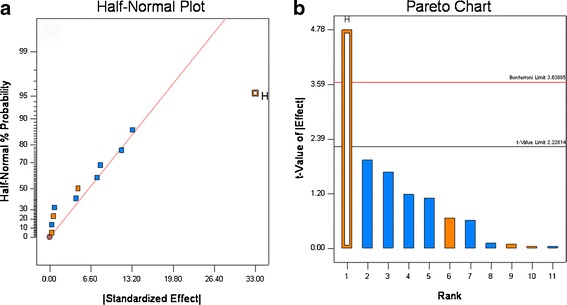
Half-normal (a) and Pareto plots (b) for disintegration time. Binder grade (H) was found to be significant
Fig. 9.
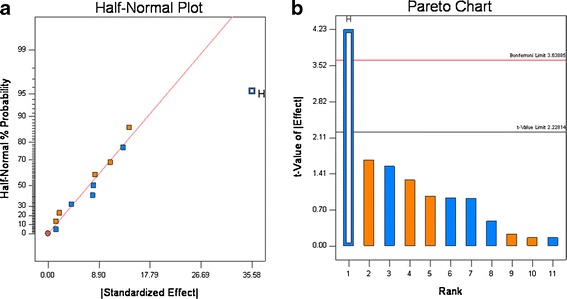
Half-normal (a) and Pareto plots (b) for Q30 dissolution. Binder grade (H) was found to be significant
Examination of the data in Fig. 8 and Table VI shows that disintegration is the most important factor controlling dissolution. For the samples that passed dissolution, the average disintegration time was 4.1 ± 4.2 min and for the samples that failed dissolution the average disintegration time was 39.0 ± 12.4 min. These results match our empirical observation of dissolution; all the tablets that had rapid release quickly disintegrated in the dissolution apparatus, and all the tablets that had slow release remained intact in the dissolution media. The two grades of Klucel® used in the study differ in three properties. Klucel® JF has higher molecular weight, viscosity, and particle size than Klucel® EXF. The EXF grade produced much slower release; thus, differences in the molecular weight, viscosity, particle size, and wetting characteristics in the tablet matrix governed tablet disintegration time which drastically slowed dissolution for Klucel® EXF compared to JF. This is illustrated in Fig. 7, where all the formulation containing EXF have closed symbols, and of these only one met the release specification.
The raw data showed that increasing compression force was also found to be positively correlated to disintegration time (see Table VI). At higher compression forces, there is a greater volume reduction during tableting resulting in denser tablet matrixes that hold the tablet together more tightly, and reduce water uptake properties, which results in longer disintegration times. Similar results have been observed by Massimo et al. (25).
CONCLUSIONS
Starting with literally 100 s of possible CQAs that could affect product quality (see Fig. 2) preliminary feasibility studies and FMEA were used to reduce the number of possible attributes down to 11 factors (see Table II). Then a PB screening design was used to determine the significant main effects among these 11 factors with only 12 experiments, which compared to a full fractional designs that would have 211i.e. 2,048 experiments. The granule properties (particle size, bulk density, tapped density, and Carr index) and the tablets (weight variation, breaking force, disintegration time, and dissolution time) were evaluated to identify which of the 11 factors affected tablet quality.
It was found that compression force and roller pressure were the most important parameters affecting tablet breaking force. Klucel® grade and Pmax were the most critical factors governing cipro release, i.e., disintegration and Q30 dissolution. In terms of granule properties (particle size, bulk density, and Carr index), roller pressure is critically affecting both particle size and the Carr Index. Mg stearate type and glidant level also affected particle size and the Carr index, respectively. These results are consistent with observations made during initial feasibility studies. Thus, these parameters and their interactions warrant further study using higher resolution statistical designs. On the other hand, weight variation was not influenced by the formulation and process variables studied. In addition, several factors such as granulator speed, roll speed to feed screw speed (RS/FSS), microcrystalline cellulose particle size, and mixing time (5- vs 20-min lubricant mixing) did not influence the QTPP, and can be assigned to a lower risk category requiring less scrutiny.
In summary, scientific rationale and quality risk management analysis were used to successfully and efficiently determine the CQAs coming from the formulations and the manufacturing processes.
ACKNOWLEDGMENTS
This work was carried out with the scientific and financial support provided by the Food and Drug Administration.
REFERENCES
- 1.ICH. Q8(R2) pharmaceutical development. Part I: pharmaceutical development, and. Part II: annex to pharmaceutical development. http://www.ich.org/fileadmin/Public_Web_Site/ICH_Products/Guidelines/Quality/Q8_R1/Step4/Q8_R2_Guideline.pdf (2009). Accessed 1 Aug 2012.
- 2.ICH. Q9 quality risk management. http://www.ich.org/fileadmin/Public_Web_Site/ICH_Products/Guidelines/Quality/Q9/Step4/Q9_Guideline.pdf (2005). Accessed 1 Aug 2012.
- 3.ICH. Q10 pharmaceutical quality system. http://www.ich.org/fileadmin/Public_Web_Site/ICH_Products/Guidelines/Quality/Q10/Step4/Q10_Guideline.pdf (2008). Accessed 1 Aug 2012.
- 4.Huang J, Kaul G, Cai C, Chatlapalli R, Hernandez-Abad P, Ghosh K, et al. Quality by design case study: an integrated multivariate approach to drug product and process development. Int J Pharm. 2009;382(1–2):23–32. doi: 10.1016/j.ijpharm.2009.07.031. [DOI] [PubMed] [Google Scholar]
- 5.Plackett R, Burman J. The design of optimum multifactorial experiments. Biometrika. 1946;33:305–325. doi: 10.1093/biomet/33.4.305. [DOI] [Google Scholar]
- 6.Stamatis DH. Failure mode and effect analysis: FMEA from theory to execution. 2. Milwaukee: ASQ Quality Press; 2003. p. 459. [Google Scholar]
- 7.Gupta A, Peck G, Miller R, Morris K. Nondestructive measurements of the compact strength and the particle-size distribution after milling of roller compacted powders by near-infrared spectroscopy. J Pharm Sci. 2004;93(4):1047–1053. doi: 10.1002/jps.20003. [DOI] [PubMed] [Google Scholar]
- 8.Gupta A, Peck G, Miller R, Morris K. Influence of ambient moisture on the compaction behavior of microcrystalline cellulose powder undergoing uni-axial compression and roller-compaction: a comparative study using near-infrared spectroscopy. J Pharm Sci. 2005;94(10):2301–2313. doi: 10.1002/jps.20430. [DOI] [PubMed] [Google Scholar]
- 9.Gupta A, Peck G, Miller R, Morris K. Real-time near-infrared monitoring of content uniformity, moisture content, compact density, tensile strength, and Young’s modulus of roller compacted powder blends. J Pharm Sci. 2005;94(7):1589–1597. doi: 10.1002/jps.20375. [DOI] [PubMed] [Google Scholar]
- 10.Carr R. Evaluating flow properties of solids. Chem Eng. 1965;72:163–168. [Google Scholar]
- 11.Escribano E, Calpena A, Garrigues T, Freixas J, Domenech J, Moreno J. Structure-absorption relationships of a series of 6-fluoroquinolones. Antimicrob Agents Chemother. 1997;41:1996–2000. doi: 10.1128/aac.41.9.1996. [DOI] [PMC free article] [PubMed] [Google Scholar]
- 12.Olivera ME, Manzo RH, Junginger HE, Midha KK, Shah VP, Stavchansky S, et al. Biowaiver monographs for immediate release solid oral dosage forms: ciprofloxacin hydrochloride. J Pharm Sci. 2011;100(1):22–33. doi: 10.1002/jps.22259. [DOI] [PubMed] [Google Scholar]
- 13.Claycamp HG. Perspective on quality risk management of pharmaceutical quality. Drug Inf J. 2007;41(3):353–367. doi: 10.1177/009286150704100309. [DOI] [Google Scholar]
- 14.Haimes YY. Risk modeling, assessment, and management. 2. New York: Wiley; 2004. p. 1012. [Google Scholar]
- 15.Dave VS, Fahmy RM, Bensley D, Hoag SW. Eudragit® RS PO/RL as rate-controling matrix-formers via roller compaction: influence of formulation and process variables on functional attributes of granules and tablets. Drug Dev Ind Pharm. 2012;38(10):1240–53. [DOI] [PubMed]
- 16.Dave VS, Fahmy RM, Hoag SW. Investigation of the physical-mechanical properties of Eudragit® RS PO/RL PO and their mixtures with common pharmaceutical excipients. Drug Dev Ind Pharm. 2012 (in press). [DOI] [PubMed]
- 17.Ishikawa K. What is total quality control? The Japanese way. (Lui, D.J. Translator). Englewood Cliffs: Prentice-Hall; 1985.
- 18.Dejaegher B, Heyden YV. Supersaturated designs: set-ups, data interpretation, and analytical applications. Anal Bioanal Chem. 2008;390(5):1227–1240. doi: 10.1007/s00216-007-1641-0. [DOI] [PubMed] [Google Scholar]
- 19.Box GEP, Hunter WG, Hunter JS. In: Statistics for experimenters: an introduction to design, data analysis, and model building. Shewhart WA, Wilks SS, editors. New York: Wiley; 1978. p. 653. [Google Scholar]
- 20.Vander Heyden Y, Nijhuis A, Smeyers-Verbeke J, Vandeginste BGM, Massart DL. Guidance for robustness/ruggedness tests in method validation. J Pharm Biomed Anal. 2001;24(5–6):723–753. doi: 10.1016/S0731-7085(00)00529-X. [DOI] [PubMed] [Google Scholar]
- 21.Hamad M, Gupta A, Shah R, Lyon R, Sayeed V, Khan M. Functionality of magnesium stearate derived from bovine and vegetable sources: dry granulated tablets. J Pharm Sci. 2008;97(12):5328–5340. doi: 10.1002/jps.21381. [DOI] [PubMed] [Google Scholar]
- 22.He X, Secreast PJ, Amidon GE. Mechanistic study of the effect of roller compaction and lubricant on tablet mechanical strength. J Pharm Sci. 2007;96(5):1342–1355. doi: 10.1002/jps.20938. [DOI] [PubMed] [Google Scholar]
- 23.Sun CQ, Himmelspach MW. Reduced tabletability of roller compacted granules as a result of granule size enlargement. J Pharm Sci. 2006;95(1):200–206. doi: 10.1002/jps.20531. [DOI] [PubMed] [Google Scholar]
- 24.Sun CQC. On the mechanism of reduced tabletability of granules prepared by roller compaction. Int J Pharm. 2008;347(1–2):171–172. doi: 10.1016/j.ijpharm.2007.10.002. [DOI] [PubMed] [Google Scholar]
- 25.Massimo G, Santi P, Colombo G, Nicoli S, Zani F, Colombo P, et al. The suitability of disintegrating force kinetics for studying the effect of manufacturing parameters on spironolactone tablet properties. AAPS PharmSciTech. 2003;4(2):article 17. doi: 10.1208/pt040217. [DOI] [PMC free article] [PubMed] [Google Scholar]


