Abstract
Rosiglitazone (Rosi) is a drug in the thiazolidinedione class for treatment of Type 2 diabetes mellitus (T2DM), which binds and activates PPARγ nuclear receptor in fat cells, sensitizing them to insulin. Despite proven antidiabetic efficacy, Rosi therapy may be associated with trabecular bone loss and an increased risk of fractures. To examine the potential side effects of Rosi treatment on bone formation, we delivered Rosi to mice using a combined model of distraction osteogenesis (DO) and Type 2 Diabetes Mellitus (T2DM). DO provides a unique method to isolate the sequence of intramembranous bone formation, an important component of both fracture healing and bone homeostasis. Four groups of n=6 mice were used to compare the effects of Rosi on bone formation and cellular composition in both diabetic (Avy/a strain) and non-diabetic mice (a/a strain). New bone formation was examined by high resolution radiographs, micro-computed tomography, and histology. Precursor cells in the distraction gap were quantitated using immunohistochemical stains for proliferating cell nuclear antigen. Committed osteoblasts and adipocytes in the gap were identified and quantitated by immunostaining for osteocalcin and FABP4/aP2, respectively. The diabetic model developed obesity, hyperglycemia, hyperinsulinemia and insulin resistance while the control littermates remained lean, normoglycemic and insulin sensitive. Rosi treatment decreased levels of nonfasted glucose and insulin and improved insulin sensitivity in the Avy/a mice, but had no effect in a/a mice, indicating antidiabetic efficacy of Rosi at the tested dose. Despite the diabetic, obese mice having twice the number of fat cells in their marrow than the non-diabetic mice, bone formation using DO was not adversely affected by the diabetes itself. However, Rosi treatment significantly diminished intramembranous endosteal bone formation, while increasing adipogenesis in and adjacent to the distraction gap up to 3.5–3.8 fold in both diabetic and non-diabetic models. This effect was independent of the anti-diabetic therapeutic response. These results raise the question of whether osteoblast precursors are inhibited in their development or actually converted to adipocytic phenotypes, possibly via marrow fat PPARγ nuclear receptor.
Keywords: Rosiglitazone, Adipogenesis, Distraction Osteogenesis, Diabetes
1.0 Introduction
1.1 Objectives
To test the potential effects of type 2 diabetes mellitus (T2DM) and of the glucose regulating drug Rosiglitazone (Rosi) on bone repair, we used a unique genetic model (Avy/a) simulating T2DM with our established model for quantitating in vivo cellular contributions to de novo endosteal bone formation (ENB) both at the site of distraction osteogenesis in the tibia and in the local bone marrow.
1.2 Background
1.21 Thiazolidinediones
Drugs from the thiazolidinedione (TZD) family for treatment of Type 2 Diabetes Mellitus (T2DM) are thought to increase the risk of fracture occurrence [1–5]. The negative effect of TZDs on bone mass (bone homeostasis) has also been demonstrated in humans and animals [6, 7]. Studies using in vitro cell models demonstrate that TZD-activated PPAR acts as a negative regulator of osteoblastic and as a positive regulator of adipocytic lineage[8–10]. Animal studies have shown that the protein target for TZDs, a transcription factor peroxisome proliferator activator receptor gamma (PPARγ), is expressed in both mesenchymal (MSC) and hematopoietic (HSC) stem cells found in the marrow and regulates lineage commitment toward osteoblasts and osteoclasts, respectively [10–12].
1.22 Combined animal models
To better understand the histological basis of the Rosiglitazone (Rosi) effects on in vivo bone formation, we utilized a unique model combining tibial distraction osteogenesis (DO) in diabetic Avy/a mice.
1.23 Distraction osteogenesis (DO)
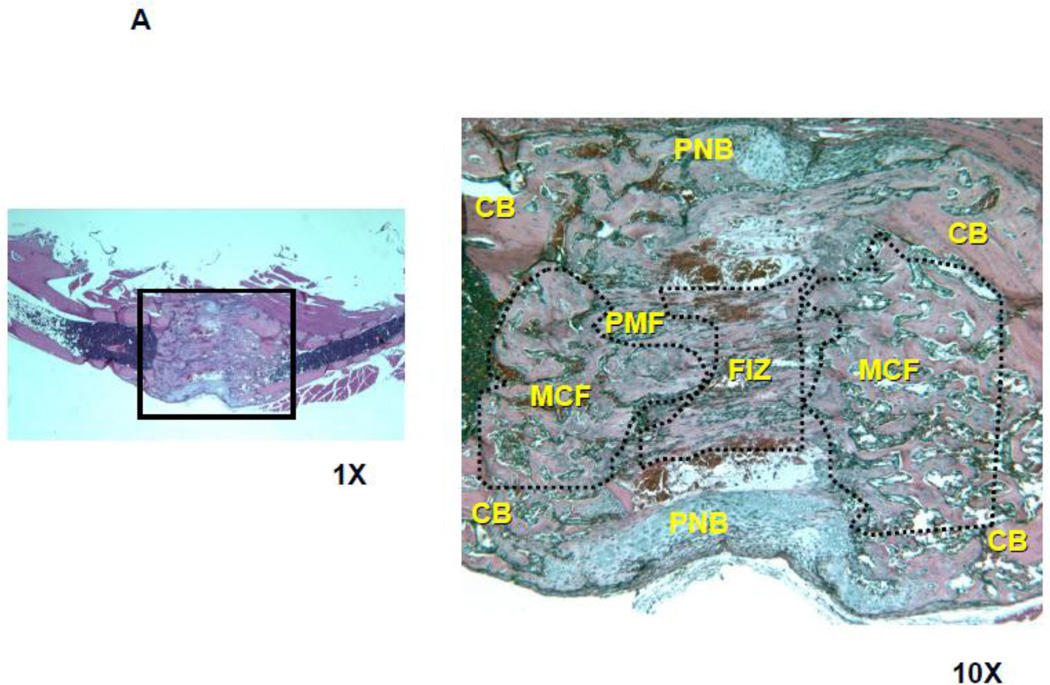
DO, a clinical tool for regenerating bone loss, has been developed in several animal species including dogs, rabbits, rats and mice [13]. A pre-determined gap is created from a surgical osteotomy site in the tibia using a scaled ring external fixator to mechanically distract the bone ends. Depending on the species, the distance of distraction exceeds the critical gap for spontaneous fracture healing, usually 15% of the baseline bone length, while the rate of distraction is critical to produce de novo bone which eventually bridges the gap. For mice, the distraction rate is 0.075mm twice a day for 14 days which results in a 15% lengthening. The new bone, unlike fracture healing, forms from uniform and reproducible zones of primarily intramembranous or direct bone formation that can be quantitated by radiodensity and decalcified histology[14–17]. From distinct proliferation zones of precursor cells, immature osteoblasts line the surface and then are incorporated within bone trabeculae exhibiting different stages of osteoblast (OB) cell maturation (see Figure 3A) [14–16]. The local host bone cortices geographically isolate periosteal (PNB) from endosteal (ENB) new bone formation[18–21]. Since both the cambium layer of periosteum and the local marrow are known to contain osteoblastic precursor cells, it appears from these models that precursor cells for ENB are supplied from the local marrow and for PNB from the adjacent cambium layer. We have determined that ENB is more sensitive to adverse factors (e.g., aging, alcohol, TNF alpha ) and can be measured to decrease significantly prior to any changes in PNB, reflecting morphological changes in the local marrow[15–17,21].
Figure 3.
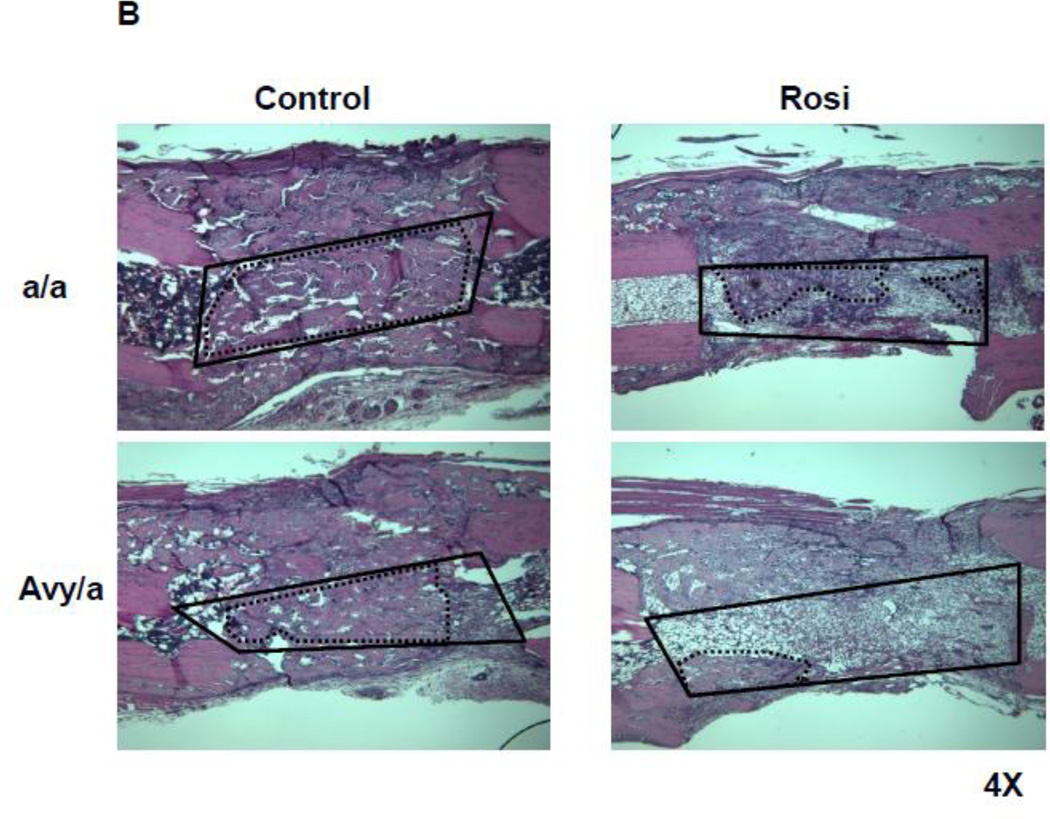
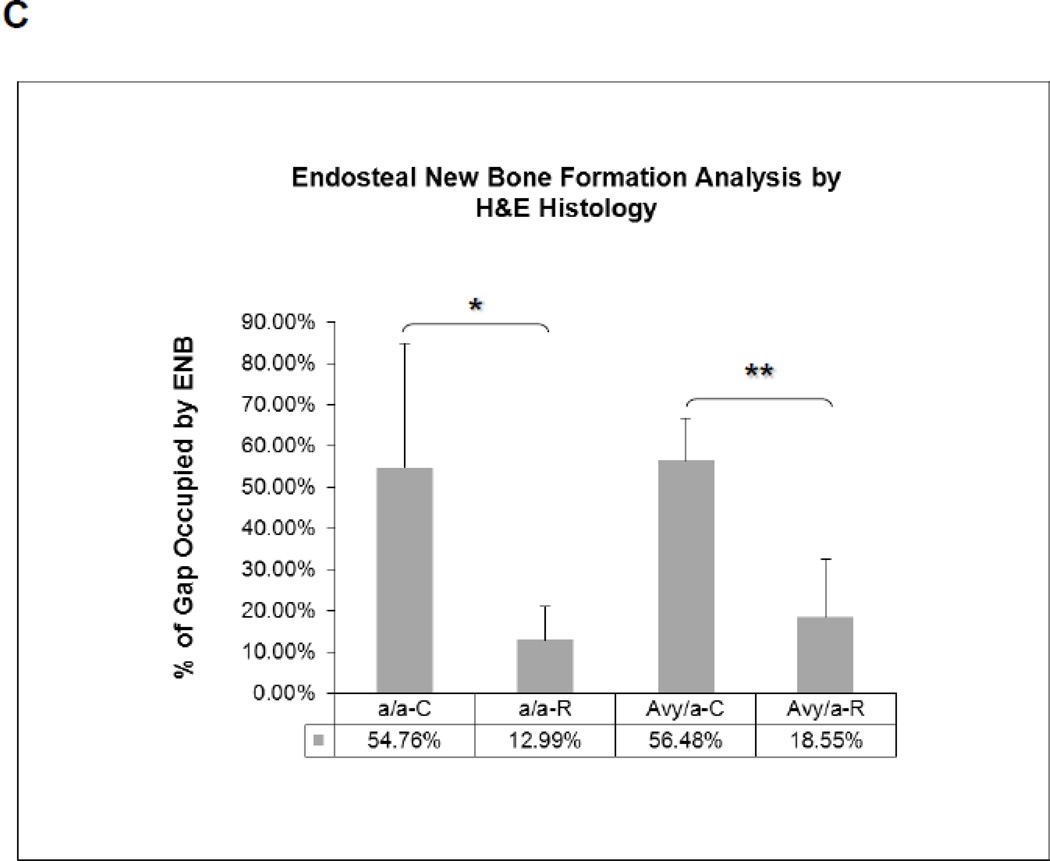
Histologic comparison of the distraction gaps in the four test groups (a/a, Avy/a, Untreated “C”, Rosi treated “R”). A. Typical specimen H&E stain at 1x and then 10x to demonstrate the zones of bone formation. The FIZ is a radiolucent fibrous interzone [14–17]. At the junctions of the proximal and distal FIZ, concentrated zones of cell proliferation occur at the tip of each new bone trabeculum, termed the primary matrix front (PMF)[14–17]. Following proliferation, these cells migrate to local type 1 collagen produced by fibroblasts in the FIZ and begin to lay down osteoid matrix. New cells are added to each trabeculum incorporating the surface osteoblasts into the matrix, expanding to uniform diameters of 100–150 microns, termed the zone of microcolumn formation (MCF)[14–17]. These are labeled and outlined on the histological specimen: FIZ, PMF and MCF proximal and distal within the box square region of interest. B. Representative images from each group, Proximal is left to distal right. The ENB (dotted) within the endosteal distraction gap (solid) is outlined . Magnif. 4×. Hematoxylin-eosin stain of decalcified mid-sagittal sections. Note that proximal and distal host bone cortices separate ENB from PNB. C. Comparison by % of gap occupied by ENB in the 4 groups, (a/a, Avy/a, Untreated “C”, Rosi treated “R”). Note that the percentages compare favorably to the ENB measured by microCT in Figure 4C. * p < 0.05; ** p < 0.01.
1.3 Hypotheses
Since diabetic patients have exhibited bone healing problems, we hypothesized that 1) the diabetic mouse model would have relatively less ENB by DO than the non-diabetic controls. Based on in vitro work using Rosi, we also hypothesized that Rosi treatment would: 2) significantly decrease the actual de novo bone formation within the distraction gap, 3) significantly alter the adjacent marrow cell composition and 4) significantly alter the orderly sequence of osteoblastic maturation histologically.
2.0 Materials and Methods
2.1 Animal Model
The agouti mouse model of human T2DM, Avy and its control a/a strain, have been described previously [22, 23]. The Avy male mice are phenotypically yellow, obese and develop hyperglycemia, hyperinsulinemia, glucose intolerance and insulin resistance by 8 weeks of age. The non-diabetic mice, also from the agouti strain with the a/a genotype, are phenotypically black, lean, normoglycemic and insulin sensitive[23]. The colony of these mice have been maintained at the University of Arkansas for Medical Sciences (UAMS) and kindly provided by Dr. Craig A. Cooney (Department of Biochemistry and Molecular Biology, UAMS) [23].
A total of 24 mice were used. Mice with each phenotype were then randomly divided into groups of n=6. Our prior work, using the mouse model of tibial DO with radiographic and histological methods to quantitate de novo ENB, has confirmed that n=6 per group sustains enough power for statistical significance[24].
The control groups were fed regular chow and the treated groups were fed chow supplemented with Rosi (Avandia, GlaxoSmithKline, King of Prussia, PA) at the recommended dose of 16 µg per gram body weight per day. Rosi treatment was initiated 2 weeks prior to the tibial lengthening osteotomy and was continued for the next 2 weeks of distraction. Body weights, food intake, basal glucose levels, and insulin tolerance were measured at the beginning and at the end of experiment using Accu-Chek active dabetic test strips, purchased from Hoffmann-La Roche Ltd, USA.
2.2 Surgical Protocol
The Institutional Animal Care and Use Committee (IACUC) of the University of Arkansas for Medical Sciences approved all research protocols. Each mouse was anesthetized with Nembutal and underwent placement of a custom, scaled two-ring external fixator spanning a mid-shaft osteotomy of the left tibia, as previously described[15,16,19–21]. All mice received an intramuscular injection of Buprenex (0.1mg/kg) immediately after operation for analgesia and were recovered under observation. Mice were then housed in individual cages in temperature (22°C) and humidity (50%) controlled rooms having a 12 h light/ 12 h dark cycle. Manual distraction began 1 day after the osteotomy (24 hour latency) at a rate of 0.075mm twice a day (0.15mm/day) and continued for 14 days for a 2.1mm (15%) lengthening. Sacrifice of mice was carried out with carbon dioxide (CO2) inhalation at the end of 14 days distraction. Both tibiae (distracted and contralateral) were harvested for radiographic, micro CT analyses, and histological study.
2.3 Radiographic Analysis
After 48 hours of fixation in 10% neutral buffered formalin the left tibiae were removed from the fixators for high-resolution single beam radiography using a Xerox Micro50 closed system radiography unit (Xerox, Pasadena, CA USA) at 25 kilovolts (3 mA) for 20 seconds using Kodak X-OMAT film. For quantification, the radiographs were video recorded under low power (1.25 X objective) magnification and the area and density of mineralized new bone in the distraction gaps were evaluated by NIH Image Analysis 1.62 software as previously described[16,25]. Briefly, the distraction gap was outlined from the outside corners of the two proximal and the two distal cortices, forming a quadrilateral region of interest (ROI). The mineralized new bone area in the gap was determined by outlining regions with radiodensity equivalent to or greater than the adjacent medullary bone. The percentage of new mineralized bone within the distraction gap (percent new bone) was calculated by dividing mineralized bone area by total gap area. The percentage of new bone density within the distraction gap was calculated by dividing it by adjacent host bone density with a gray density threshold. This method actually measures both periosteal and endosteal new bone within the gap, since the linear x-ray beam crosses all new bone. In order to isolate endosteal new bone (ENB) which is directly adjacent to the local marrow elements, microCT and histology analysis are required.
2.4 Micro CT analysis of DO gap
Representative specimens of distracted tibiae were determined from the 2-dimensional (2-D) radiographs and imaged by micro computed tomography (µCT) using a µCT-40 (Scanco, Bassersdorff, Switzerland) and the manufacturer’s supplied software. Approximately 200 contiguous axial (cross sectional) slices including the entire distraction gap and at least 0.5 mm of both proximal and distal host bone were obtained at 55kV and 70µA with a voxel size of 12.4 m in all dimensions. Endosteal gap volume was defined as the volume of a cylinder approximating the shape and volume of the marrow cavity between the proximal and distal ends of the host cortices and endosteal new bone (ENB) was defined as bone residing within the endosteal gap volume as previously described [20]. The µCT findings were correlated to histological findings in selected animals.
2.5 Histological Analysis
The distracted and contralateral tibiae were decalcified in 5% formic acid, dehydrated and embedded in paraffin. Longitudinal (coronal) sections with thickness of 5–7 m were cut on a microtome (Leitz 1512, Wetzlar, Germany) and stained with hematoxylin and eosin. Sections were selected to represent a central gap location from the mid-sagittal plane including all four cortices and medullary canal proximally and distally. The distraction gap area was outlined from the outside corners of proximal and distal cortices forming a quadrilateral region of interest. Endosteal new bone formation (ENB) in the DO gap was outlined from the marrow space and the inside corners of the cortices adjacent to the medullary canals, and the area of ENB was measured as previously described[15,16,19–21]. The percentage of ENB area within the DO gap (percent new bone) was calculated by dividing ENB area by gap area[15,16,19–21].
To investigate the potential relationship between bone formation and local adipogenesis during DO, the mid-sagittal distraction gap including adjacent host bone surfaces with marrow contents were video-recorded from proximal to distal as a series of contiguous regions of interest (ROI) under 10X magnification. The images were imported into the NIH Image Analysis program. Using gray density thresholding, the fat cells and nucleated marrow cells were easily differentiated and the relative area of each constituent in the marrow (fat vs nucleated precursor cells) was then measured, as previously described[25]. The percentage of marrow occupied by fat cells for each specimen was then calculated by dividing the fat area by the total area of ROI[25].
Considering that the surgical osteotomy might affect the local marrow, we also examined the contralateral tibia marrow histology in the mid-shaft at the same site of osteotomy.
2.6 Immunohistochemistry
The primary polyclonal antibody specific to adipocytes (FABP4/aP2, #12802-1-AP) was purchased from Protein Tech Group, Inc. (Chicago, USA). A control antibody which differentiates macrophages that are falsely positive for aP2 is F4/80 (#ab6640) and was purchased from ABCAM Inc. (Cambridge, MA, USA). Osteocalcin (#ALX-210-333) was purchased from Alexis Biochemical Inc. (San Diego, USA). Proliferating cell nuclear antigen PCNA (#sc-7907) was purchased from Santa Cruz Biotechnology, Inc. (Santa Cruz, CA, USA). Non-immune serum, non-immune IgGs (rabbit, goat, rat) and biotinylated secondary antibody were purchased from Vector Laboratories (Burlingame, CA, USA).
Immunohistochemistry was performed by a streptavidin-biotin immunoperoxidase method. Decalcified sections were deparaffinized and rehydrated , incubated in 80°C in 1X Antigen Retrieval Citra (Biogenex, San Ramon, CA) for 15 minutes to retrieve epitopes, rinsed in phosphate buffered saline (PHS) with 0.02% Triton-X 100 for three minutes to permeabilize the tissue. After washing, slides were incubated with Peroxiblock (Zymed, San Francisco, CA) for 20 minutes to block endogenous peroxidase activity, followed by incubation with a 10% normal serum corresponding to the species from which the secondary antibody was generated for 30 minutes to block non-specific binding. The primary antibody specific to osteocalcin (diluted 1:400) or normal rabbit IgG (for negative control, diluted 1:400) was applied and incubated overnight at 4°C. After washing, a biotinylated secondary antibody (diluted 1:100) was applied and incubated at room temperature for 30 minutes, following by the application of HRP conjugated streptavidin for 20 minutes. Color was developed using ImmPACT™ DAB (Vector Labs, Burlingame, CA). The sections were then counterstained with hematoxylin, dehydrated, and mounted using permanent mounting media. Same protocol was done to all samples with different primary antibodies specific to FABP4/aP2 (diluted 1:200), F4/80(diluted 1:200), and PCNA (diluted 1:100).
2.7 Semi-Quantitation of cells stained positively for PCNA, FABP4/aP2, and Osteocalcin
The immunohistochemical stained slides were examined under bright-field microscopy. Digital pictures were captured at 40X magnification using a Spot Insight TM digital camera (Diagnostic Instruments Inc. MI, USA) and the Spot Insight TM software package. Quantitation of cells stained positively for PCNA, FABP4/aP2, and Osteocalcin was performed for specific DO zones or anatomical regions as previously described[17,18,25,26]. PCNA positive cells in the zone of primary matrix front (PMF) were calculated for the quantitative analysis of proliferating cells during DO. Adipocyte protein (aP2) positive cells in the zone of primary matrix front (PMF) and bone marrow adjacent to distraction gap were counted to calculate local adipogenesis during DO. F4/80-positive cells in contiguous sections were compared to aP2 stained cells to distinguish the aP2 positive adipocytes from macrophages. Osteocalcin stain (OC) was performed as a marker for osteoblasts on similar sections, to quantitate these cells in the zones of PMF and MCF.
2.8 Statistical methods
The correlation between area of new bone formation and the area of adjacent marrow fat or nucleated cells was analyzed with Pearson correlation coefficient by SPSS software. Statistical differences between groups for all radiographic and histological analyses were performed using paired Student's t-test. The counts of stained cells in a specific region were averaged per specimen and the means were statistically compared for equivalent regions in other specimens. ENB from μCT measurements were correlated between groups using two-way ANOVA. All data are reported as the mean the standard error of the mean (SEM), and differences are considered statistically significant when p < 0.05.
3.0 Theory/calculation
It is the mechanism of Rosi on precursor cells, known to exist in the bone marrow that constitutes the primary focus of this research. Based on prior in vitro work, the PPARγ receptor may be a critical regulator which determines the cellular differentiation pathway of certain mesenchymal stem cells in the marrow. Our prior in vivo work strongly implicates the local marrow as the primary source of osteoblastic precursors which populate the de novo ENB using DO. Using other conditions such as “aging”, we have documented that marrow transformation from primarily nuclear constituents to primarily fat cell constituents, is strongly correlated to poor ENB. If the local marrow cell population controls ENB during bone repair, we might also assume that the marrow controls ENB during normal remodeling associated with bone homeostasis. Therefore, understanding a function of PPARγ nuclear receptor within stem cells and potential pharmacological controls for it, might provide important insights for pharmacological treatment of more systemic conditions such as senile osteoporosis.
4.0 Results
4.1 T2DM model
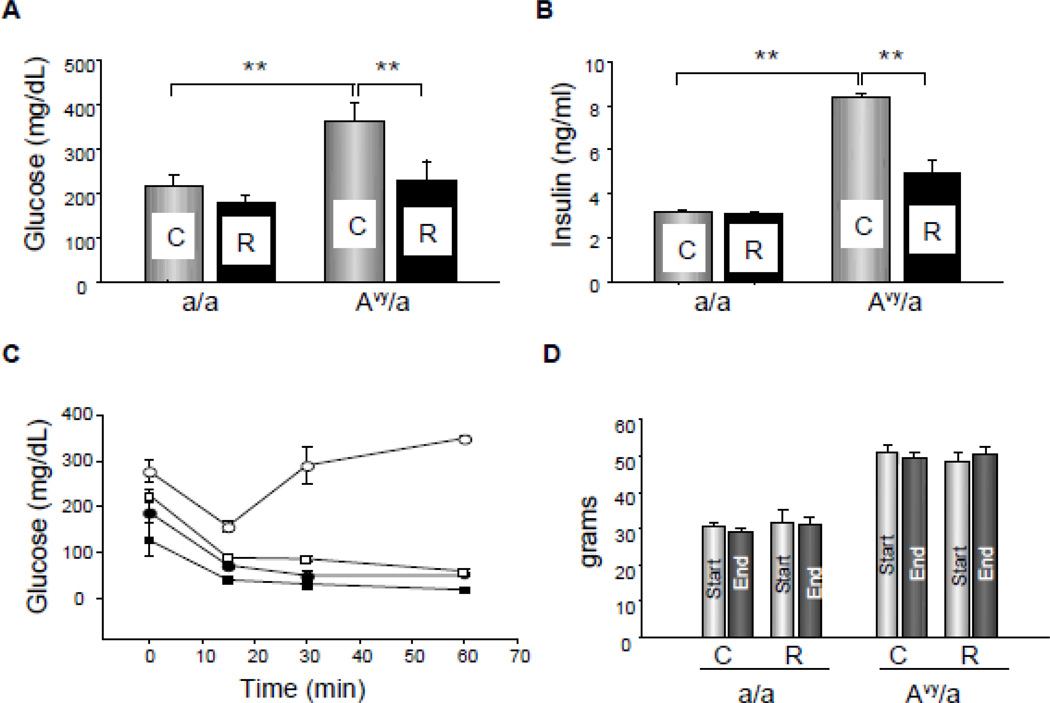
Twenty-three of 24 mice survived until sacrifice without complication of infection. One of Rosi treated Avy diabetic mouse died within 48 hours of surgery from anesthetic complications. Avy mice were confirmed to be hyperglycemic, hyperinsulinemic and insulin resistant by age 8 weeks and then until completion of the experiment was initiated (Fig. 1A,B). The a/a, lean mates were normoglycemic and insulin sensitive. Rosi treatment decreased levels of non-fasted glucose and insulin, and improved insulin sensitivity in diabetic Avy mice but had no effect in normoglycemic a/a mice, indicating antidiabetic efficacy of Rosi at the tested dose (Fig. 1C). All mice maintained baseline body weight changes during the experiment (Fig. 1D).
Figure 1.
Metabolic parameters of a/a and Avy/a mice after 4 weeks administration of rosiglitazone. A. Non-fasted levels of blood glucose. B. Serum levels of insulin. (In A and B: gray bars – untreated, control mice “C”; black bars – rosiglitazone treated mice “R”). C. Insulin sensitivity measured in intraperitoneal insulin tolerance test (IPITT) (black circles – a/a untreated; black squares – a/a rosiglitazone treated; white circles - Avy/a untreated; white squares - Avy/a rosiglitazone treated). D. Body weight. (light gray bars – at the start of experiment; dark gray bars – 4 weeks later, at the end of experiment). ** p < 0.01
4.2 Radiography and MicroCT
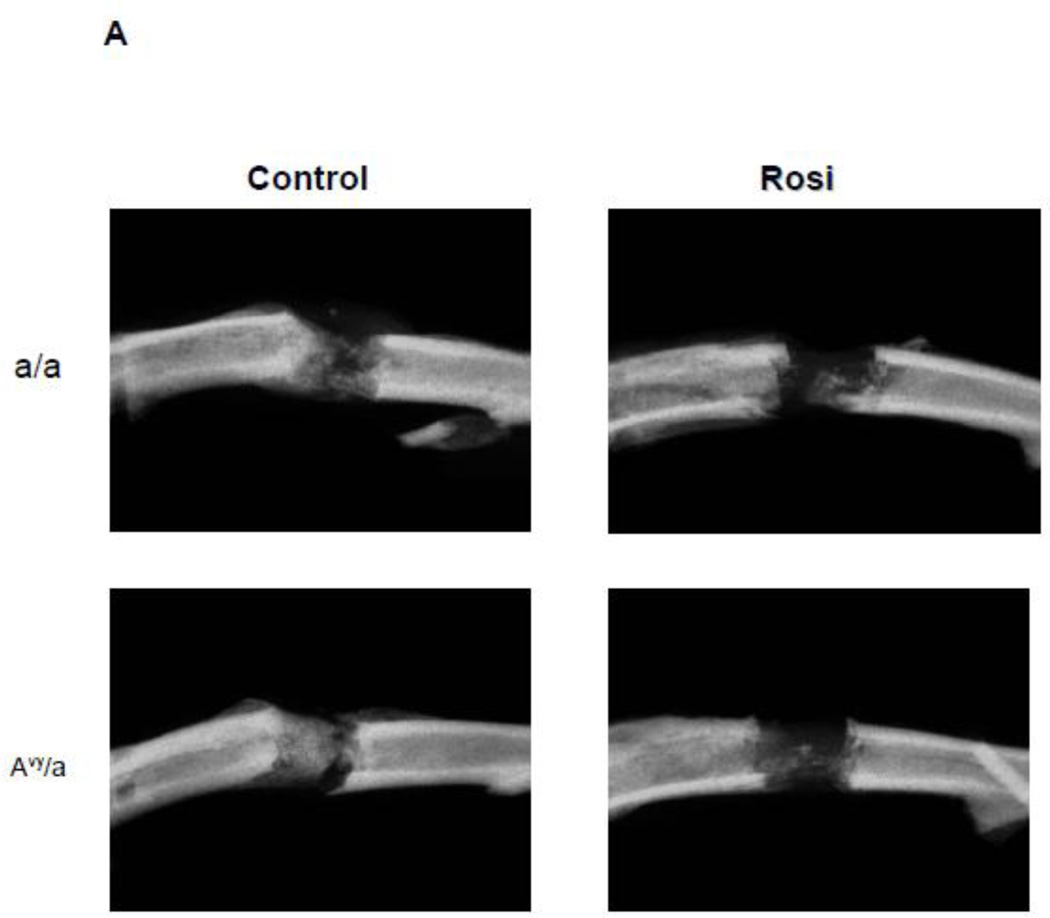
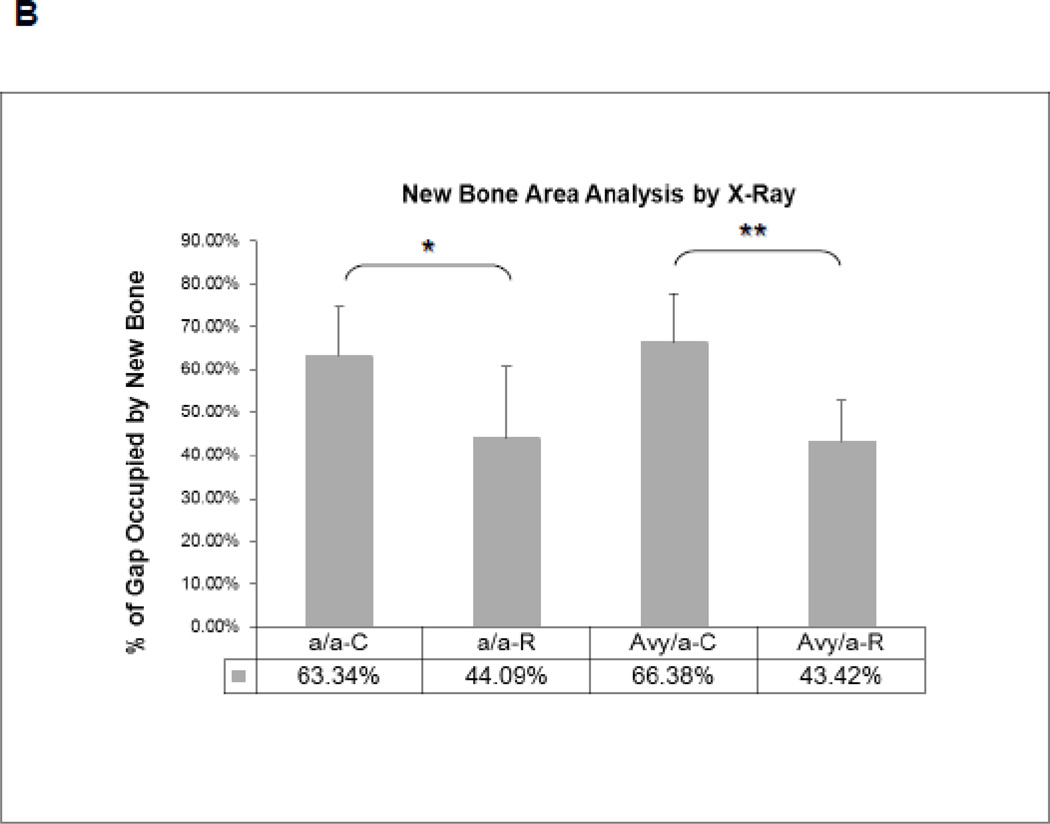
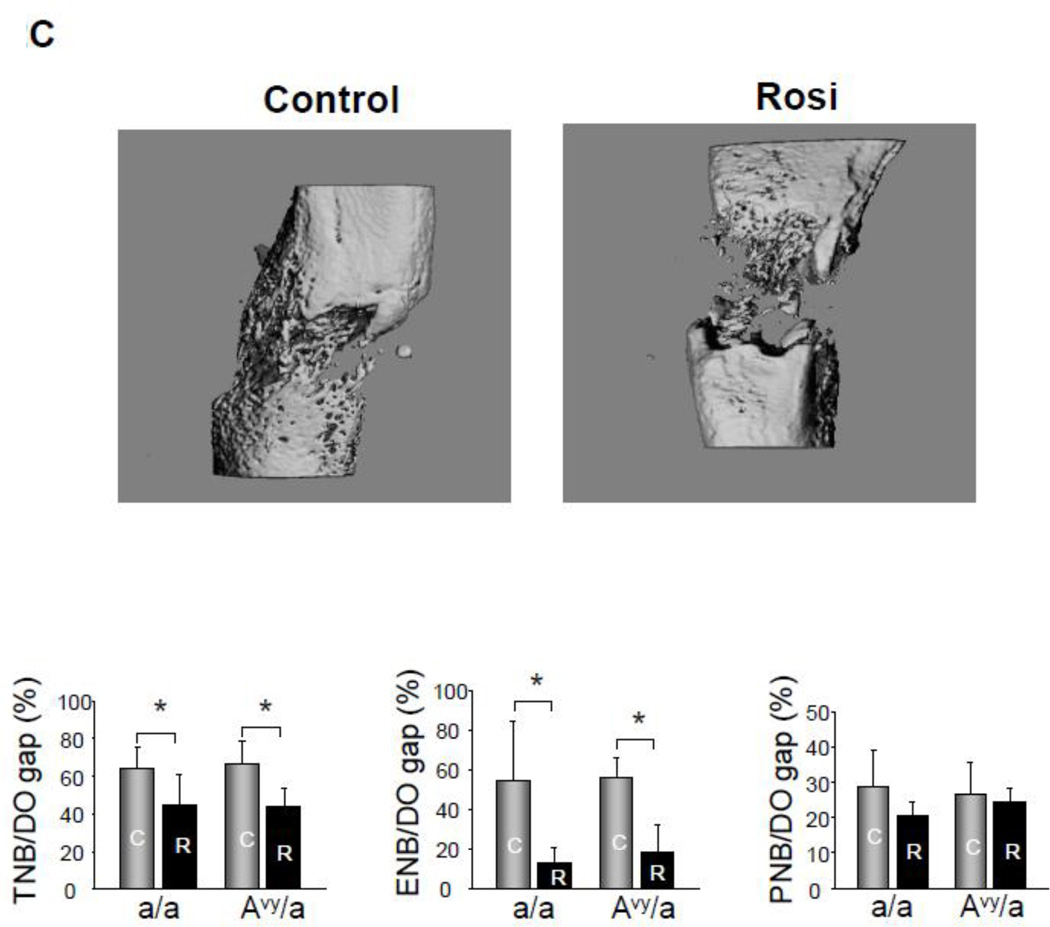
High resolution radiography showed that new bone formation in the distraction gap: 1) occurred at the same rate in both diabetic Avy (66.38%) and non-diabetic a/a mice (63.34%) on normal diet regardless of animals glycemic status and 2) significantly decreased in Rosi treated Avy mice (43.42%), p<0.01 and a/a mice (44.09%), p<0.05 compared to non-treated mice (Fig. 2A,B). Micro CT confirmed these findings at p<0.05 for the total endosteal new bone (ENB) in the distraction gap by isolating the ENB from the PNB (Fig. 2C) which also correlated to the histological findings in Fig 3.
Figure 2.
Radiographic comparison of the distraction gaps in the four test groups (a/a, Avy/a, Untreated “C”, Rosi treated “R”). A. Representative images from each group, Proximal is left to distal right. Magnif 1x. B. Percent of gap area occupied by new bone (average TNB - total new bone formation) in each of the 4 groups. C. Percent of gap area occupied by endosteal new bone formation (ENB) as measured by microCT compared to total new bone (TNB) and periosteal new bone (PNB). Note that the percentages for TNB compare favorably to plain radiographic analysis in B. Gray bars – control “C”, black bars – rosiglitazone “R”. * p < 0.05; ** p < 0.01.
4.3 Histology
Histologically, ENB could easily be distinguished from PNB using the host cortices as margins. The typical zones of bone formation in this model (FIZ, PMF and MCF) were also confirmed (Fig. 3A). ENB occupied an average of 18.55% area of the total distraction gap in Rosi treated Avy mice compared to 56.48% in non-treated Avy mice, p<0.01 (Fig. 3B,C). ENB occupied 12.99% of the gap in Rosi treated a/a mice compared 54.76% in non-treated a/a mice, p<0.05 (Fig. 3B,C).
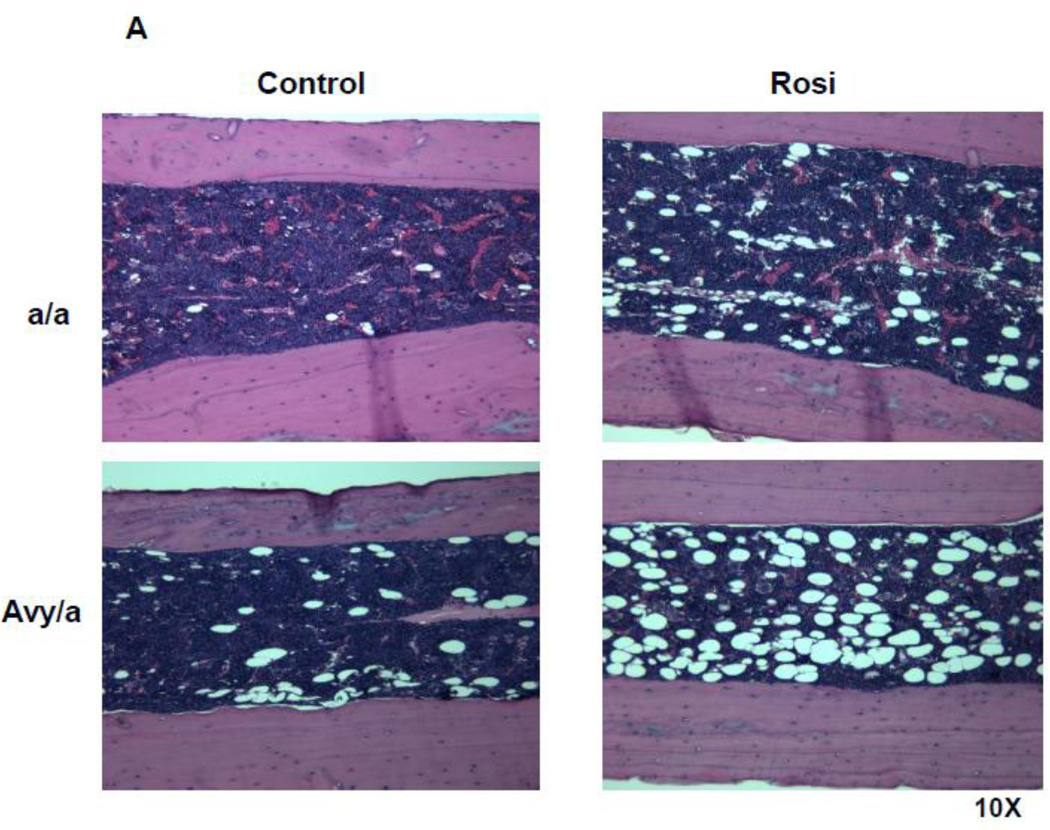
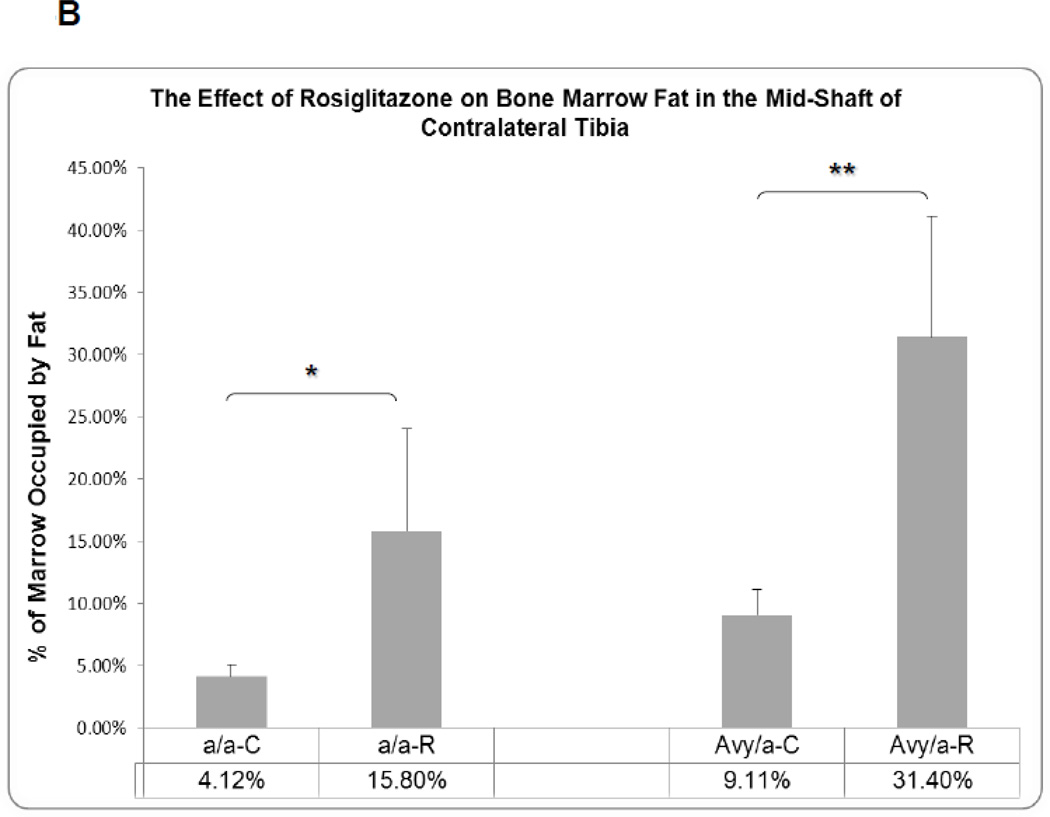
The fat content in the marrow of contralateral tibiae was significantly increased in Rosi treated mice compared to untreated diabetic mice, a/a p<0.05 and Avy p<0.01 (Fig. 4A,B).
Figure 4.
Histologic comparison of the contralateral tibial marrow in the unoperated side at the same mid-diaphyseal level at the osteotomy side in the four groups (a/a, Avy/a, Untreated “C”, Rosi treated “R”). A. Representative images from each group, Proximal is left to distal right. Magnif. 10×. Hematoxylin-eosin stain of decalcified mid-sagittal sections. B. Comparison by % of marrow occupied by adipocytes in the 4 groups as determined by grey density thresholding of the fat cells, confirmed by aP-2 immunostain (see Figure 6A). * p < 0.05; ** p < 0.01.
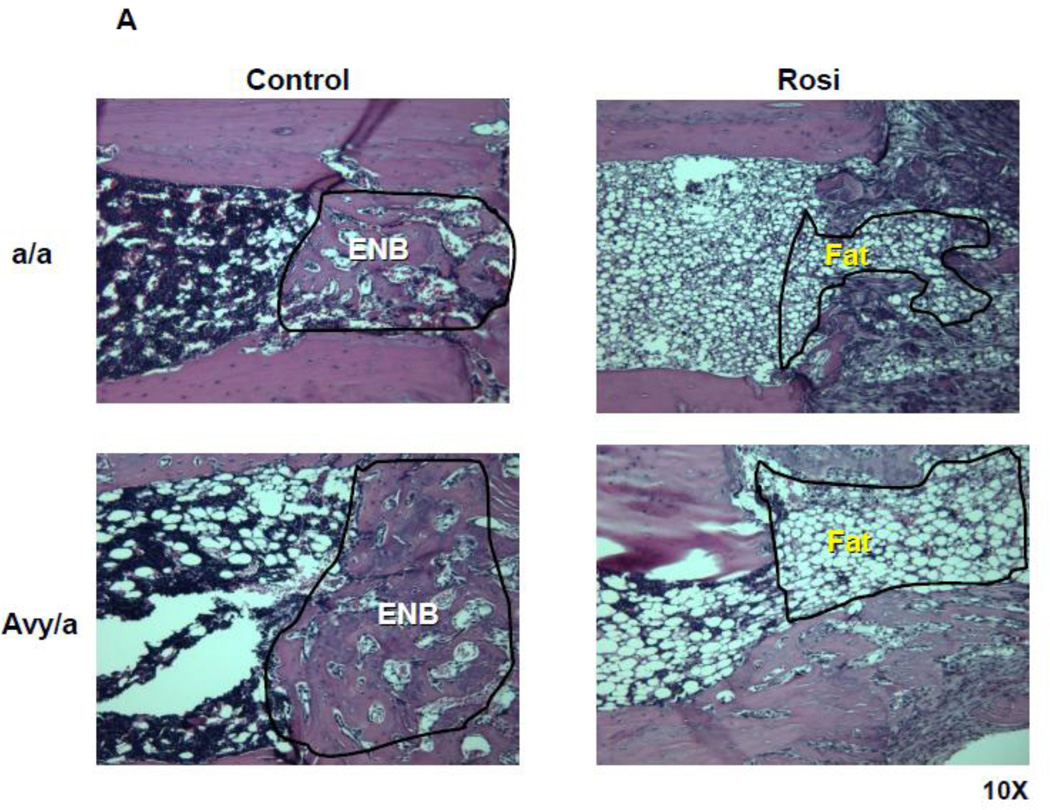
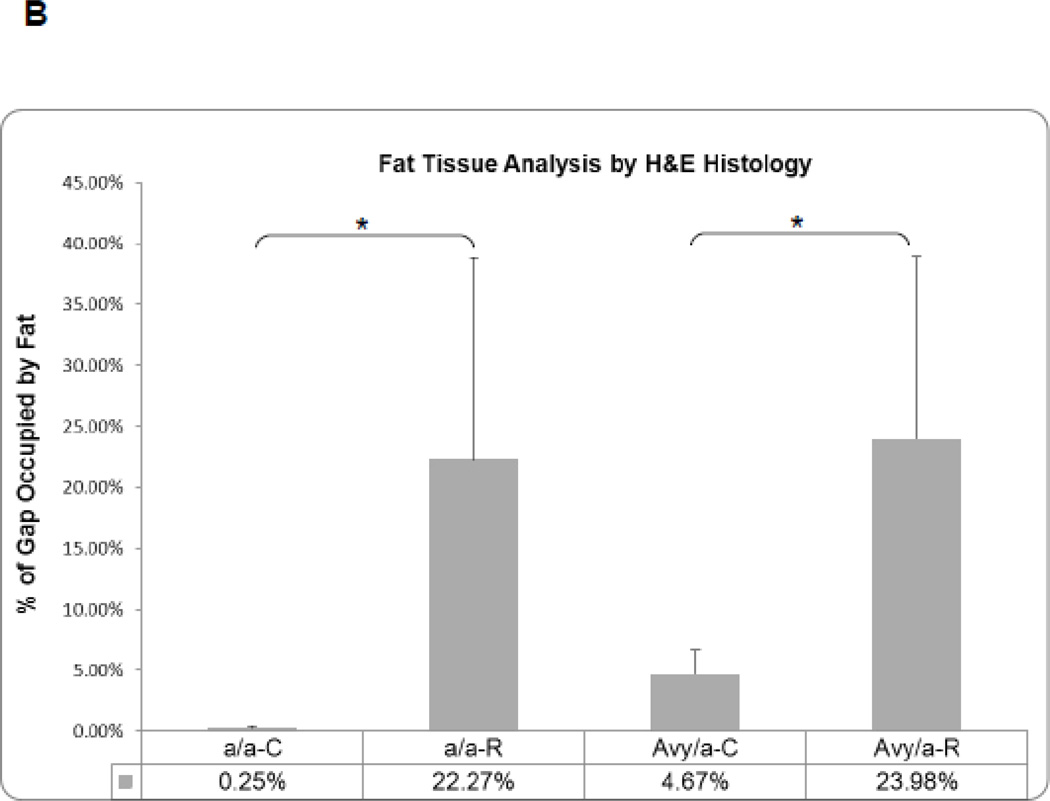
In the lengthened tibiae, the marrow fat infiltrated the osteotomy site in Rosi treated groups as seen in the MCF (Fig. 5A). As a result, the area of fat measured within the distraction gap was significantly increased in the Rosi treated mice compared to the same sites in the untreated groups, p<0.05 (Fig. 5B).
Figure 5.
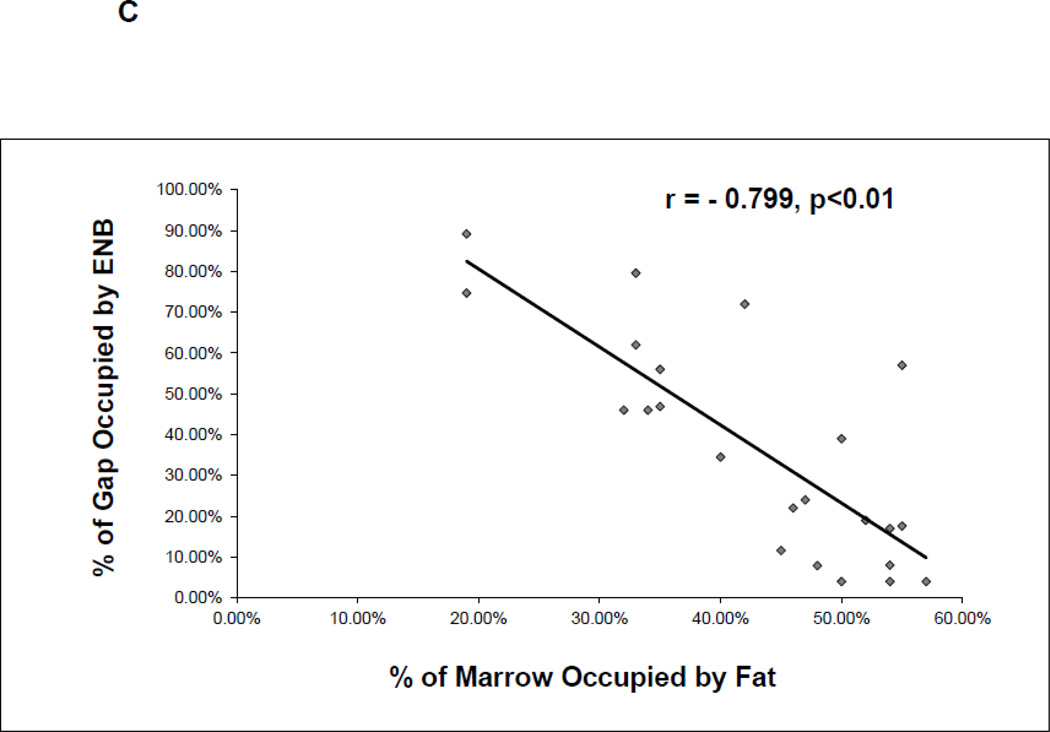
Histological comparison of ENB to fat infiltration within the proximal MCF of the four groups. A. Representative sections at 10X magnification of the proximal ENB in the two untreated groups and of the infiltrated fat in the two treated groups. B. Comparison by % of distraction gap occupied by adipocytes in the 4 groups (a/a, Avy/a, Untreated “C”, Rosi treated “R”) as determined by gray density thresholding of the fat cells, confirmed by aP-2 immunostain (see Figure 6). * p < 0.05. C. Linear regression analysis of the percent ENB in the distraction gap versus the percent of adipocytes in the marrow adjacent to the distraction gaps in all 23 specimens.
By comparing the adjacent marrow fat to the area of ENB within the distraction gap, the correlation coefficient between ENB and the marrow fat content was r = −0.799, p<0.01, which strongly suggests that ENB is inversely correlated with the adjacent marrow adipogenesis (Fig. 5C).
4.4 Immunohistochemistry
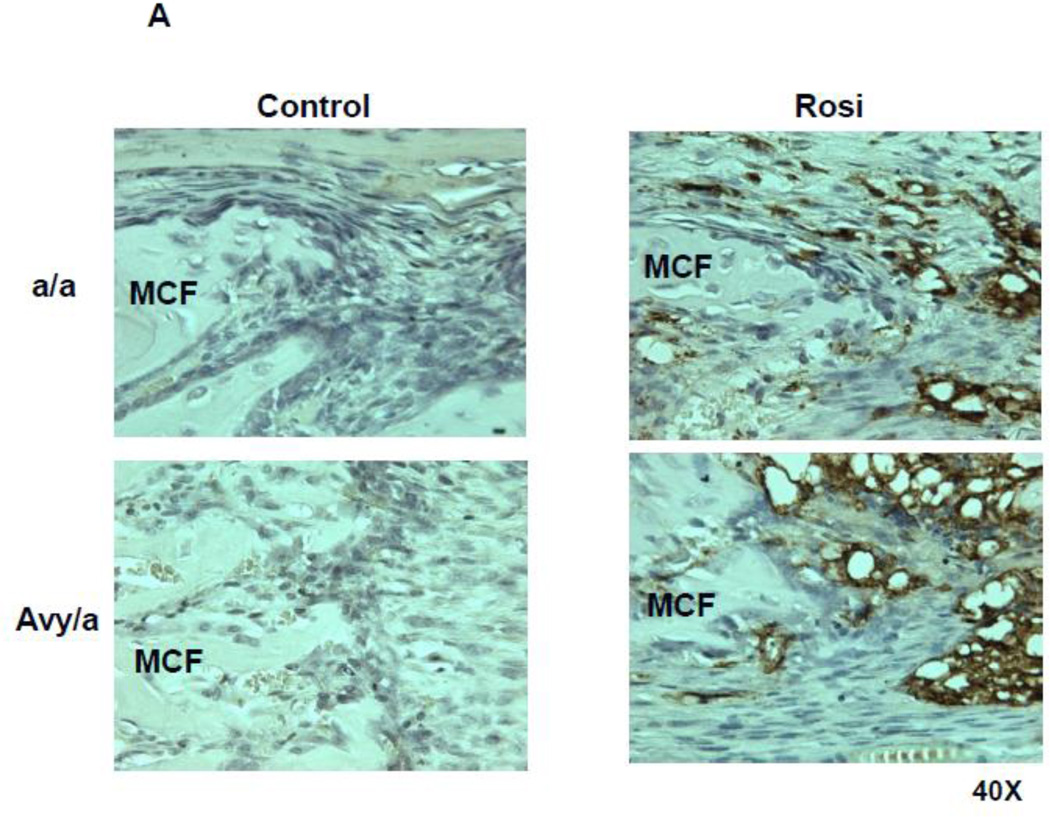
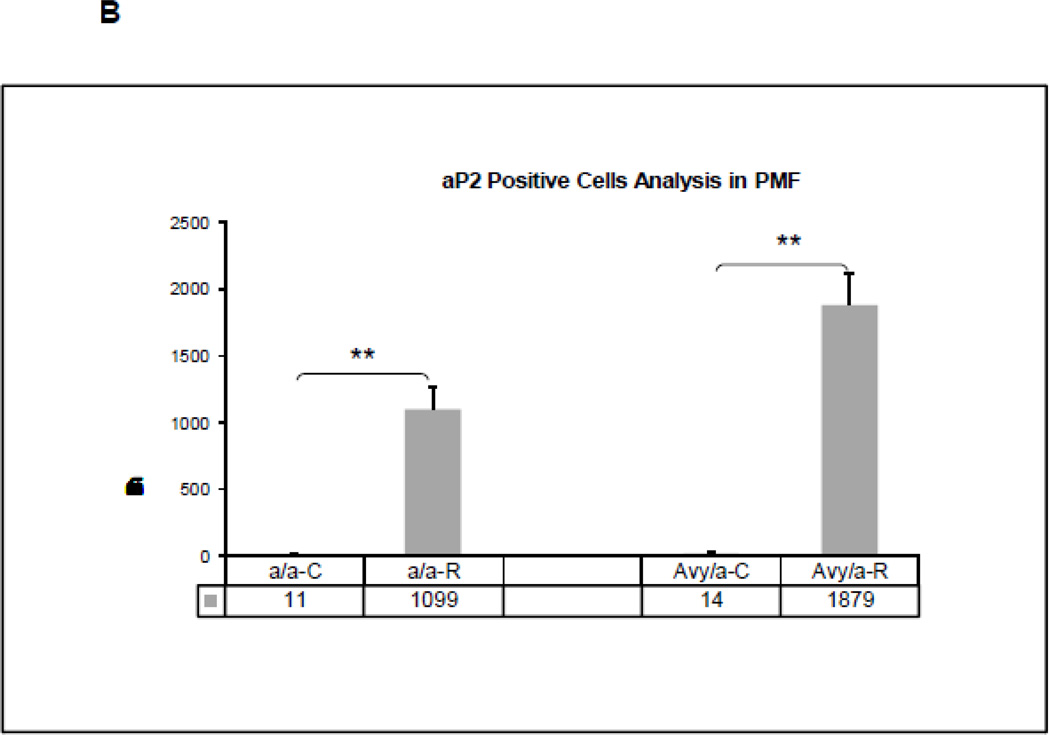
To test our hypothesis that Rosi could shift osteogenic precursors toward the adipocyte differentiation pathway, we focused on usual sites of osteoblast precursors (PMF) using immunohistochemical stains on contiguous sections, stained for either PCNA, aP2 or OC. We found that the cells typically destined to become osteoblasts strongly expressed aP2 in Rosi treated mice, p<0.01 (Fig. 6A,B).
Figure 6.
Adipocyte accumulation within the ENB at the zone of PMF in the four groups. A. Adipocytes were identified by expression of aP2 (brown staining). (Magnif. 40×). B. Quantification of aP2 positive cells by cell counting within the PMF region of interest, comparing the four groups (a/a, Avy/a, Untreated “C”, Rosi treated “R”). ** p < 0.01.
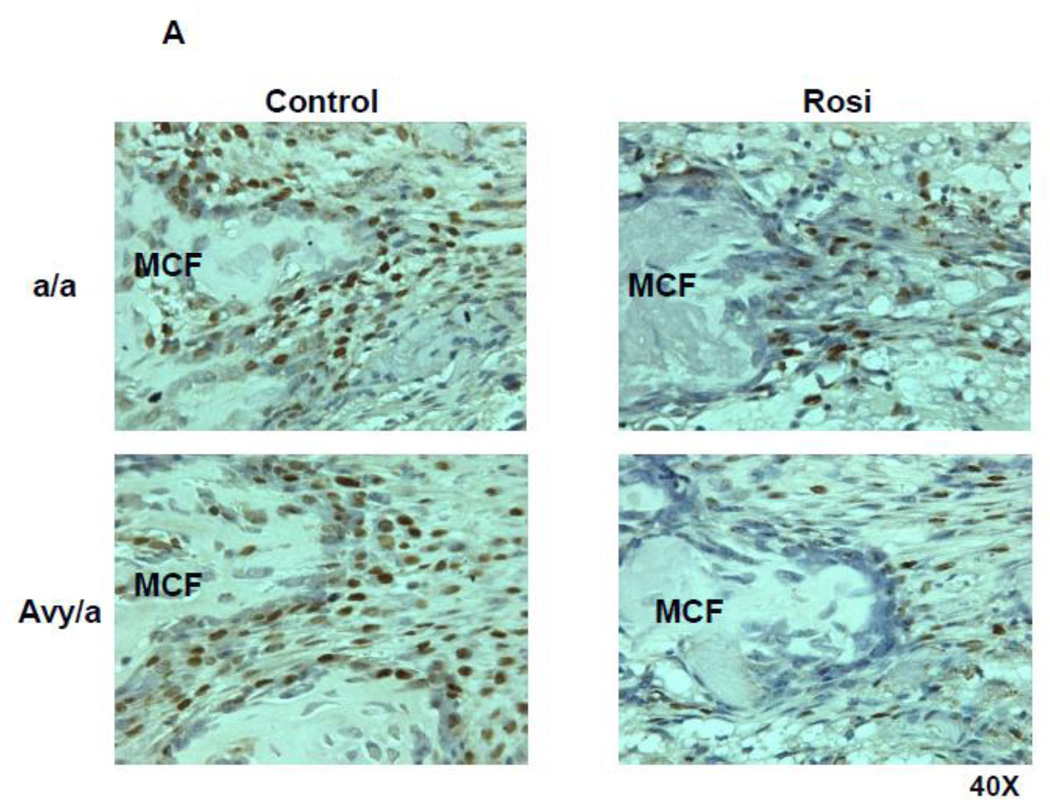
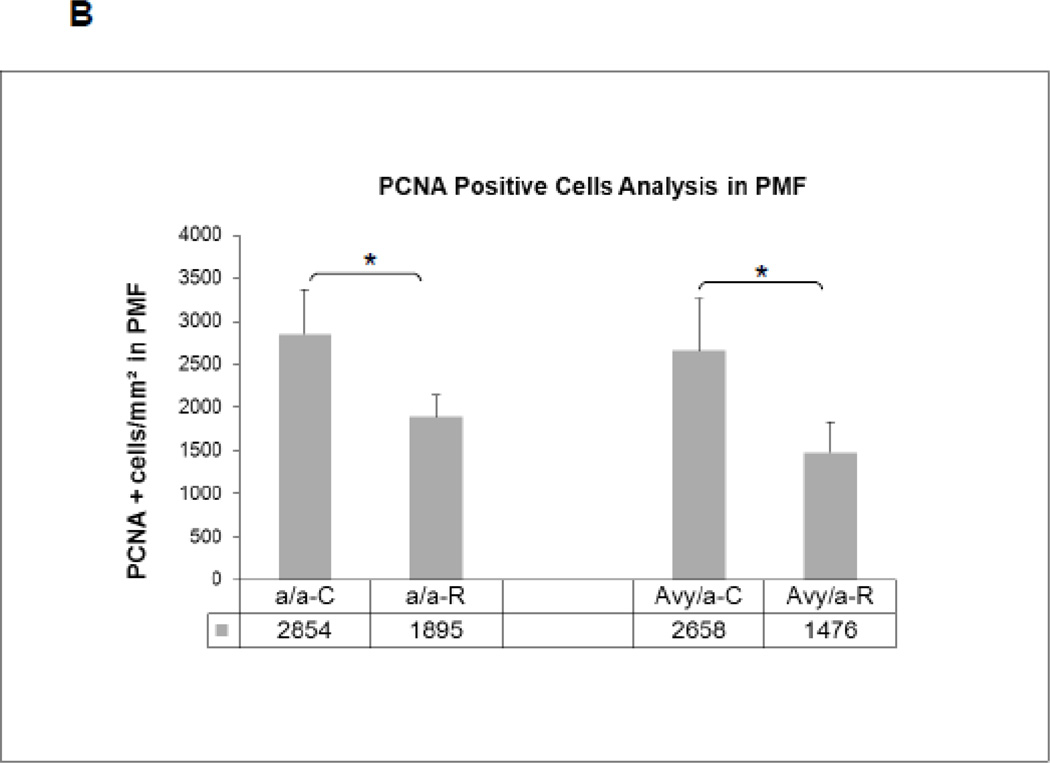
The overall increase in local adipocytes was accompanied by a significant decrease in the number of proliferating (PCNA+) cells in the PMF (Fig. 7A) of Rosi treated mice compared to non-treated mice (Fig. 7B).
Figure 7.
Cell proliferation patterns by PCNA immunostaining (brown) in the four groups. A. Proliferating cells within the new bone along the PMF zone. B. Quantification of proliferating cells by manual counting within fixed area regions of interest along the PMF in the four groups(a/a, Avy/a, Untreated “C”, Rosi treated “R”). * p < 0.05.
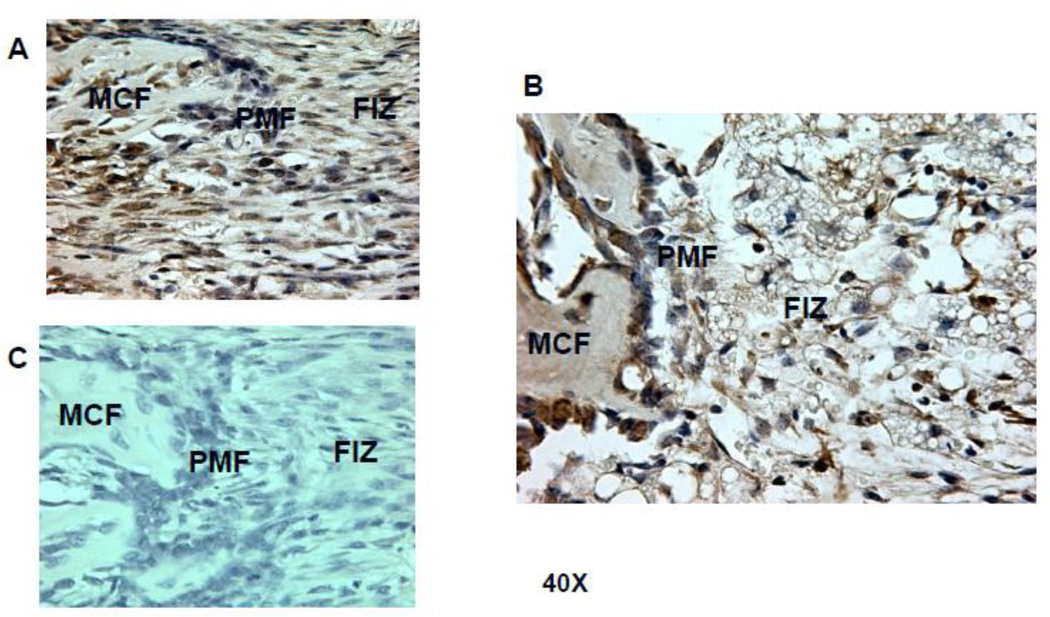
Osteocalcin localized to more mature osteoblasts within and on the surface of the newly formed trabecular bone matrix, in the MCF of the distraction gap. The bone matrix and incorporated osteocytes also strongly stained with osteocalcin (Fig.8A). Some OC-positive cells in Rosi treated mice were found to be isolated from bone matrix within the FIZ and were surrounded by adipocytes with no new bone formation (Fig. 8B) – a unique finding, previously unreported in this DO model. Negative control by replacing the primary antibody with normal IgG confirmed no false and unspecific staining (Fig.8C). Quantitative analysis of OC-positive cells in the MCF showed the number of these cells within and on the surface of new trabeculae in Rosi treated mice was slightly lower than in untreated mice, but the difference between two groups was not significant (Fig. 8D), indicating that Rosi did not affect more mature osteoblasts once new bone had formed, although there was less new bone overall.
Figure 8.
Osteocalcin stain of PMF region (brown) highlights osteoblasts, osteocytes with matrix and bone matrix at 40X magnification. A. The PMF in an untreated Avy/a mouse demonstrates obvious osteoblasts densely lining and within the new trabeculae but not extending into the FIZ. B. The PMF in a Rosi treated Avy/a mouse showing a smaller blunted new bone trabeculum and isolated osteocalcin positive cells within a disorganized FIZ infiltrated with fat cells as identified by aP2 stain in figure 6. C. The PMF in an untreated Avy/a mouse stained with normal rabbit IgG instead of the primary antibody as a control. D. Quantification of OC-positive cells by cell counting within the MCF region of interest, comparing the four groups(a/a, Avy/a, Untreated “C”, Rosi treated “R”). p > 0.05.
5.0 Discussion
Rosiglitazone, one of thiazolidinediones drugs, was developed to treat insulin resistance and hyperglycemia in type 2 diabetic patients. Clinical evidence indicates that Rosi based therapy causes bone loss and further increases fracture risk[1–5]. In vitro cellular model studies demonstrated that Rosi activated PPARγ, down-regulates osteoblast differentiation and upregulates adipocyte differentiation[8–10]. Studies of animals and humans also demonstrated negative effects of Rosi on the skeletal homeostasis[6,7]. Based on these observations, the current study was designed to test the potential effects of Rosi on in vivo intramembranous bone formation using a distraction osteogenesis model. As noted before, we chose this DO model because it can isolate pure intramembranous bone formation into specific and reproducible zones of cell and matrix types that can easily be quantitated by standard radiographs and decalcified histology[16–21,25].
Based on our results, we again confirmed that our model for DO using the mouse tibia was reliable for de novo bone formation by primarily intramembranous trabeculae in predictable zones of cellular and matrix maturation. Overall new bone formation could be quantitated by high resolution radiography of specimens and further isolated as ENB by microCT. The ENB was reliably isolated and quantitated histologically. Fat or nucleated cells in the local marrow could be clearly differentiated using gray density thresholding [25].
The Avy/a T2DM model also reliably demonstrated the diabetic phenotype as measured by high serum glucose and high insulin levels by 8 weeks of age. The obesity phenotype was noted to have a significantly increased fat content (twice normal but still less than 10% overall) in the bone marrow although surprisingly, neither the obesity nor the diabetic hyperglycemia inhibited ENB in this DO model, countering our first hypothesis. This finding was unexpected since clinical studies have demonstrated that something in the diabetic pathophysiology adversely affects both bone homeostasis and repair by fracture healing.
Either our model does not fully reproduce all of the pathophysiology of diabetes or the DO model stimulates a more powerful osteogenic effect than either normal bone homeostasis or fracture healing. In our prior investigations using models for aging[15,17,24] and toxins such as alcohol[16,28], ENB by DO was significantly diminished, so we believe that the model is sensitive enough to measure a difference. It would seem more plausible that we did not allow enough time for the diabetes to adversely influence the skeletal system, i.e., the onset of hyperglycemia by 8 weeks was not long enough to show pathological effects in other systems at 16 wks of age. More importantly, the agouti Avy/a mouse model which develops hyperinsulinemia differs from our prior T2DM model, Zucker fatty rats [25] which had hypoinsulinemia. This Zucker fatty rats model demonstrated poor ENB during DO [25]. We found that ENB in DO was also diminished in the NOD mouse model of T1DM which also had hypoinsulinemia [20]. Insulin has been shown to be anabolic for bone formation [29,30]. Poor bone formation in diabetes seems to be related to low insulin in these models of diabetes in contradistinction to our model which uniquely displayed high insulin levels.
We did find that this model of T2DM changed the microenvironment of the bone marrow, both on the control side, unoperated tibia and in the adjacent marrow to the operated, experimental DO side. The increases in marrow fat in both sides were significant.
Rosi treatment however changed the marrow constituents much more dramatically by significantly increasing the fat content in both a/a and Avy/a models (to 30–50%). In each case, the increase in marrow fat was inversely correlated to ENB.
More specifically, the local architecture of ENB in our model of DO was disrupted by infiltration of adipocytes within zones that are normally populated by osteogenic precursor cells, undergoing mitosis and differentiation. We previously found that PCNA positive cells adjacent to the osteoblasts lining the new trabecular bone surfaces at the PMF could be tracked using BRDU [31]. These studies indicated that the local PMF proliferating cells were commited to become osteoblasts [31]. In the current study, some immunostained osteogenic cells (osteocalcin positive) were actually found to be isolated from the new bone trabeculae, within a disorganized FIZ, surrounded by adipocytes (Figs. 68). The mechanism for this histological change is unclear from our data. We can only suggest possible mechanisms: 1) adipocyte infiltration could impair osteoblast proliferation or differentiation by local, paracrine factors, 2) adipocytes may increase osteoblast apoptosis, which was not measured in this study, or 3) the actual osteogenic precursor cells could have been re-directed toward adipocytic lineage by PPAR nuclear receptor to Rosi as indicated by prior in vitro studies.
These results would indicate that Rosi treatment carries a significant risk to bone formation by fat infiltration into the local marrow and extending into the distraction gap. The significant increases in marrow fat seem to directly inhibit ENB by intramembranous ossification in this model. The role of PPARγ nuclear receptor in directing precursor cell pathways would seem to be an important area for future research. If the third proposed mechanism is correct, then a selective modification of the PPARγ nuclear receptor activity could reverse the marrow metamorphosis from osteogenic to adipocytic lineage, increasing osteogenic potential of bone. This potential therapeutic effect could improve local bone healing and repair in fractures and distraction osteogenesis for bone regeneration. We have tested endosteal bone formation by distraction osteogenesis in an aging model where marrow is also over-populated by fat and ENB is significantly reduced simulating senile osteoporosis [15,17,24]. A therapeutic agent based on inhibition of the PPARγ pathway could have systemic implications for improving osteogenic potential of bone, by diminishing senile osteoporosis. It could also prophyllax against adverse effects on bone homeostasis and repair in Rosi treatment of Type 2 diabetes.
6.0 Conclusions
In summary, our data showed: 1) untreated Avy/a mice produced normal ENB despite developing diabetes and obesity, 2) a significant increase in adipogenesis within the distraction gap and in the adjacent bone marrow with a dramatic decrease in ENB in the DO gap of Rosi treated mice (diabetic or not), 3) this increased adipogenesis is inversely correlated to decreased ENB during DO and 4) cells normally found to be the osteogenic precursors in the PMF exhibited phenotypes consistent with adipocytes in Rosi treated mice.
Highlights.
Endosteal new bone formation is not disrupted in the Avy/a mouse model for Type 2 Diabetes Mellitus.
Rosiglitazone inhibits endosteal new bone formation to the same extent in diabetic and nondiabetic animals.
Rosiglitazone alters the bone marrow constituents by significantly increasing the number of adipocytes at the site of distraction osteogenesis.
Rosiglitazone treatment disrupts the well-organized microstructure of cell/matrix during osteogenesis normally exhibited in this model.
Endosteal new bone formation may be affected in human patients on anti-diabetic therapy with Rosiglitazone.
Acknowledgements
We are pleased to acknowledge Oxana Lazerenko for assistance in the laboratory and to Charles K. Lumpkin, Jr,, PhD, Clay Bunn, PhD and Elizabeth Wahl, BS for assistance in preparation of the manuscript.
This work was supported by Grants from the NIH/NIA AG 028935 and the American Diabetes Association’s Amaranth Diabetes Fund 1-09-RA-95 to BLC
Footnotes
Publisher's Disclaimer: This is a PDF file of an unedited manuscript that has been accepted for publication. As a service to our customers we are providing this early version of the manuscript. The manuscript will undergo copyediting, typesetting, and review of the resulting proof before it is published in its final citable form. Please note that during the production process errors may be discovered which could affect the content, and all legal disclaimers that apply to the journal pertain.
References
- 1.Habib ZA, Havstad SL, Wells K, Divine G, Pladevall M, Williams LK. Thiazolidinedione use and the longitudinal risk of fractures in patients with type 2 diabetes mellitus. J Clin Endocrinol Metab. 2010;95:592–600. doi: 10.1210/jc.2009-1385. [DOI] [PMC free article] [PubMed] [Google Scholar]
- 2.Kahn SE, Zinman B, Lachin JM, Haffner SM, Herman WH, Holman RR, et al. Rosiglitazone-associated fractures in type 2 diabetes: an Analysis from A Diabetes Outcome Progression Trial (ADOPT) Diabetes Care. 2008;31:845–851. doi: 10.2337/dc07-2270. [DOI] [PubMed] [Google Scholar]
- 3.Lecka-Czernik B. Bone as a target of type 2 diabetes treatment. Curr Opin Investig Drugs. 2009;10:1085–1090. [PubMed] [Google Scholar]
- 4.Loke YK, Singh S, Furberg CD. Long-term use of thiazolidinediones and fractures in type 2 diabetes: a meta-analysis. Cmaj. 2009;180:32–39. doi: 10.1503/cmaj.080486. [DOI] [PMC free article] [PubMed] [Google Scholar]
- 5.Meier C, Kraenzlin ME, Bodmer M, Jick SS, Jick H, Meier CR. Use of thiazolidinediones and fracture risk. Arch Intern Med. 2008;168:820–825. doi: 10.1001/archinte.168.8.820. [DOI] [PubMed] [Google Scholar]
- 6.Lazarenko OP, Rzonca SO, Hogue WR, Swain FL, Suva LJ, Lecka-Czernik B. Rosiglitazone induces decreases in bone mass and strength that are reminiscent of aged bone. Endocrinology. 2007;148:2669–2680. doi: 10.1210/en.2006-1587. [DOI] [PMC free article] [PubMed] [Google Scholar]
- 7.Sardone LD, Renlund R, Willett TL, Fantus IG, Grynpas MD. Effect of rosiglitazone on bone quality in a rat model of insulin resistance and osteoporosis. Diabetes. 2011;60:3271–3278. doi: 10.2337/db10-1672. [DOI] [PMC free article] [PubMed] [Google Scholar]
- 8.Lecka-Czernik B, Gubrij I, Moerman EJ, Kajkenova O, Lipschitz DA, Manolagas SC, et al. Inhibition of Osf2/Cbfa1 expression and terminal osteoblast differentiation by PPARgamma2. J Cell Biochem. 1999;74:357–371. [PubMed] [Google Scholar]
- 9.Tontonoz P, Spiegelman BM. Fat and beyond: the diverse biology of PPARgamma. Annu Rev Biochem. 2008;77:289–312. doi: 10.1146/annurev.biochem.77.061307.091829. [DOI] [PubMed] [Google Scholar]
- 10.Lecka-Czernik B. PPARs in bone: the role in bone cell differentiation and regulation of energy metabolism. Curr Osteoporos. 2010;Rep 8:84–90. doi: 10.1007/s11914-010-0016-1. [DOI] [PubMed] [Google Scholar]
- 11.Wan Y, Chong LW, Evans RM. PPAR-gamma regulates osteoclastogenesis in mice. Nat Med. 2007;13:1496–1503. doi: 10.1038/nm1672. [DOI] [PubMed] [Google Scholar]
- 12.Wei W, Wang X, Yang M, Smith LC, Dechow PC, Sonoda J, et al. PGC1 beta mediates PPARgamma activation of osteoclastogenesis and rosiglitazone-induced bone loss. Cell Metab. 2010;11:503–516. doi: 10.1016/j.cmet.2010.04.015. [DOI] [PMC free article] [PubMed] [Google Scholar]
- 13.Aronson J. Limb Lengthening, Skeletal Reconstruction and Bone Transport with the Ilizarov Method. J Bone and Joint Surg. 1997;79A:1243–1258. doi: 10.2106/00004623-199708000-00019. [DOI] [PubMed] [Google Scholar]
- 14.Aronson J, Shen XC, Skinner RA, Hogue WR, Badger TM, Lumpkin CK., Jr Rat model of distraction osteogenesis. J Orthop Res. 1997;15:221–226. doi: 10.1002/jor.1100150210. [DOI] [PubMed] [Google Scholar]
- 15.Aronson J, Liu L, Liu Z, Gao GG, Perrien DS, Brown EC, et al. Decreased Endosteal Intramembranous Bone Formation Accompanies Aging in a Mouse Model of Distraction Osteogenesis. J Regen Med. 2002;3:7–16. [Google Scholar]
- 16.Wahl EC, Liu L, Perrien DS, Aronson J, Hogue WR, Skinner RA, et al. A novel mouse model for the study of the inhibitory effects of chronic ethanol exposure on direct bone formation. Alcohol. 2006;39:159–167. doi: 10.1016/j.alcohol.2006.08.004. [DOI] [PubMed] [Google Scholar]
- 17.Aronson J. Modulation of distraction osteogenesis in the aged rat by fibroblast growth factor. Clin Orthop Relat Res. 2004;425:264–283. doi: 10.1097/01.blo.0000138186.53426.f9. [DOI] [PubMed] [Google Scholar]
- 18.Aronson J, Shen XC, Gao GG, Miller F, Quattlebaum T, Skinner RA, et al. Sustained proliferation accompanies distraction osteogenesis in the rat. J Orthop Res. 1997;15:563–569. doi: 10.1002/jor.1100150412. [DOI] [PubMed] [Google Scholar]
- 19.Perrien DS, Nicks KM, Liu L, Akel NS, Bacon AW, Skinner RA, et al. Inhibin A enhances bone formation during distraction osteogenesis. J Orthop Res. 2012;30:288–295. doi: 10.1002/jor.21501. [DOI] [PMC free article] [PubMed] [Google Scholar]
- 20.Thrailkill KM, Liu L, Wahl EC, Bunn RC, Perrien DS, Cockrell GE, et al. Bone formation is impaired in a model of type 1 diabetes. Diabetes. 2005;54:2875–2881. doi: 10.2337/diabetes.54.10.2875. [DOI] [PubMed] [Google Scholar]
- 21.Wahl EC, Aronson J, Liu L, Skinner RA, Miller MJ, Cockrell GE, et al. Direct bone formation during distraction osteogenesis does not require TNFalpha receptors and elevated serum TNFalpha fails to inhibit bone formation in TNFR1 deficient mice. Bone. 2010;46:410–417. doi: 10.1016/j.bone.2009.09.011. [DOI] [PMC free article] [PubMed] [Google Scholar]
- 22.Duhl DM, Vrieling H, Miller KA, Wolff GL, Barsh GS. Neomorphic agouti mutations in obese yellow mice. Nat Genet. 1994;8:59–65. doi: 10.1038/ng0994-59. [DOI] [PubMed] [Google Scholar]
- 23.Wolff GL, Roberts DW, Mountjoy KG. Physiological consequences of ectopic agouti gene expression: the yellow obese mouse syndrome. Physiol Genomics. 1999;1:151–163. doi: 10.1152/physiolgenomics.1999.1.3.151. [DOI] [PubMed] [Google Scholar]
- 24.Fowlkes JL, Thrailkill KM, Liu L, Wahl EC, Bunn RC, Cockrell GE, et al. Effects of systemic and local administration of recombinant human IGF-I (rhIGF-I) on de novo bone formation in an aged mouse model. J Bone Miner Res. 2006;21:1359–1366. doi: 10.1359/JBMR.060618. [DOI] [PMC free article] [PubMed] [Google Scholar]
- 25.Liu Z, Aronson J, Wahl EC, Liu L, Perrien DS, Kern PA, et al. A novel rat model for the study of deficits in bone formation in type-2 diabetes. Acta Orthop. 2007;78:46–55. doi: 10.1080/17453670610013411. [DOI] [PubMed] [Google Scholar]
- 26.Perrien DS, Brown EC, Aronson J, Skinner RA, Montague DC, Badger TM, et al. Immunohistochemical study of osteopontin expression during distraction osteogenesis in the rat. J Histochem Cytochem. 2002;50:567–574. doi: 10.1177/002215540205000414. [DOI] [PubMed] [Google Scholar]
- 27.Shockley KR, Lazarenko OP, Czernik PJ, Rosen CJ, Churchill GA, Lecka-Czernik B. PPARgamma2 nuclear receptor controls multiple regulatory pathways of osteoblast differentiation from marrow mesenchymal stem cells. J Cell Biochem. 2009;106:232–246. doi: 10.1002/jcb.21994. [DOI] [PMC free article] [PubMed] [Google Scholar]
- 28.Wahl EC, Aronson J, Liu L, Liu Z, Perrien DS, Skinner RA, et al. Chronic ethanol exposure inhibits distraction osteogenesis in a mouse model: role of the TNF signaling axis. Toxicol Appl Pharmacol. 2007;220:302–310. doi: 10.1016/j.taap.2007.02.011. [DOI] [PMC free article] [PubMed] [Google Scholar]
- 29.Thrailkill K, Lumpkin CK Jr, Bunn RC, Kemp SF, Fowlkes JL. Is insulin an anabolic agent in bone? Dissecting the diabetic bone for clues. Am J Physiol Endocrinol Metab. 2005;289:745–745. doi: 10.1152/ajpendo.00159.2005. [DOI] [PMC free article] [PubMed] [Google Scholar]
- 30.Hamann C, Cirschner S, Gunther KP, Hofbauer LC. Bone, sweet bone-osteoporotic fractures in diabetes mellitus. Nat Rev Endocrinol. 2012;8:297–305. doi: 10.1038/nrendo.2011.233. [DOI] [PubMed] [Google Scholar]
- 31.Wahl EC, Aronson J, Skinner RA, Lumpkin CK., Jr Bromodeoxyuridine Tracking of Osteoblast Progenitors in Formalin-Fixed, Decalcified Regenerating Bone. J Histotechnol. 2006;29:11–14. [Google Scholar]


