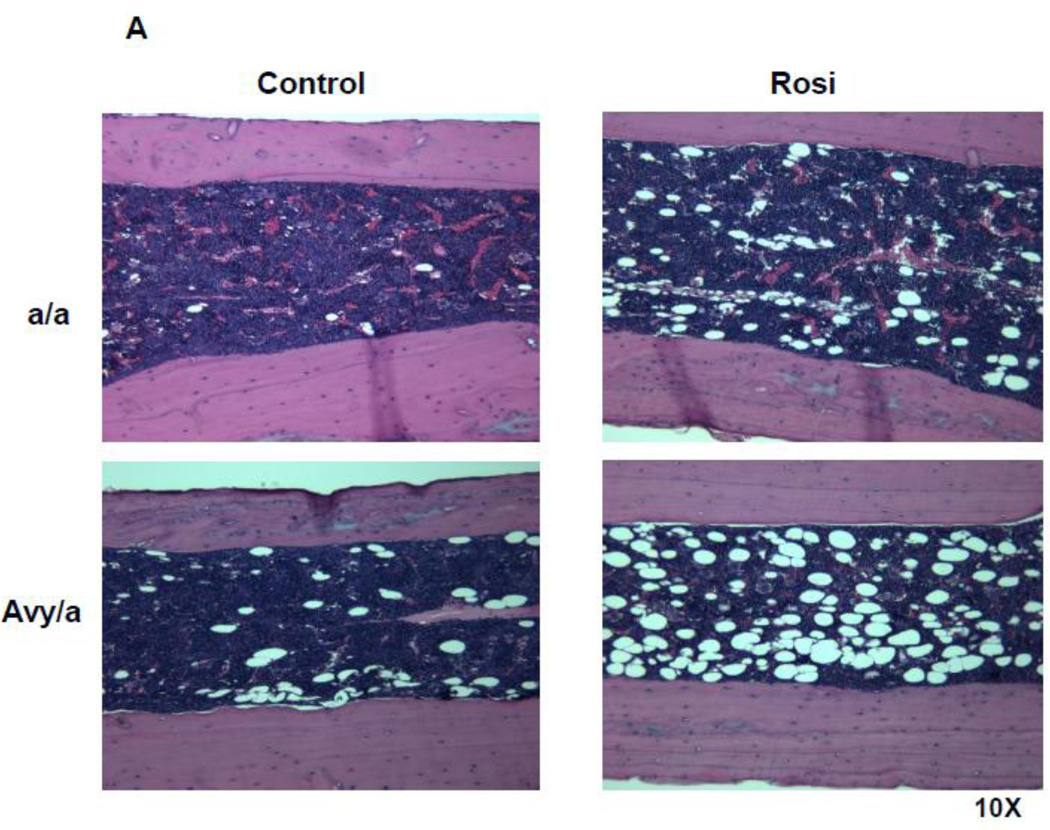
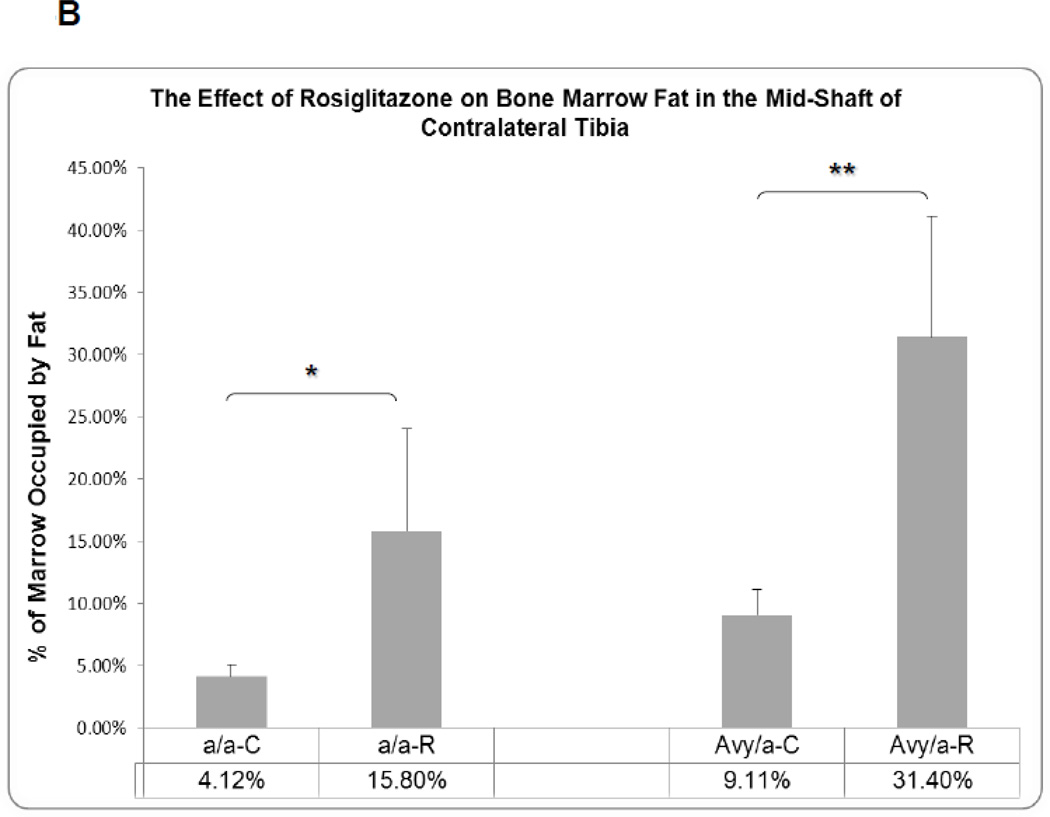
Figure 4.
Histologic comparison of the contralateral tibial marrow in the unoperated side at the same mid-diaphyseal level at the osteotomy side in the four groups (a/a, Avy/a, Untreated “C”, Rosi treated “R”). A. Representative images from each group, Proximal is left to distal right. Magnif. 10×. Hematoxylin-eosin stain of decalcified mid-sagittal sections. B. Comparison by % of marrow occupied by adipocytes in the 4 groups as determined by grey density thresholding of the fat cells, confirmed by aP-2 immunostain (see Figure 6A). * p < 0.05; ** p < 0.01.


