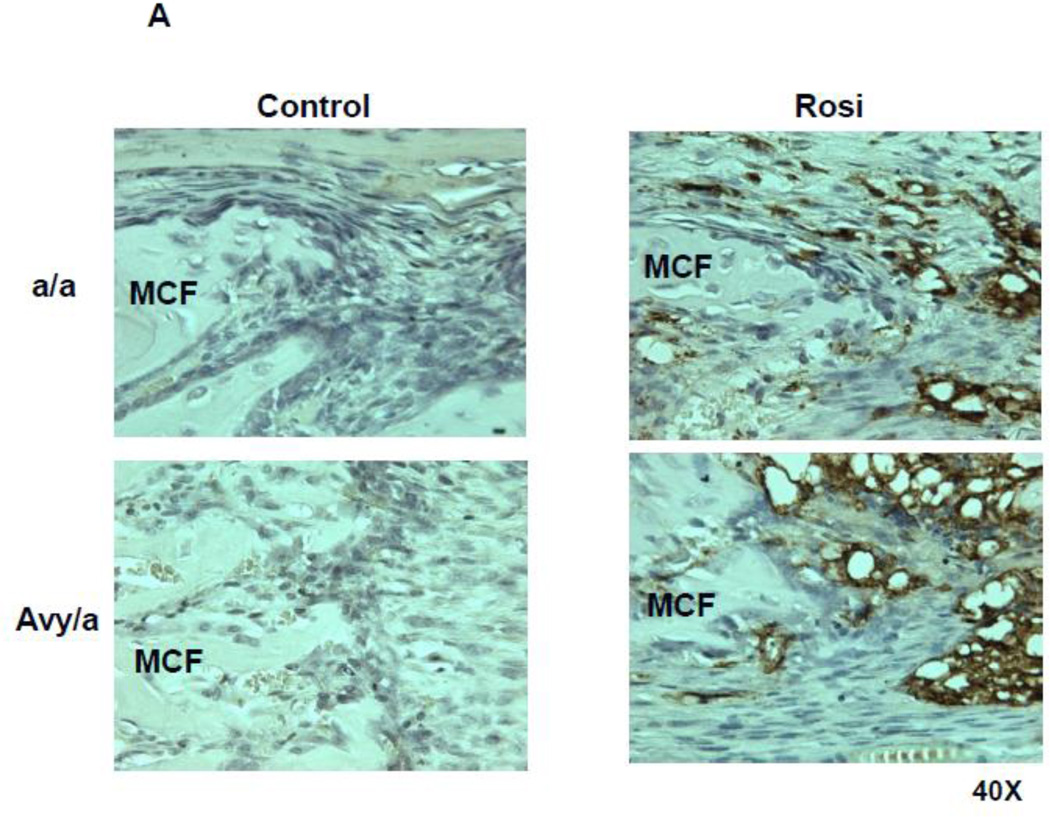
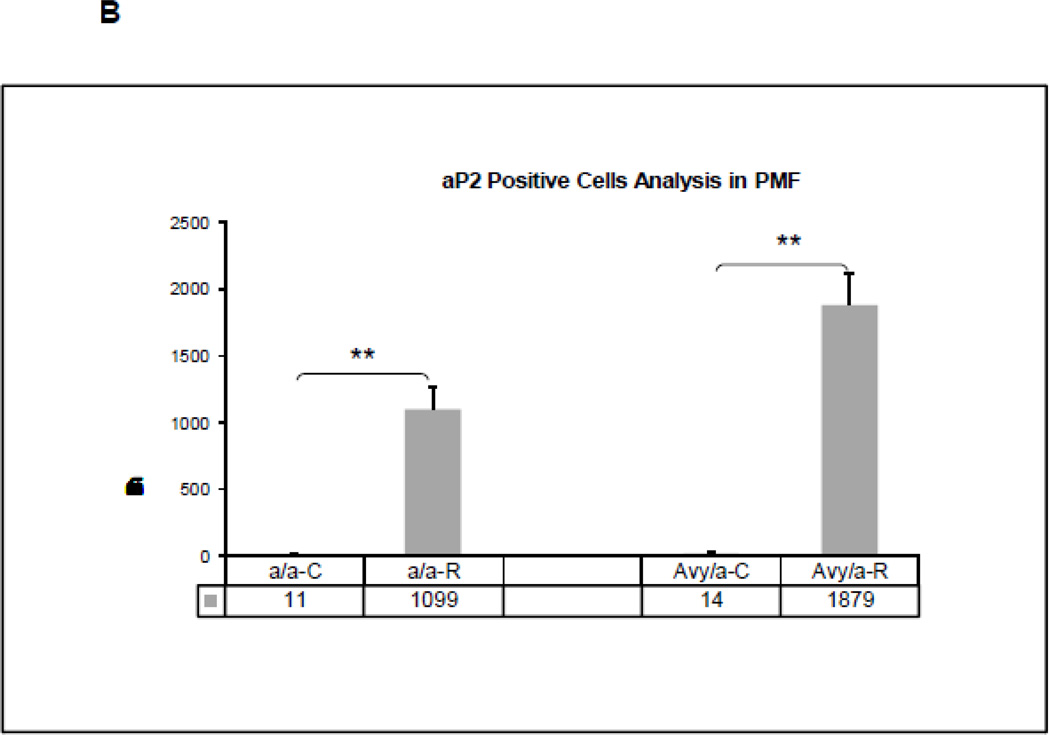
Figure 6.
Adipocyte accumulation within the ENB at the zone of PMF in the four groups. A. Adipocytes were identified by expression of aP2 (brown staining). (Magnif. 40×). B. Quantification of aP2 positive cells by cell counting within the PMF region of interest, comparing the four groups (a/a, Avy/a, Untreated “C”, Rosi treated “R”). ** p < 0.01.


