

Abstract
Histone deacetylase 3 (Hdac3) is a nuclear enzyme that removes acetyl groups from lysine residues in histones and other proteins to epigenetically regulate gene expression. Hdac3 interacts with bone-related transcription factors and co-factors such as Runx2 and Zfp521, and thus is poised to play a key role in the skeletal system. To understand the role of Hdac3 in osteoblasts and osteocytes, Hdac3 conditional knockout (CKO) mice were created with the Osteocalcin (OCN) promoter driving Cre expression. Hdac3 CKOOCN mice were of normal size and weight, but progressively lost trabecular and cortical bone mass with age. The Hdac3 CKOOCN mice exhibited reduced cortical bone mineralization and material properties and suffered frequent fractures. Bone resorption was lower, not higher, in the Hdac3 CKOOCN mice, suggesting that primary defects in osteoblasts caused the reduced bone mass. Indeed, reductions in bone formation were observed. Osteoblasts and osteocytes from Hdac3 CKOOCN mice showed increased DNA damage and reduced functional activity in vivo and in vitro. Thus, Hdac3 expression in osteoblasts and osteocytes is essential for bone maintenance during aging.
Keywords: Histone deacetylase, Osteocalcin-Cre, Osteoblast, Osteocyte, DNA damage
1. Introduction
Post-translational modifications of histones are important contributing factors in the epigenetic regulation of gene expression. Acetylated histones facilitate an open chromatin conformation that allows transcription factors, co-factors, and RNA polymerase II-complexes to access the DNA. In contrast, deacetylated histones encourage a condensed chromatin conformation and transcriptional repression. Histone acetyltransferases (HATs) and histone deacetylases (Hdacs) are counteracting enzymes that control histone acetylation levels. HATs and Hdacs also target lysine residues in many other proteins, such as transcription factors, altering their activity, cellular localization or stability [1], thus adding another layer of complexity to the mechanisms by which these enzymes regulate gene expression.
Hdacs regulate the activity of transcription factors important to bone development and maintenance and are crucial for skeletal development [2-7]. Germline deletion of Hdac8 causes craniofacial ossification defects [8], whereas germline deletion of Hdac4 or Hdac6 enhances endochondral ossification and bone mineral density [9, 10]. Hdacs also play important roles in the postnatal skeleton. The pan Hdac inhibitor, vorinostat, depletes the immature osteoblast population and causes trabecular bone loss [11, 12]. Another pan Hdac inhibitor, valproate, causes loss of both cortical and trabecular bone mass [13]. Biological responses to Hdac inhibition vary because Hdac expression changes during cellular differentiation. For example, Hdac1 and Hdac2 are abundantly expressed in osteoblast progenitors, but not in mature osteoblasts, whereas expression levels of Hdac4 and Hdac6 increase during osteoblastic differentiation [14]. Osteoblast progenitors appear to be particularly sensitive to Hdac inhibition, as stromal cells treated early in the time course of osteoblastic differentiation fail to form mature, matrix-producing osteoblasts, but cells treated with Hdac inhibitors at later culture stages are unaffected [11].
The role of Hdac3 in bone is of interest because it is strongly expressed in osteoblasts at all stages of differentiation [3, 14, 15] and it interacts with the master osteoblast transcription factor Runx2 [3, 4]. Germline deletion of Hdac3 causes embryonically lethality prior to skeleton formation [16], and thus its effects on bone must be assessed using conditional knockout models. Mice deficient in Hdac3 under the control of the Osterix (Osx) promoter (Hdac3 CKOOSX) have a striking developmental phenotype of reduced body size, decreased bone length, and deficits in both cortical and trabecular bone mass [17]. This phenotype is explained, in part, by a deleterious impact on osteoblasts, as osteoblast numbers and bone formation rates were lower in Hdac3 CKOOSX compared to wildtype mice [17]. However, Osterix (Sp7) is also expressed by chondrocytes, and indeed, Hdac3 CKOOSX mice have a relative expansion of the hypertrophic zone in the growth plate cartilage, suggesting that aberrant chondrocyte hypertrophy contributes to the skeletal phenotype during development [17]. Recent studies confirmed that chondrocytes from Hdac3 CKOOSX mice undergo accelerated hypertrophy but are impaired in their ability to produce a cartilaginous matrix [18], contributing to the growth plate defects in these mice. Thus, the phenotype of Hdac3 CKOOSX mice is likely due to the combined effects of Hdac3 depletion in chondrocytes and osteoblasts.
To better understand the effects of Hdac3 in mature osteoblasts and osteocytes, independent of cartilage defects, we crossed Hdac3-floxed animals with mice containing the Osteocalcin (OCN)-Cre transgene [19]. Here we show that Hdac3 depletion in mature osteoblasts causes a progressive postnatal decrease in cortical and trabecular bone mass with age as compared to age-matched control mice. In vitro and in vivo studies attribute this osteopenic phenotype to increased DNA damage and an overall decline in osteoblast and osteocyte function, particularly in cortical bone.
2. Materials and Methods
2.1. Animal studies
Mice containing LoxP sites flanking exon 7 of Hdac3 (Hdac3fl/fl mice) [16, 20] were crossed with transgenic mice expressing Cre recombinase under control of a segment (approximately 4 kb) of the human OCN promoter [19, 21] to create Hdac3fl/fl, Cre+ conditional knockout mice (CKO; also referred to as Hdac3 CKOOCN mice). All mice were maintained on a mixed CD1:C57Bl/6 background. The OCN-Cre mouse features an 88% excision index in osteoblasts and osteocytes [19, 22]. Mice were genotyped for Hdac3 alleles and the OCN-Cre transgene with PCRs using tail DNA as a template as previously reported [17, 19]. Because transgene and LoxP insertions may cause unpredictable and unknown consequences, Hdac3 CKOOCN mice were compared to two different control groups when possible. These groups were: Hdac3fl/fl mice that did not harbor the OCN-Cre transgene (hereafter referred to as Hdac3fl/fl, Cre- control (Ctrl) mice), and mice expressing the OCN-Cre transgene but wildtype at the Hdac3 locus (hereafter referred to as Hdac3+/+, Cre+ Ctrl mice). The latter group was not maintained past 12 wk of age because at the early ages the two control groups were largely indistinguishable from each other in skeletal phenotype. Data from the larger control group is shown in the figures. All animal research was conducted according to guidelines provided by the National Institutes of Health and the Institute of Laboratory Animal Resources, National Research Council. The Mayo Clinic Institutional Animal Care and Use Committee approved all animal studies. Animals were housed in an accredited facility under a 12-hour light/dark cycle and provided water and food (PicoLab Rodent Diet 20, LabDiet) ad libitum.
2.2. Dual-energy X-ray absorptiometry analyses and tissue collection
Bone mineral density (BMD) was assessed longitudinally via dual-energy X-ray absorptiometry (DXA) scanning (PIXImus, GE Healthcare) of live mice at 4, 12, and 24 wk of age. Three regions of interest were monitored: lower body (including the lumbar spine, pelvis, and hindquarters), lumbar vertebrae, and femoral midshaft. Body weights were recorded and serum was collected via cardiac puncture at sacrifice. To assess protein expression of Hdac3, long bones were removed from 5 to 6 wk old mice and dissected free of soft tissues. Epiphyses were removed from both femurs and one tibia from each mouse and marrow was flushed with saline; cortical bone segments were subsequently flash frozen in liquid nitrogen prior to protein isolation. For mRNA analyses, demarrowed cortical bone segments from one femur and one tibia were prepared from 2 wk old mice as described above and flash frozen in liquid nitrogen prior to mRNA extraction. To permit dynamic histomorphometry studies of bone remodeling, adult mice were administered subcutaneous injections of calcein (10 mg/kg) on days 4 and 1 prior to death as previously described [17]. Femurs and tibias were collected from mice at 4, 6, 12, and 24 wk of age for quantification of bone architecture, material properties, and remodeling indices. One femur from each of the 12 wk old mice was cleaned of soft tissue and stored at -20 deg C in saline-soaked gauze for preservation of mechanical properties. All remaining bones were fixed in 70% ethanol (for Fourier transform infrared (FT-IR) imaging) or 10% neutral buffered formalin (for static and dynamic histomorphometry) and stored in 70% ethanol prior to microCT analysis and histological preparation.
2.3. Tissue level gene expression
For mRNA analyses, demarrowed cortical bone explants were homogenized in TRIzol using a high-speed disperser (Ultra-Turrax T25, IKA). RNA was extracted and purified from the ground tissue with TRIzol reagent (Invitrogen) and was reverse transcribed into cDNA using the SuperScript III First-Strand Synthesis System (Invitrogen). Relative expression levels of mRNAs for genes of interest, including Hdac3, characteristic osteoblast and osteocyte genes, Rankl, Opg, and genes relating to proliferation (CyclinD1, Cdkn1a) (Table 1) were measured by real-time PCR (qPCR). Reactions were performed using 37.5 ng of cDNA per 15 μl with Bio-Rad iQ SYBR Green Supermix and the Bio-Rad MyiQ Single Color Real-Time PCR Detection System. Transcript levels were normalized to the reference gene Gapdh. Gene expression levels were quantified using the 2-ΔΔCt method [23].
Table 1.
Primer sequences used in PCR reactions.
| Gene name | ID | Forward primer sequence | Reverse primer sequence |
|---|---|---|---|
| Alkaline phosphatase/Alpl | NM_007431 | CACAGATTCCCAAAGCACCT | GGGATGGAGGAGAGAAGGTC |
| Ccnd1 | NM_007631 | AGAAGGAGATTGTGCCATCCA | CTCACAGACCTCCAGCATCCA |
| Cdkn1a Cdkn1(p21) | NM_007669 | CAAGAGGCCCAGTACTTCCT | ACACCAGAGTGCAAGACAGC |
| Col1a1 | NM_007742 | GCTTCACCTACAGCACCCTTGT | TGACTGTCTTGCCCCAAGTTC |
| Gapdh | NM_008084 | GGGAAGCCCATCACCATCTT | GCCTCACCCCATTTGATGTT |
| Hdac3 | NM_010411 | CCCGCATCGAGAATCAGAAC | TCAAAGATTGTCTGGCGGATCT |
| Mepe | NM_053172 | TGCTGCCCTCCTCAGAAATATC | GTTCGGCCCCAGTCACTAGA |
| Opg/Tnfrsf11b | NM_008764 | CCAAGAGCCCAGTGTTTCTT | CCAAGCCAGCCATTGTTAAT |
| Osteocalcin/Bglap | NM_007541 | CCTGAGTCTGACAAAGCCTTCA | GCCGGAGTCTGTTCACTACCTT |
| Osterix/Sp7 | NM_130458 | GGAGGTTTCACTCCATTCCA | TAGAAGGAGCAGGGGACAGA |
| Phex | NM_011077 | AAGCTGGACCAAGCAACACT | AAGGGCATCCCGATAAGATT |
| Rankl/Tnfsf11 | NM_011613 | GCTGGGACCTGCAAATAAGT | TTGCACAGAAAACATTACACCTG |
| Runx2 | NM_009820 | GGCACAGACAGAAGCTTGATGA | GAATGCGCCCTAAATCACTGA |
| Sost | NM_024449 | ACTTGTGCACGCTGCCTTCT | TGACCTCTGTGGCATCATTCC |
2.4 Cortical bone protein expression
Demarrowed cortical bone segments were pulverized with a mortar and pestle in liquid nitrogen, placed in RIPA buffer on ice, and sonicated to generate protein extracts. Lysates were cleared by centrifugation at 15,000 RPM for 15 minutes at 4 degrees C. Ten to forty micrograms of total protein from each sample were resolved by SDS-PAGE. Western blotting was performed with antibodies recognizing Hdac3 (1:5000, Abcam #ab63353), acetylated histone 3: K9 and K14 (1:10,000, Millipore #06-599), acetylated histone 4: K5, K8, K12, and K16 (1:10,000, Millipore 06-866), histone 3 (1:20,000, Millipore #05-928), and actin (1:5000 or 1:10,000, Santa Cruz, I-19 SC-1616). Relative expression of Hdac3 was quantified from band intensity with image analysis software (Image J).
2.5 Serum bone remodeling markers and serum calcium
Circulating levels of procollagen type 1 amino-terminal propeptide (P1NP; bone formation marker) and tartrate-resistant acid phosphatase 5b (TRAcP5b; bone resorption marker) were measured with colorimetric assays (Rat/Mouse P1NP EIA #AC-33F1, Immunodiagnostic Systems, Fountain Hills AZ; MouseTRAP ELISA #SB-TR103, Immunodiagnostic Systems, Fountain Hills AZ). All samples were tested in duplicate within each assay. For quantification of total serum calcium, serum samples were diluted 1:40 in a solution of 1% lanthanum chloride and 0.1M HCl, and then analyzed via atomic absorption using a Perkin Elmer AAnalyst 800.
2.6. Bone structure and composition in the femur (micro-computed tomography and Fourier transform infrared imaging)
Bone architecture and mineralization were evaluated in femurs of male mice using ex vivo micro-computed tomography (microCT) and FT-IR imaging. For microCT studies, the central portion of the femoral diaphysis and secondary spongiosa in the distal femoral metaphysis of each bone were scanned in 70% ethanol on a μCT35 scanner (Scanco Medical AG, Basserdorf, Switzerland). Cortical and trabecular bone scans were performed with 7 μm voxel size using an energy setting of 70 kVp and an integration time of 300 ms. For the distal femoral metaphysis scans, a region of interest that was 0.7 mm long (100 slices) was analyzed in each mouse, located 0.9 mm proximal to the growth plate in 4 and 6 wk old animals and 0.5 mm proximal to the growth plate in 12- and 24 wk old animals. Trabecular bone volume fraction (Tb. BV/TV, %), trabecular number (Tb.N, mm-1), trabecular thickness (Tb.Th, mm), and trabecular separation (Tb.Sp, mm), were computed using the manufacturer’s software [24]. For the femoral diaphysis scans, a region of interest that was 0.7 mm long and centered about the exact midshaft of the bone was analyzed in each sample. Cortical bone area (Ct.Ar, mm2) was calculated from cortical bone volume (Ct.BV, mm3) as described previously [24]. Cortical bone thickness (Ct.Th, mm), and cortical bone material mineral density (Ct.Mat.Mn.Dn, mg hydroxyapatite (HA)/cm3 were computed with the manufacturer’s software [24].
FT-IR spectroscopy was performed on 5-μm thick undecalcified histology sections from 4 wk old mice using micro-attenuated total reflectance (ATR)-FT-IR spectroscopy (Nicolet 8700), coupled to a Continuum microscope (Thermo Electron Corp., Madison, WI). Four cortical bone locations on each section were chosen and spectra were collected. The microscope used an ATR slide on a germanium crystal and spectra were collected at a resolution of 4 cm-1 for 128 scans with a sampling area of 100×100 μm. The mineral to matrix ratio was calculated by measuring the area of phosphate peak (900-1200 cm-1) and normalizing it by the area under Amide I peak at 1590-1720 cm-1. The carbonate to phosphate ratio was calculated by measuring the area under the carbonate peak at 850-890 cm-1 and normalizing it by the area of phosphate peak.
2.7. Bone material properties (nanoindentation)
Femurs were thawed and sectioned transversely with a diamond saw (Buehler Isomet, Lake Bluff, IL) to expose the femoral midshaft and subsequently potted in resin (Leco, St. Joseph, MI) at room temperature for nanoindentation testing. Embedded samples were metallographically polished to expose the bone material and to produce smooth surfaces needed for nanoindentation. Specimens were ground with silicon carbide abrasive papers of decreasing grit size (400, 600, 800, and 1200 grit) under deionized water, followed by micro-cloths (AUTOMET 250, Buehler) with silicon slurry of 0.05 lm grit. After polishing, specimens were ultrasonically cleaned to remove surface debris. Polished samples were tested in a longitudinal direction on a commercial nanoindentation machine (Hysitron TI 950, Minneapolis, MN) using a diamond Berkovitch tip. A 2×2 point matrix of nanoindentation measurements was collected and averaged at each sampling site, and an average of 12 different sites around the circumference of each bone were tested. All nanoindentation tests were performed under load control, with a loading rate of 500 μN/second, and maximum load of 2 mN. To minimize the effects of viscoelasticity on property measurements, a 60 second hold period was conducted before the final unloading to diminish viscoelastic deformation to a negligible rate. Reduced modulus (Er) and hardness (H) were computed for each sampling site using the Oliver-Pharr model [25-27] and were averaged for each bone.
2.8. Trabecular bone remodeling indices in the proximal tibia
Thin (5 μm) undecalcified trabecular bone sections were prepared from the proximal tibial metaphysis, distal femoral metaphysis, and femoral mid-diaphysis. Tibia sections were stained with VonKossa/MacNeal’s tetrachrome to highlight osteoblast surfaces or tartrate resistant acid phosphatase (TRAP)/fast green to highlight osteoclast surfaces. Trabecular bone histomorphometric remodeling indices were measured in an area of tissue (1 mm2) beginning 500 μm from growth plate in the metaphyseal spongiosa, and cortical bone indices for the femoral mid-diaphysis were quantified for the entire cross-section. Slides were digitized using a microscope and digital camera and analyzed using image analysis software at 200X or 400X magnification (OsteoMeasures, Osteometrics Inc., Decatur, GA). Trabecular bone osteoblast surface/bone surface (Ob.S/BS, %), trabecular bone osteoblast number (N.Ob/B.Ar or N.Ob/T.Ar, #/mm2), trabecular bone osteoclast surface/bone surface (Oc.S/BS, %), and trabecular bone osteoclast number (N.Oc/B.Ar or N.Oc/T.Ar, #/mm2) were quantified from the stained sections. Trabecular bone mineralizing surface (Tb. MS/BS, %), trabecular bone mineral apposition rate (Tb.MAR, μm/day), and trabecular bone formation rate (Tb. BFR/BV or BFR/TV, %/day), were quantified from unstained sections. Mineralizing surface was also normalized to osteoblast surface (MS/Ob.S, %), to quantify formation on a per-cell basis [28]. Periosteal and endocortical mineralizing surface (Ps. MS/BS and Ec.MS/BS, %) and mineral apposition rate (Ps.MAR and Ec.MAR, μm/day) were quantified from the unstained femoral mid-diaphysis cross-sections [28].
2.9. Immunohistochemistry and DNA damage in the tibia
Tibias were decalcified for 5 days in 15% EDTA; complete decalcification was confirmed by x-ray. Decalcified bones were embedded in paraffin and sectioned at a thickness of 8 microns. Immunohistochemical staining was performed with antibodies directed to Hdac3 (Millipore 06-890, 1:50 dilution), or an IgG isotype control (Vector Laboratories I-1000). Chromogens were developed using a polyvalent secondary HRP detection kit (Abcam) followed by incubation in DAB (Sigma Aldrich). Sections were counterstained with fast green. DNA damage was assessed histologically with an in situ TUNEL detection kit (Roche #11 767 305 001, #11 767 291 910). TUNEL stained slides were mounted with DAPI-containing medium (Vectashield) and examined via fluorescence microscopy.
2.10. BMSC growth, mineralization and gene expression
Bone marrow was flushed from femurs and tibias of adult mice, and cells were immediately seeded into 6-well plates at 1 × 10⁷ cells per well or in 12-well plates on glass coverslips at 4 × 10⁶ cells per well in osteogenic culture medium (alpha-MEM, 20% FBS, 1% antibiotic / antimycotic (Invitrogen #15240-062), 1% non-essential amino acids, 50 μg/ml ascorbic acid, 10 mM beta glycerol phosphate, and 10-8 M dexamethasone). Media were changed every three days after seeding, and bone marrow stromal cells (BMSC) were selected by their ability to adhere to the plate after the first three days in culture. BMSC were cultured for 21 days in osteogenic medium to promote calcified matrix production. Cells were fixed in 10% neutral buffered formalin and stained with 2% alizarin red to detect matrix calcification; staining was quantified with Bioquant Osteo [11]. For gene expression studies, RNA was harvested with TRIzol reagent (Invitrogen). RNA was reverse transcribed and expression levels of mRNAs associated with osteoblast maturation (Runx2, type I collagen, alkaline phosphatase, and Bglap) were quantified as described above and previously [11] (Table 1).
For ex vivo DNA damage studies, BMSC were grown on glass coverslips in osteogenic medium for six days, after which they were immunostained with an anti-phospho-γH2AX-Alexa Fluor® 488 conjugated antibody (Biolegend #613405, San Diego, CA; 1 μg/ml) as previously described [11]. DNA damage was quantified by assessing the percentage of cells demonstrating nuclear γH2AX staining using image analysis software (Bioquant Osteo, Nashville, TN) and a confocal microscope (Zeiss LSM 510) as described previously [11]. More than 150 cells were measured from each culture.
For TUNEL assays of DNA damage, BMSC were grown on glass coverslips in osteogenic medium for seven days. Cells were fixed with 4% paraformaldehyde, lysed with PBS containing 0.1% TritonX-100 and 0.1% sodium citrate, and stained with the TUNEL staining kit as described above (Roche). Fluorescent cells were quantified in 15 fields of view as the relative percentage of TUNEL positive nuclei using image analysis software (Bioquant Osteo).
2.10. Isolation and culture of immature mouse articular chondrocytes (IMACs)
Immature mouse articular chondrocytes (IMACs) were isolated as described by Gosset et al. [29]. Briefly, the femoral head and tibial plateau were dissected from 4 wk old mice. Cartilage pieces were digested twice in 3 mg/ml collagenase for one hour and then overnight in 0.5 mg/ml collagenase. The resulting suspension of freshly isolated IMACs was placed in micromass culture by plating 10 μl drops containing 2 × 10⁵ cells in DMEM, 5% FBS supplemented with 25 μg/ml ascorbic acid, 54 μg/ml beta-glycerol phosphate and 1X ITS (Invitrogen, Carlsbad, CA) as previously published [30-32]. Culture medium was changed every three days for 21 days. Cells were fixed at various times and stained with either alcian blue (to highlight matrix proteoglycan content) or alizarin red (to highlight matrix calcification).
2.11. Statistics
Statistics were performed with JMP 9.0 statistical analysis software (SAS Institute Inc., Cary, NC). Data were compared between groups within each experiment with Student’s t-tests (when only two groups were compared) or ANOVA (when three groups were compared) with Tukey-Kramer HSD post-hoc multiple comparisons test. A significance of p < 0.05 was used for all comparisons.
3. Results
3.1. Hdac3 CKOOCN mice develop normally
Hdac3 was abundantly expressed in demarrowed cortical bone extracts from 5 to 6 wk-old Hdac3fl/fl, Cre- control and Hdac3+/+, Cre+ control groups, whereas Hdac3 expression levels were reduced by 40% to 90% in cortical bone of Hdac3fl/fl, Cre+ CKO (Hdac3 CKOOCN) mice (Figure 1A-C). Cells in the cortical bone of Hdac3 CKOOCN mice had 4-fold higher levels of acetylated histone 3 (AcH3) as compared to Hdac3fl/fl, Cre- control mice (Figure 1B, D). Acetylated histone 4 (AcH4) levels were also elevated, indicating that Hdac3 depletion had marked effects on chromatin structure. Immunohistochemistry confirmed that Hdac3 was reduced in both osteocytes and osteoblasts (Figure 1E-F). All Hdac3 CKOOCN mice appeared grossly normal at birth and had normally patterned skeletons (Figure S1A-B). Femur length was comparable between Hdac3 CKOOCN and control mice at all ages investigated (data not shown). No differences were observed in body weights of male Hdac3 CKOOCN as compared to Hdac3fl/fl, Cre- littermates at 3, 4, 6, and 12 wk of age (Figure S1C), whereas a small but significant decrease in body mass was observed in 24 wk old male Hdac3 CKOOCN mice as compared to age-matched Hdac3fl/fl, Cre- control mice. The body weights of female Hdac3 CKOOCN were comparable to Hdac3fl/fl, Cre- control mice at all ages investigated (Figure S1D).
Figure 1. Hdac3 expression is reduced in Hdac3 CKOOCN mice.

(A) Western blots of demarrowed cortical bone protein extracts from 6 wk old Hdac3fl/fl, Cre- control, Hdac3+/+, Cre+ control, and Hdac3 CKOOCN mice. Relative intensity of Hdac3 normalized to Actin appears beneath each lane. (B) Western blots of demarrowed cortical bone protein extracts from 5 wk old Hdac3fl/fl, Cre- control and Hdac3 CKOOCN mice. (C-D) Relative intensity of Hdac3 normalized to Actin (C) and AcH3 normalized to H3 (D) for bands in (B) are plotted; means ± SEM are presented. (E-F) Immunohistochemistry of Hdac3 expression in osteocyte nuclei (arrows) (E) and osteoblasts (arrows) (F) within cortical bone of 6 wk old Hdac3fl/fl, Cre- control or Hdac3 CKOOCN mice. AcH3: acetylated histone 3, AcH4: acetylated histone 4, Ctrl: control.
3.2. Areal bone mineral density is reduced in Hdac3 CKOOCN mice
DXA revealed a progressive decrease in BMD with age in both male and female Hdac3 CKOOCN mice (Figure S2). No differences were observed in BMD between Hdac3fl/fl, Cre- control and Hdac3 CKOOCN mice at 4 wk of age, but by 12 wk of age, BMD of the lower body and femoral diaphysis were decreased (-6.6% lower body, -7.6% femur) in female Hdac3 CKOOCN as compared to age- and sex-matched Hdac3fl/fl, Cre- control mice (Figure S2). Similar results were observed at 24 wk of age, as BMD of both the lower body (-8.0%) and femoral diaphysis (-12.4%) were lower in the female Hdac3 CKOOCN as compared to Hdac3fl/fl, Cre- control mice. BMD also tended to be lower in male Hdac3 CKOOCN mice relative to their respective controls, although not all differences achieved statistical significance (Figure S2). It is possible that the slight decrease in body mass in the aged males obscured trends in BMD, contributing to the lack of statistical significance.
3.3. Bone architecture, volumetric mineralization, and material properties are reduced in Ocn-Hdac3 CKO mice
For more accurate measurements of bone structure, trabecular and cortical bone architecture and volumetric mineralization were assessed by micro-computed tomography in male mice. No differences were observed in trabecular bone properties between Hdac3fl/fl, Cre- control and Hdac3+/+, Cre+ control mice through 12 wk of age (Table 2). Trabecular bone properties were comparable between Hdac3 CKOOCN mice and both control groups at 4 wk of age (Table 2). However, by 6 wk of age, Hdac3 CKOOCN mice displayed a 22% reduction in trabecular number and a 30% increase in trabecular separation as compared to age-matched Hdac3fl/fl, Cre- control and Hdac3+/+, Cre+ control mice. These differences persisted in 12 and 24 wk animals and increased in magnitude with age (Table 2); by 24 wk of age, Hdac3 CKOOCN animals demonstrated a striking 50% decrease in trabecular bone volume fraction as compared to age-matched control mice (Table 2). Female Hdac3 CKOOCN mice also showed prominent trabecular bone loss; bone volume fraction in female Hdac3 CKOOCN mice was reduced by 85% as compared to Hdac3fl/fl, Cre- control mice at 24 wk of age. (Figure 2A, Table S1). Taken together, these data demonstrate that Hdac3 CKOOCN mice begin to lose trabecular bone mass between 4 and 6 weeks of age.
Table 2.
Trabecular bone architecture in male mice
| Age | Genotype | n | BV/TV | Tb.N, 1/mm | Tb.Th, mm | Tb.Sp, mm |
|---|---|---|---|---|---|---|
| 4 wk | Hdac3fl/fl, Cre- control | 5 | 0.081 (0.019) | 4.89 (0.68) | 0.029 (0.001) | 0.209 (0.031) |
| Hdac3+/+, Cre+ control | 4 | 0.101 (0.029) | 4.99 (0.88) | 0.032 (0.003) | 0.209 (0.031) | |
| Hdac3 CKOOCN | 7 | 0.094 (0.030) | 4.75 (0.61) | 0.033 (0.004) | 0.185 (0.075) | |
| 6 wk | Hdac3fl/fl, Cre- control | 4 | 0.163 (0.067) | 6.25 (0.75)* | 0.036 (0.005) | 0.160 (0.019)* |
| Hdac3+/+, Cre+ control | 5 | 0.132 (0.015) | 6.18 (0.62)* | 0.032 (0.001)* | 0.161 (0.018)* | |
| Hdac3 CKOOCN | 12 | 0.111 (0.027) | 4.80 (0.44) | 0.038 (0.004) | 0.208 (0.016) | |
| 12 wk | Hdac3fl/fl, Cre- control | 5 | 0.120 (0.023) | 5.15 (0.53)* | 0.038 (0.004) | 0.192 (0.020)* |
| Hdac3+/+, Cre+ control | 3 | 0.138 (0.049) | 5.45 (0.43)* | 0.038 (0.006) | 0.180 (0.015)* | |
| Hdac3 CKOOCN | 9 | 0.104 (0.046) | 4.18 (0.39) | 0.045 (0.009) | 0.241 (0.023) | |
| 24 wk | Hdac3fl/fl, Cre- control | 5 | 0.101 (0.025)* | 4.11 (0.19)* | 0.043 (0.004)* | 0.240 (0.011)* |
| Hdac3 CKOOCN | 7 | 0.052 (0.013) | 3.63 (0.35) | 0.038 (0.005) | 0.277 (0.027) |
Means and (standard deviations) are shown.
p ≤ 0.05 vs. Hdac3 CKOOCN
Figure 2. Bone architecture and bone quality are reduced in Hdac3 CKOOCN mice.
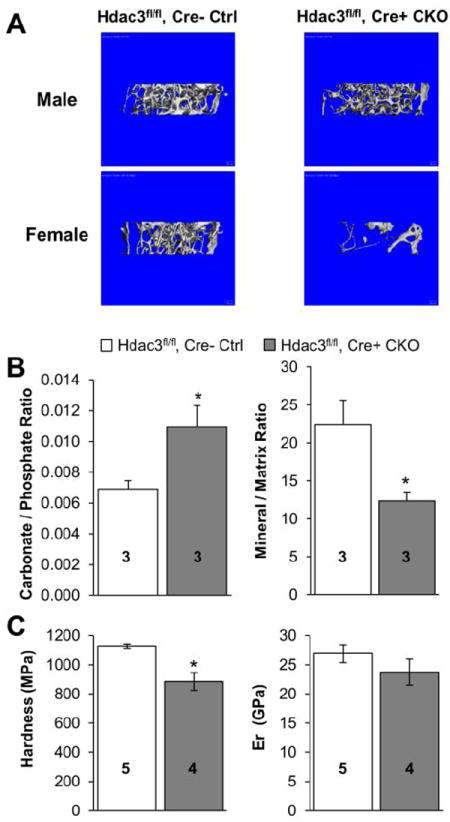
(A) Representative 3D reconstructions of trabecular bone architecture in the distal femoral metaphysis from Hdac3fl/fl, Cre- control and Hdac3 CKOOCN mice. (B) Cortical bone extracellular matrix composition was analyzed via FT-IR in histological sections from 4 wk old mice. (C) Cortical bone material properties in 12 wk old mice were measured by nanoindentation. Hardness was significantly reduced in the Hdac3 CKOOCN mice, but reduced modulus (Er) was not different between Hdac3 CKOOCN and Hdac3fl/fl, Cre- control mice (p = 0.318). Means + SEM are presented *p ≤ 0.05 vs. Hdac3fl/fl, Cre- control. Sample numbers are stated on each bar.
Few differences were observed in the morphology and mineralization of cortical bone at the femoral diaphysis between control groups and Hdac3 CKOOCN mice at 4 wk and 6 wk of age. At 12 wk of age, however, Hdac3 CKOOCN mice presented with lower cortical bone material mineral density as compared to age-matched Hdac3fl/fl, Cre- (-3%) and Hdac3+/+, Cre+ control (-5%) mice, and this difference persisted in the 24 wk old animals (Table 3). Cortical bone area was not different between groups at 4, 6, and 12 wk of age, but was lower (-16%) in the 24 wk old Hdac3 CKOOCN as compared to Hdac3fl/fl, Cre- control mice (Table 3). Cortical bone thickness was not significantly different between groups at any age investigated. Cortical bone properties were comparable between both control groups (Table 3). Female Hdac3 CKOOCN mice also showed prominent cortical bone loss (Ct.Ar: -17%) and decreased cortical bone mineralization (-3%) in the femoral diaphysis as compared to Hdac3fl/fl, Cre- controls at 24 wk of age (Table S2). Thus, cortical bone in adult Hdac3 CKOOCN mice demonstrates altered geometry and reduced mineral density.
Table 3.
Cortical bone architecture and mineralization in male mice
| Age | Genotype | n | Ct.Ar, mm2 | Ct.Th, mm | Ct.Mat.M.Dn, mgHA/ccm |
|---|---|---|---|---|---|
| 4 wk | Hdac3fl/fl, Cre- control | 5 | 0.421 (0.035) | 0.099 (0.008) | 1054 (12) |
| Hdac3+/+, Cre+ control | 3 | 0.485 (0.061) | 0.112 (0.012) | 1122 (18)* | |
| Hdac3 CKOOCN | 7 | 0.446 (0.042) | 0.111 (0.008) | 1066 (19) | |
| 6 wk | Hdac3fl/fl, Cre- control | 4 | 0.624 (0.118) | 0.137 (0.014) | 1077 (6) |
| Hdac3+/+, Cre+ control | 5 | 0.566 (0.043) | 0.122 (0.006) | 1091 (24)* | |
| Hdac3 CKOOCN | 11 | 0.605 (0.086) | 0.138 (0.013) | 1063 (15) | |
| 12 wk | Hdac3fl/fl, Cre- control | 5 | 0.545 (0.080) | 0.173 (0.016) | 1198 (17)* |
| Hdac3+/+, Cre+ control | 3 | 0.556 (0.022) | 0.171 (0.008) | 1182 (10)* | |
| Hdac3 CKOOCN | 9 | 0.521 (0.080) | 0.171 (0.016) | 1143 (18) | |
| 24 wk | Hdac3fl/fl, Cre- control | 5 | 0.858 (0.057)* | 0.193 (0.007) | 1260 (9)* |
| Hdac3 CKOOCN | 7 | 0.721 (0.098) | 0.177 (0.026) | 1226 (21) |
Means and (standard deviations) are shown.
p ≤ 0.05 vs. Hdac3 CKOOCN
FT-IR analyses were performed on histological sections of cortical bone from 4 wk old mice to investigate bone composition. Surprisingly, despite the lack of change in cortical bone mineralization measured via microCT at this age, cortical bone from the Hdac3 CKOOCN mice demonstrated a significantly lower (-38%) mineral to matrix ratio as compared to age-matched Hdac3fl/fl, Cre- control mice (Figure 2B). Furthermore, the carbonate to phosphate ratio of Hdac3 CKOOCN cortical bone was significantly higher (+31%) as compared to Hdac3fl/fl, Cre- control cortical bone (Figure 2B). These data suggest that cortical bone composition is unfavorably altered by Hdac3 insufficiency in young mice.
Nanoindentation tests were performed on cortical bone samples from the femoral midshaft of 12 wk old mice to determine if the mineralization abnormalities had biological relevance. Hardness was 22% lower in Hdac3 CKOOCN as compared to Hdac3fl/fl, Cre- control mice (Figure 2C). Reduced modulus was 12% lower, although this difference did not achieve statistical significance (Figure 2C). Thus, loss of Hdac3 in mature osteoblasts and osteocytes compromises bone material properties.
3.4. Osteoblastic and osteocytic gene expression is reduced in Hdac3 CKOOCN mice tissue
To gain insight into the early mechanisms responsible for the poor bone quality of the Hdac3 CKOOCN mice, we analyzed cortical bone gene expression in 2 wk old animals. Expression levels of genes relating to osteoblast maturation (e.g., alkaline phosphatase (Alpl), Collagen 1a (Col1a1), and Bglap) were lower in Hdac3 CKOOCN mice as compared to Hdac3+/+, Cre+ controls. The reductions matched the decrease in Hdac3 expression in this heterogeneous cell population (Figure 3A). Osteocyte genes, including Sost and Mepe, were also reduced (Figure 3A) in the Hdac3 CKOOCN mice, consistent with decreased expression of Hdac3 in this cell population seen via immunohistochemistry. No differences were observed in expression levels of representative genes relating to cell proliferation (CyclinD1 and Cdkn1a (p21)) (Figure 3A). Rankl and Opg expression were analyzed to determine if signals were favorable for an unbalanced increase in osteoclastogenesis that could explain the lower bone mass in the knockout mice. However, no differences were observed in expression of Rankl, Opg, or the ratio of Rankl to Opg expression in Hdac3 CKOOCN mice as compared to Hdac3+/+, Cre+ controls (Figure 3A-B).
Figure 3. Osteoblast and osteocyte gene expression is decreased in demarrowed cortical bone from 2 wk old Hdac3 CKOOCN mice.
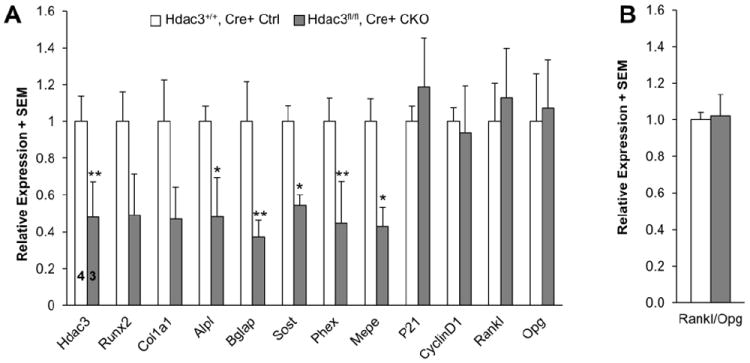
(A) Transcript levels for the specified genes were normalized to the reference gene Gapdh according to the 2ˆ(-delta delta) CT method. Data are expressed as fold change in gene expression relative to Hdac3+/+, Cre+ control mice. (B) The ratio of Rankl to Opg expression was not different between Hdac3+/+, Cre+ control and Hdac3 CKOOCN mice. Means + SEM of n = 4 Hdac3+/+, Cre+ control, 3 Hdac3 CKOOCN mice are presented. *p ≤ 0.05, **p < 0.07.
3.5. Serum markers of bone remodeling and serum calcium levels are decreased in Ocn-Hdac3 CKO mice
To further explore the possibility that bone remodeling is altered in Hdac3 CKOOCN mice, serum levels of TRAcP5b (a marker of bone resorption/osteoclast number), P1NP (bone formation indicator), and calcium were measured. TRAcP5b levels were comparable between Hdac3+/+, Cre+ control and Hdac3 CKOOCN at 4 wk of age, but were 31% lower in Hdac3 CKOOCN as compared to Hdac3+/+, Cre+ controls at 6 wk of age and 58% lower as compared to Hdac3fl/fl, Cre- control mice 24 wk of age (Figures 4A-B). Serum P1NP (bone formation marker) levels followed a similar pattern, in that they were not different between Hdac3 CKOOCN and Hdac3+/+, Cre+ control mice at 4 wk of age but were 34% lower in Hdac3 CKOOCN as compared to Hdac3+/+, Cre+ control mice by 6 wk of age (Figure 4C). P1NP levels were not different between Hdac3 CKOOCN and Hdac3fl/fl, Cre- control mice at 24 wk of age (Figure 4D). The large age-related reduction in P1NP levels within control animals may contribute to this lack of difference between the control and Hdac3-CKOOCN animals. However, another likely contributing factor is that aged Hdac3 CKOOCN mice were prone to skeletal fractures (Figure S3), which can trigger bone formation associated with fracture healing and thus raise the P1NP levels in Hdac3 CKOOCN mice. Indeed, subsequent skeletal examination indicated that all of the 24 month old Hdac3 CKOOCN mice used for analysis of P1NP levels presented with discernible fractures, many of which were in various stages of remodeling (Figure S3), while no fractures were detected in their control littermates. Serum calcium levels were slightly lower in Hdac3 CKOOCN as compared to Hdac3fl/fl, Cre- control mice at 6 wk of age (-7.6%, p = 0.173) and similarly trended lower at 24 wk of age (-7.1%, p = 0.073) (Figure S4). Taken together, these data indicate that the reduced bone mass in the Hdac3 CKOOCN mice is due to defects in bone formation, rather than to increases in bone resorption. These results are consistent with trends we observed in osteoblastic gene expression in the cortical bone of Hdac3 CKOOCN mice.
Figure 4. Serum markers of bone remodeling are decreased in Hdac3 CKOOCN mice.
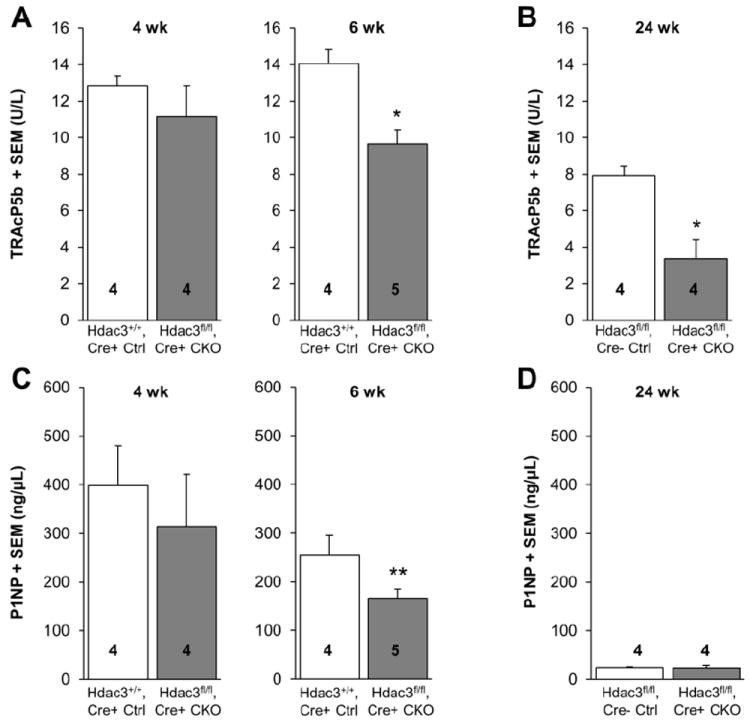
Serum was collected from male mice at sacrifice. (A-B) Serum levels of TRAcP5b (a marker of bone resorption) in control and Hdac3 CKOOCN mice at 4, 6 and 24 wk of age. (C-D) Serum levels of P1NP (a marker of bone formation) in the same animals. Means + SEM are presented. *p ≤ 0.05 vs. age-matched controls. **p < 0.1.
3.6. Histological indices of bone remodeling
Histomorphometry was utilized to measure osteoblast and osteoclast numbers and activities. Histological indices of total osteoclast number (N.Oc/T.Ar) were 39% lower in Hdac3 CKOOCN mice as compared to Hdac3+/+, Cre+ controls, but other osteoclastic indices were not different between the groups (Table 4). Although there were significant reductions in trabecular number in 6 wk old Hdac3 CKOOCN animals (Table 2), osteoblast numbers per bone surface or area (Ob.S/BS and N.Ob/B.Ar) were increased approximately 2-fold in 6 wk old Hdac3 CKOOCN as compared to age-matched Hdac3+/+, Cre+ control mice (Table 4). However, osteoblast number normalized to tissue area was not different between genotypes because of the decreased trabecular bone volume in the Hdac3 CKOOCN mice. Closer examination revealed that osteoblasts occupying the bone surface in Hdac3 CKOOCN animals had a flattened morphology, suggesting impaired function (Figure 5A). Consistent with this hypothesis, dynamic indices of trabecular bone formation (e.g., mineral apposition rate) were not different between Hdac3 CKOOCN mice and Hdac3fl/fl, Cre- controls despite higher osteoblast numbers in the Hdac3 CKOOCN mice (Table 5), and mineralizing surface normalized to osteoblast surface (indicative of formation on a per-cell basis) was decreased in the Hdac3 CKOOCN mice (Table 5). Periosteal and endocortical mineral apposition rates were not significantly different between the groups (Table 6). However, in the femoral diaphysis, periosteal and endocortical mineralizing surfaces were 20% and 30% lower, respectively, in Hdac3 CKOOCN as compared to Hdac3fl/fl, Cre- control mice, consistent with the reduced serum levels of P1NP that suggested lower bone formation. Together, these results indicate that osteoblasts are present in the Hdac3 CKOOCN animals, but they are not functioning to full capacity. These results are consistent with changes in bone mass and matrix composition seen by DXA, microCT, and FT-IR.
Table 4.
Static trabecular bone histological remodeling indices
| Genotype | n | Ob.S/BS, % | N.Ob/B.Ar, #/mm2 | N.Ob/T.Ar, #/mm2 | n | Oc.S/BS, % | N.Oc/B.Ar, #/mm2 | N.Oc/T.Ar, #/mm2 |
|---|---|---|---|---|---|---|---|---|
| Hdac3+/+, Cre+ control | 7 | 14.5 (6.1)* | 605 (233)* | 83.8 (35.1) | 6 | 19.7 (7.4) | 486 (221) | 73.5 (24.3)* |
| Hdac3 CKOOCN | 8 | 22.5 (6.1) | 1129 (415) | 82.0 (27.2) | 7 | 16.6 (5.2) | 572 (278) | 44.7 (15.8) |
Means and (standard deviations) are shown.
p ≤ 0.05 vs. Hdac3 CKOOCN
Figure 5. Osteoblast morphology and TUNEL staining suggest impaired osteoblast differentiation and genome integrity in Hdac3 CKOOCN mice.
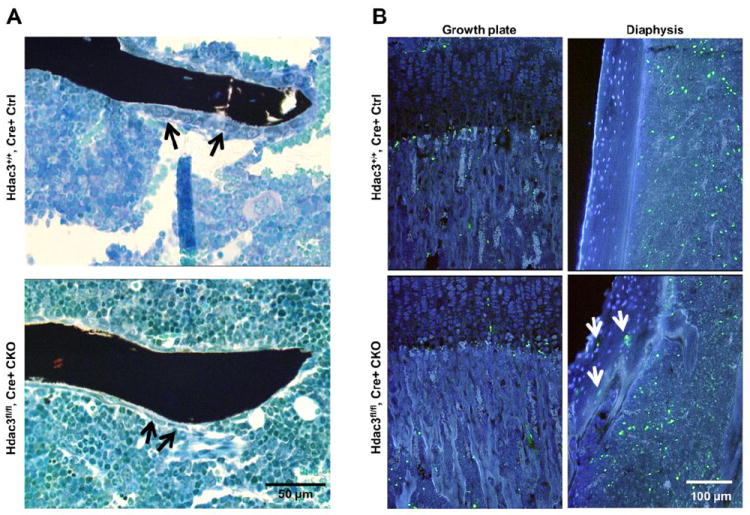
(A) Trabecular bone from 6 wk old Hdac3+/+, Cre+ control or Hdac3 CKOOCN mice stained by VonKossa/MacNeals tetrachrome. Osteoblasts (arrows) in the Hdac3 CKOOCN mice frequently had a more flattened morphology as compared to osteoblasts in control mice. (B) TUNEL staining of growth plate and cortical bones from Hdac3+/+, Cre+ control and Hdac3 CKOOCN mice (white arrows indicate TUNEL positive osteocytes). Green = TUNEL, blue = DAPI.
Table 5.
Dynamic trabecular bone histological remodeling indices
| Genotype | n | MS/BS, % | MS/Ob.S, % | MAR, μm/day | BFR/BV, %/yr | BFR/TV, %/yr |
|---|---|---|---|---|---|---|
| Hdac3+/+, Cre+ control | 4 | 37.5 (6.1) | 3.32 (1.20)* | 2.41 (0.21) | 5.66 (0.42) | 0.58 (0.23) |
| Hdac3 CKOOCN | 5 | 38.7 (3.3) | 1.88 (0.52) | 2.46 (0.62) | 5.18 (0.70) | 0.43 (0.15) |
Means and (standard deviations) are shown.
p ≤ 0.05 vs. Hdac3 CKOOCN
Table 6.
Cortical bone histological remodeling indices
| Genotype | n | Ps.MS/BS, % | Ps.MAR, μm/day | Ec.MS/BS, % | Ec.MAR, μm/day |
|---|---|---|---|---|---|
| Hdac3+/+, Cre+ control | 3 | 74.8 (3.2)* | 3.88 (0.19) | 38.2 (4.0)** | 1.56 (0.25) |
| Hdac3 CKOOCN | 3 | 50.9 (2.8) | 4.91 (0.39) | 30.6 (6.4) | 2.44 (0.50) |
Means and (standard deviations) are shown.
p < 0.1 vs. Hdac3 CKOOCN;
p ≤ 0.05 vs. Hdac3 CKOOCN
3.7. Stromal cells from Hdac3 CKOOCN mice are impaired in their ability to form matrix-producing osteoblasts and display signs of DNA damage
To understand the mechanisms responsible for the deleterious effects of Hdac3-insufficiency on osteoblast function in vivo, primary bone marrow stromal cells (BMSC) were isolated and cultured under osteogenic conditions. BMSC from the Hdac3 CKOOCN mice cultured for 21 days showed a 50% to 70% reduction in the amount of mineralized matrix formed relative to cells from age-matched Hdac3fl/fl, Cre- control mice (Figure 6A). Microscopic examination showed both cellular and extracellular matrix deficiencies in the Hdac3 CKOOCN cultures (Figure 6A). Hdac3 CKOOCN BMSCs had reduced expression levels of Hdac3 and genes related to osteoblast maturation (Runx2, Col1a1, Alpl, and Bglap) as compared to cultures from Hdac3fl/fl, Cre- control mice (Figure 6B). Osteoblasts from the Hdac3 CKOOCN mice demonstrated 2- to 3-fold increases in DNA damage (evidenced by TUNEL and phosphorylated γH2AX staining, respectively, (Figure 6C-D) relative to cells from Hdac3fl/fl, Cre- control mice. Thus, Hdac3 insufficiency leads to impaired osteoblastic differentiation and induction of DNA damage in differentiating osteoblasts. Primary chondrocytes from the Hdac3 CKOOCN mice were not impaired in their ability to produce a cartilaginous, calcified matrix, likely because chondrocyte expression of Hdac3 was not affected in the Hdac3CKOOCN mice (Figure S5). These data demonstrate that Hdac3 is required for osteoblast survival and function.
Figure 6. Osteogenic culture of bone marrow stromal cells (BMSC) recapitulates osteoblastic defects in Hdac3 CKOOCN mice.
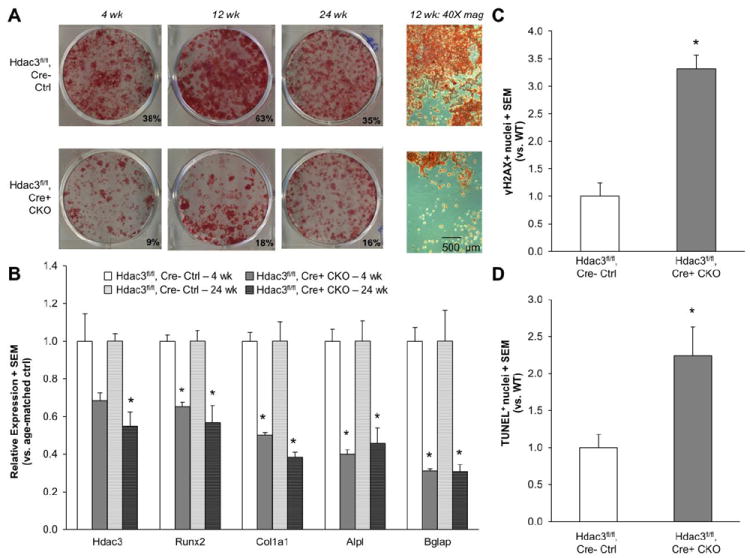
(A) Cells isolated from 4 wk, 12 wk, and 24 wk old mice were grown in osteogenic medium for 21 days. Representative alizarin red stained wells from Hdac3fl/fl, Cre- control and Hdac3 CKOOCN mouse cultures from all three ages of mice are presented. (B) mRNA expression in the Hdac3fl/fl, Cre- control and Hdac3 CKOOCN cultures from 4 wk and 24 wk old mice after 21 days of osteogenic differentiation. Transcript levels for the specified genes were normalized to the reference gene Gapdh, and all samples were analyzed in triplicate. Data are expressed as fold change in gene expression relative to Hdac3fl/fl, Cre- control cultures. (C) BMSC seeded onto glass coverslips were cultured in osteogenic media for 6 days, after which they were stained with antibodies for phosphorylated γH2AX, an indicator of DNA damage. Data plotted are the number of γH2AX positive nuclei versus the total number of DAPI positive nuclei. More than 150 cells were measured from each culture. (D) BMSC seeded onto glass coverslips were cultured in osteogenic media for 7 days, after which they were TUNEL stained for another quantification of DNA damage, measured as TUNEL positive nuclei fraction (#TUNEL+ nuclei / # DAPI-stained nuclei). TUNEL staining was quantified in 15 fields of view from each culture Means + SEM are presented. *p ≤ 0.05 vs. WT cultures.
3.8. Cortical osteocytes in Hdac3 CKOOCN exhibit DNA damage in vivo
Because the in vitro data suggested that Hdac3 is required for osteoblast function and genome integrity and because cortical bone structure and hardness were reduced in Hdac3 CKOOCN mice, TUNEL staining was performed on decalcified tibial sections to determine if cortical osteoblasts and osteocytes also had DNA damage. TUNEL positive cells were abundant in the cortical bone of Hdac3 CKOOCN mice, but not in the cortical bone of Hdac3fl/fl, Cre- control mice at both 6 and 12 wk of age (Figure 5B). No substantial differences were noted in the relative abundance of TUNEL positive cells in the growth plate or primary spongiosa. These data suggest that loss of Hdac3 promotes DNA damage in mature osseous cells.
4. Discussion
Hdac3 is essential for the proper development of many body systems. This was first emphasized by studies indicating that germline knockout of Hdac3 is embryonically lethal prior to E9.5 [16]. Subsequent reports described Hdac3’s post-embryonic role in specific tissues, including the liver, skeletal and cardiac muscle, and in early skeletal development [17, 20, 33-35]. Our previous studies of Hdac3 in the skeletal system utilized a Cre recombinase expressed under the control of the Osterix promoter (Osx-Cre), which deleted Hdac3 in osteochondral progenitor cells [17]. These Hdac3 CKOOSX mice had severe craniofacial and developmental abnormalities that were apparent within 1 week of birth. These skeletal deficiencies had both bone and cartilage components, consistent with the expression of Osx (Sp7) in both of these cell populations [36-38]. The goal of the current study was to better localize the effects of Hdac3-insufficiency to the osteoblast population, independent of effects in cartilage, to understand Hdac3’s role in osseous development.
Hdac3 CKOOCN mice had normal growth plates, and primary chondrocytes from the Hdac3-insufficent mice showed no impairment of their ability to produce matrix in vitro (Figure S5). This likely explains why the skeletons of Hdac3 CKOOCN mice were normally patterned with bone lengths and body size comparable to control mice in the current study (Figure S1), whereas Hdac3 CKOOSX mice were smaller than their control littermates [17]. Although the OCN-Cre transgene was reported to show activity in hypertrophic chondrocytes [39], Hdac3 is not expressed at this stage of chondrocyte maturation in wildtype mice (Figure S5) and thus all phenotypes in Hdac3 CKOOCN are likely to emerge from functional deficits in osseous cells. Hdac3 insufficiency in committed osteoblasts caused DNA damage, ultimately impairing normal osteoblast function and bone formation. Unlike the Hdac3 CKOOSX mice, Hdac3 CKOOCN mice did not have a relative increase in marrow adiposity, possibly because cells were more firmly committed to the osteoblast lineage at the time of Hdac3 deletion.
Similarities did exist between the current study and our previous model, in that both Hdac3 CKOOSX and Hdac3 CKOOCN mice had low cortical and trabecular bone mass as compared to age-matched control mice, although the decreased bone mass was less severe in the Hdac3 CKOOCN model and only became apparent as the animals aged. Bones of Hdac3 CKOOSX mice fractured during tissue harvest [17], and comparably, in vivo fractures were observed in 12- and 24 wk old Hdac3 CKOOCN mice (Figure S3). The observed fragility of the Hdac3 CKOOCN mouse bones was likely due to both structural and compositional changes in the skeleton. Decreased cortical bone area in the aged Hdac3 CKOOCN mice represents a geometrical change that negatively affects whole bone mechanical behavior [40]. At the material level, both microCT and FT-IR analyses revealed defects in cortical bone mineralization in the Hdac3 CKOOCN mice as cortical bone tissue mineral density and mineral to matrix ratio were lower in the Hdac3-insufficient animals as compared to control littermates. A decreased mineral to matrix ratio and an increased carbonate to phosphate ratio (Figure 2B) are evidence of poor bone quality that increases fracture risk, as has been reported in dogs treated with calcitonin [41, 42]. Accordingly, decreased cortical bone mineralization in the Hdac3 CKOOCN mice impacted tissue-level bone material properties, as seen by a reduction in cortical bone hardness via nanoindentation testing, as nanoindentation hardness of bone primarily reflects mineral content [25]. Thus, the increased prevalence of fractures in the aged Hdac3 CKOOCN mice is consistent with the idea that whole bone mechanical strength is strongly related to alterations in bone mass, geometry, and matrix composition [40].
The low bone mass in the Hdac3 CKOOCN mice was largely attributed to impaired bone formation, and not to increased bone resorption. Histological indices of total osteoclast number (N.Oc/T.Ar), serum TRAcP5b levels, and total serum calcium levels were lower, not higher, in the Hdac3-insufficient animals. It is worth noting that osteoclast numbers and serum TRAcP5b levels were similarly reduced in the Hdac3 CKOOCN animals (N.Oc/T.Ar: -39%; serum TRAcP5b: -31%), consistent with the idea that serum TRAcP5b levels are indicative of absolute osteoclast number in the body [43]. These data, documenting the presence of fewer osteoclasts in the Hdac3 CKOOCN mice, coupled with the lack of change in cortical bone expression levels of RANKL, OPG, or the ratio of RANKL/OPG, indicate that an osteoblast-mediated resorptive mechanism is not triggered by Hdac3 insufficiency, implying that changes in bone formation are responsible for the low bone mass phenotype of the Hdac3 CKOOCN mice.
Impaired osteoblast function was best illustrated by lower serum P1NP levels and lower cortical bone mineralizing surfaces in the Hdac3 CKOOCN mice. Paradoxically, brightfield trabecular osteoblastic histological indices demonstrated that Hdac3 CKOOCN mice had a greater number of osteoblasts occupying available trabecular bone surfaces as compared to control mice (Table 4). These parameters are deceiving, however, as the Hdac3 CKOOCN mice did not have an increased amount of trabecular bone mineralizing surface. In fact, mineralizing surface normalized to osteoblast surface was lower in the Hdac3 CKOOCN mice (Table 5), indicating that at least some of these osteoblasts were not functioning properly. Upon closer examination, many of the bone-lining osteoblasts in the Hdac3 CKOOCN mice had a flattened morphology (Figure 5A), consistent with impaired function. Relative expression levels of characteristic osteoblast and osteocyte genes, including the genes encoding alkaline phosphatase (Alpl) and sclerostin (Sost), were decreased in cortical bone explants from Hdac3 CKOOCN as compared to control mice (Figure 3), despite increases in histone acetylation. This phenotype may result from either increased expression of a transcriptional repressor or another cellular mechanism that delays differentiation and associated gene expression programs. In vitro studies with BMSC support the hypothesis that Hdac3 CKOOCN cells differentiate inefficiently into mature osteoblasts, evidenced by the lack of matrix, increased DNA damage (as measured by P-γH2AX and TUNEL staining), and reduced expression of osteoblastic genes in the osteogenic BMSC cultures (Figure 6). Future studies will address whether Hdac3 insufficiency triggers other deleterious mechanisms (e.g., senescence) to impair osteoblastic differentiation. Consistent with our previous mouse model [17], trabecular bone mineral apposition rate was not different between control and Hdac3 CKOOCN mice, which may indicate that the cells capable of surviving or progressing to the matrix production phase of osteoblastic differentiation functioned normally.
A relationship between Hdac3 and genome integrity was previously suggested, as mouse embryonic fibroblasts (MEFs) from Hdac3fl/- animals infected with Adeno-Cre demonstrated genome instability shortly after Hdac3 deletion [16]. Subsequent analysis revealed that Hdac3-deficient MEFs suffered DNA damage that ultimately resulted in cell cycle arrest [16]. Genes relating to DNA damage, including the p53-inducible genes p21CIP1 and Phlda3, were also upregulated in Hdac3 CKOOSX mice [17], and BMSC exposed to the pan-Hdac inhibitor vorinostat during osteoblastic differentiation demonstrated DNA damage and cell cycle arrest [11]. The current study confirms the importance of Hdac3 in bone cells, as Hdac3 CKOOCN mice demonstrated DNA damage in differentiating osteoblasts and osteocytes in vivo and in vitro as compared to cells from control mice. Preventing DNA damage is a vital mechanism in the skeleton as it is an early marker of apoptosis, which is linked to key processes like targeted remodeling [44-47], the anabolic effects of intermittent parathyroid hormone therapy [48, 49], and glucocorticoid-induced osteonecrosis [50, 51]. Hdac3 is therefore positioned to be a key regulatory factor in the regulation of genome stability and bone mass. Understanding the roles of specific Hdac3 in regulating chromatin structure and DNA integrity could yield new strategies for modulating osteoblast behavior in skeletal disorders.
In conclusion, our data confirm that Hdac3 expression in osteoblasts is essential for proper bone formation. Loss of Hdac3 in committed osteoblasts and osteocytes impaired tissue-specific gene expression, caused DNA damage, decreased bone formation, and caused low bone mass. These data demonstrate that Hdac3 is required for osteoblast and osteocyte function.
Research Highlights.
Deleting Hdac3 in mature osteoblasts with Osteocalcin-Cre (Hdac3 CKOOCN) caused progressive cortical and trabecular bone loss with age.
Cortical bone mineralization and material properties were compromised in Hdac3 CKOOCN as compared to control mice.
Bone loss in Hdac3 CKOOCN mice was attributed to decreased bone formation and osteoblast/osteocyte function.
Hdac3 deletion caused DNA damage in osteoblasts and osteocytes in vitro and in vivo.
Chondrocyte activity and growth plate development were not affected in Hdac3 CKOOCN mice
Acknowledgments
The NIAMS supported this work (R01 AR048147, T32 AR056950, F32 AR60140, F32 AR61873). The authors thank David Razidlo and Bridget Stensgard for mouse colony maintenance, the Mayo Clinic Summer Undergraduate Research Fellowship program for funding, and the Mayo Clinic Biomaterials and Quantitative Histomorphometry Core Laboratory for assistance with histological specimen preparation.
Footnotes
Publisher's Disclaimer: This is a PDF file of an unedited manuscript that has been accepted for publication. As a service to our customers we are providing this early version of the manuscript. The manuscript will undergo copyediting, typesetting, and review of the resulting proof before it is published in its final citable form. Please note that during the production process errors may be discovered which could affect the content, and all legal disclaimers that apply to the journal pertain.
References
- 1.Glozak MA, Sengupta N, Zhang X, Seto E. Acetylation and deacetylation of non-histone proteins. Gene. 2005;363:15–23. doi: 10.1016/j.gene.2005.09.010. [DOI] [PubMed] [Google Scholar]
- 2.Jeon EJ, Lee KY, Choi NS, Lee MH, Kim HN, Jin YH, Ryoo HM, Choi JY, Yoshida M, Nishino N, Oh BC, Lee KS, Lee YH, Bae SC. Bone morphogenetic protein-2 stimulates Runx2 acetylation. J Biol Chem. 2006;281:16502–11. doi: 10.1074/jbc.M512494200. [DOI] [PubMed] [Google Scholar]
- 3.Schroeder TM, Kahler RA, Li X, Westendorf JJ. Histone deacetylase 3 interacts with runx2 to repress the osteocalcin promoter and regulate osteoblast differentiation. J Biol Chem. 2004;279:41998–2007. doi: 10.1074/jbc.M403702200. [DOI] [PubMed] [Google Scholar]
- 4.Hesse E, Saito H, Kiviranta R, Correa D, Yamana K, Neff L, Toben D, Duda G, Atfi A, Geoffroy V, Horne WC, Baron R. Zfp521 controls bone mass by HDAC3-dependent attenuation of Runx2 activity. J Cell Biol. 2010;191:1271–83. doi: 10.1083/jcb.201009107. [DOI] [PMC free article] [PubMed] [Google Scholar]
- 5.Juan LJ, Shia WJ, Chen MH, Yang WM, Seto E, Lin YS, Wu CW. Histone deacetylases specifically down-regulate p53-dependent gene activation. J Biol Chem. 2000;275:20436–43. doi: 10.1074/jbc.M000202200. [DOI] [PubMed] [Google Scholar]
- 6.Luo J, Su F, Chen D, Shiloh A, Gu W. Deacetylation of p53 modulates its effect on cell growth and apoptosis. Nature. 2000;408:377–81. doi: 10.1038/35042612. [DOI] [PubMed] [Google Scholar]
- 7.Zhang F, Shi Y, Wang L, Sriram S. Role of HDAC3 on p53 expression and apoptosis in T cells of patients with multiple sclerosis. PLOS One. 2011;6:e16795. doi: 10.1371/journal.pone.0016795. [DOI] [PMC free article] [PubMed] [Google Scholar]
- 8.Haberland M, Mokalled MH, Montgomery RL, Olson EN. Epigenetic control of skull morphogenesis by histone deacetylase 8. Genes Dev. 2009;23:1625–30. doi: 10.1101/gad.1809209. [DOI] [PMC free article] [PubMed] [Google Scholar]
- 9.Vega RB, Matsuda K, Oh J, Barbosa AC, Yang X, Meadows E, McAnally J, Pomajzl C, Shelton JM, Richardson JA, Karsenty G, Olson EN. Histone deacetylase 4 controls chondrocyte hypertrophy during skeletogenesis. Cell. 2004;119:555–66. doi: 10.1016/j.cell.2004.10.024. [DOI] [PubMed] [Google Scholar]
- 10.Zhang Y, Kwon S, Yamaguchi T, Cubizolles F, Rousseaux S, Kneissel M, Cao C, Li N, Cheng HL, Chua K, Lombard D, Mizeracki A, Matthias G, Alt FW, Khochbin S, Matthias P. Mice lacking histone deacetylase 6 have hyperacetylated tubulin but are viable and develop normally. Mol Cell Biol. 2008;28:1688–701. doi: 10.1128/MCB.01154-06. [DOI] [PMC free article] [PubMed] [Google Scholar]
- 11.McGee-Lawrence ME, McCleary-Wheeler AL, Secreto FJ, Razidlo DF, Zhang M, Stensgard BA, Li X, Stein GS, Lian JB, Westendorf JJ. Suberoylanilide hydroxamic acid (SAHA; vorinostat) causes bone loss by inhibiting immature osteoblasts. Bone. 2011;48:1117–26. doi: 10.1016/j.bone.2011.01.007. [DOI] [PMC free article] [PubMed] [Google Scholar]
- 12.Pratap J, Akech J, Wixted JJ, Szabo G, Hussain S, McGee-Lawrence ME, Li X, Bedard K, Dhillon RJ, van Wijnen AJ, Stein JL, Stein GS, Westendorf JJ, Lian JB. The histone deacetylase inhibitor, vorinostat, reduces tumor growth at the metastatic bone site and associated osteolysis, but promotes normal bone loss. Mol Cancer Ther. 2010;9:3210–20. doi: 10.1158/1535-7163.MCT-10-0572. [DOI] [PMC free article] [PubMed] [Google Scholar]
- 13.Senn SM, Kantor S, Poulton IJ, Morris MJ, Sims NA, O’Brien TJ, Wark JD. Adverse effects of valproate on bone: Defining a model to investigate the pathophysiology. Epilepsia. 2010;51:984–93. doi: 10.1111/j.1528-1167.2009.02516.x. [DOI] [PubMed] [Google Scholar]
- 14.Westendorf JJ. Histone deacetylases in control of skeletogenesis. J Cell Biochem. 2007;102:332–40. doi: 10.1002/jcb.21486. [DOI] [PubMed] [Google Scholar]
- 15.Westendorf JJ, Zaidi SK, Cascino JE, Kahler R, van Wijnen AJ, Lian JB, Yoshida M, Stein GS, Li X. Runx2 (Cbfa1, AML-3) interacts with histone deacetylase 6 and represses the p21(CIP1/WAF1) promoter. Mol Cell Biol. 2002;22:7982–92. doi: 10.1128/MCB.22.22.7982-7992.2002. [DOI] [PMC free article] [PubMed] [Google Scholar]
- 16.Bhaskara S, Chyla BJ, Amann JM, Knutson SK, Cortez D, Sun ZW, Hiebert SW. Deletion of histone deacetylase 3 reveals critical roles in S phase progression and DNA damage control. Mol Cell. 2008;30:61–72. doi: 10.1016/j.molcel.2008.02.030. [DOI] [PMC free article] [PubMed] [Google Scholar]
- 17.Razidlo DF, Whitney TJ, Casper ME, McGee-Lawrence ME, Stensgard BA, Li X, Secreto FJ, Knutson SK, Hiebert SW, Westendorf JJ. Histone Deacetylase 3 Depletion in Osteo/Chondroprogenitor Cells Decreases Bone Density and Increases Marrow Fat. PLoS ONE. 2010;5:e11492. doi: 10.1371/journal.pone.0011492. [DOI] [PMC free article] [PubMed] [Google Scholar]
- 18.Bradley EW, Razidlo DR, Stensgard B, Westendorf JJ. Hdac3 Controls Growth Plate Matrix Secretion and Akt/mTOR Pathway Activation. ASBMR 2011 Annual Meeting; San Diego, CA. American Society for Bone and Mineral Research; 2011. FR0086. [Google Scholar]
- 19.Zhang M, Xuan S, Bouxsein ML, von Stechow D, Akeno N, Faugere MC, Malluche H, Zhao G, Rosen CJ, Efstratiadis A, Clemens TL. Osteoblast-specific knockout of the insulin-like growth factor (IGF) receptor gene reveals an essential role of IGF signaling in bone matrix mineralization. J Biol Chem. 2002;277:44005–12. doi: 10.1074/jbc.M208265200. [DOI] [PubMed] [Google Scholar]
- 20.Knutson SK, Chyla BJ, Amann JM, Bhaskara S, Huppert SS, Hiebert SW. Liver-specific deletion of histone deacetylase 3 disrupts metabolic transcriptional networks. Embo J. 2008;27:1017–28. doi: 10.1038/emboj.2008.51. [DOI] [PMC free article] [PubMed] [Google Scholar]
- 21.Clemens TL, Tang H, Maeda S, Kesterson RA, Demayo F, Pike JW, Gundberg CM. Analysis of osteocalcin expression in transgenic mice reveals a species difference in vitamin D regulation of mouse and human osteocalcin genes. Journal of bone and mineral research : the official journal of the American Society for Bone and Mineral Research. 1997;12:1570–6. doi: 10.1359/jbmr.1997.12.10.1570. [DOI] [PubMed] [Google Scholar]
- 22.VanKoevering KK, Williams BO. Transgenic mouse strains for conditional gene deletion during skeletal development. IBMS BoneKEy. 2008;5:151–170. [Google Scholar]
- 23.Komori T, Yagi H, Nomura S, Yamaguchi A, Sasaki K, Deguchi K, Shimizu Y, Bronson RT, Gao YH, Inada M, Sato M, Okamoto R, Kitamura Y, Yoshiki S, Kishimoto T. Targeted disruption of Cbfa1 results in a complete lack of bone formation owing to maturational arrest of osteoblasts. Cell. 1997;89:755–64. doi: 10.1016/s0092-8674(00)80258-5. [DOI] [PubMed] [Google Scholar]
- 24.Bouxsein ML, Boyd SK, Christiansen BA, Guldberg RE, Jepsen KJ, Muller R. Guidelines for assessment of bone microstructure in rodents using micro-computed tomography. J Bone Miner Res. 2010;25:1468–86. doi: 10.1002/jbmr.141. [DOI] [PubMed] [Google Scholar]
- 25.Norman J, Shapter JG, Short K, Smith LJ, Fazzalari NL. Micromechanical properties of human trabecular bone: a hierarchical investigation using nanoindentation. J Biomed Mater Res A. 2008;87:196–202. doi: 10.1002/jbm.a.31766. [DOI] [PubMed] [Google Scholar]
- 26.Mittra E, Akella S, Qin YX. The effects of embedding material, loading rate and magnitude, and penetration depth in nanoindentation of trabecular bone. J Biomed Mater Res A. 2006;79:86–93. doi: 10.1002/jbm.a.30742. [DOI] [PubMed] [Google Scholar]
- 27.Chen Q, Rho JY, Fan Z, Laulederkind SJ, Raghow R. Congenital lack of COX-2 affects mechanical and geometric properties of bone in mice. Calcif Tissue Int. 2003;73:387–92. doi: 10.1007/s00223-002-0009-x. [DOI] [PubMed] [Google Scholar]
- 28.Parfitt AM, Drezner MK, Glorieux FH, Kanis JA, Malluche H, Meunier PJ, Ott SM, Recker RR. Bone histomorphometry: standardization of nomenclature, symbols, and units. Report of the ASBMR Histomorphometry Nomenclature Committee. J Bone Miner Res. 1987;2:595–610. doi: 10.1002/jbmr.5650020617. [DOI] [PubMed] [Google Scholar]
- 29.Gosset M, Berenbaum F, Thirion S, Jacques C. Primary culture and phenotyping of murine chondrocytes. Nat Protoc. 2008;3:1253–60. doi: 10.1038/nprot.2008.95. [DOI] [PubMed] [Google Scholar]
- 30.Soung do Y, Dong Y, Wang Y, Zuscik MJ, Schwarz EM, O’Keefe RJ, Drissi H. Runx3/AML2/Cbfa3 regulates early and late chondrocyte differentiation. J Bone Miner Res. 2007;22:1260–70. doi: 10.1359/jbmr.070502. [DOI] [PubMed] [Google Scholar]
- 31.Bradley EW, Drissi MH. Wnt5b regulates mesenchymal cell aggregation and chondrocyte differentiation through the planar cell polarity pathway. J Cell Physiol. 2011;226:1683–93. doi: 10.1002/jcp.22499. [DOI] [PubMed] [Google Scholar]
- 32.Bradley EW, Drissi MH. WNT5A regulates chondrocyte differentiation through differential use of the CaN/NFAT and IKK/NF-kappaB pathways. Mol Endocrinol. 2010;24:1581–93. doi: 10.1210/me.2010-0037. [DOI] [PMC free article] [PubMed] [Google Scholar]
- 33.Feng D, Liu T, Sun Z, Bugge A, Mullican SE, Alenghat T, Liu XS, Lazar MA. A circadian rhythm orchestrated by histone deacetylase 3 controls hepatic lipid metabolism. Science. 2011;331:1315–9. doi: 10.1126/science.1198125. [DOI] [PMC free article] [PubMed] [Google Scholar]
- 34.Sun Z, Singh N, Mullican SE, Everett LJ, Li L, Yuan L, Liu X, Epstein JA, Lazar MA. Diet-induced lethality due to deletion of the Hdac3 gene in heart and skeletal muscle. J Biol Chem. 2011;286:33301–9. doi: 10.1074/jbc.M111.277707. [DOI] [PMC free article] [PubMed] [Google Scholar]
- 35.Montgomery RL, Potthoff MJ, Haberland M, Qi X, Matsuzaki S, Humphries KM, Richardson JA, Bassel-Duby R, Olson EN. Maintenance of cardiac energy metabolism by histone deacetylase 3 in mice. J Clin Invest. 2008;118:3588–97. doi: 10.1172/JCI35847. [DOI] [PMC free article] [PubMed] [Google Scholar]
- 36.Zhou X, Zhang Z, Feng JQ, Dusevich VM, Sinha K, Zhang H, Darnay BG, de Crombrugghe B. Multiple functions of Osterix are required for bone growth and homeostasis in postnatal mice. Proceedings of the National Academy of Sciences of the United States of America. 2010;107:12919–24. doi: 10.1073/pnas.0912855107. [DOI] [PMC free article] [PubMed] [Google Scholar]
- 37.Nakashima K, Zhou X, Kunkel G, Zhang Z, Deng JM, Behringer RR, de Crombrugghe B. The novel zinc finger-containing transcription factor osterix is required for osteoblast differentiation and bone formation. Cell. 2002;108:17–29. doi: 10.1016/s0092-8674(01)00622-5. [DOI] [PubMed] [Google Scholar]
- 38.Oh JH, Park SY, de Crombrugghe B, Kim JE. Chondrocyte-specific ablation of Osterix leads to impaired endochondral ossification. Biochemical and biophysical research communications. 2012;418:634–40. doi: 10.1016/j.bbrc.2012.01.064. [DOI] [PMC free article] [PubMed] [Google Scholar]
- 39.Xiong J, Onal M, Jilka RL, Weinstein RS, Manolagas SC, O’Brien CA. Matrix-embedded cells control osteoclast formation. Nature medicine. 2011;17:1235–41. doi: 10.1038/nm.2448. [DOI] [PMC free article] [PubMed] [Google Scholar]
- 40.Donnelly E, Chen DX, Boskey AL, Baker SP, van der Meulen MC. Contribution of mineral to bone structural behavior and tissue mechanical properties. Calcif Tissue Int. 2010;87:450–60. doi: 10.1007/s00223-010-9404-x. [DOI] [PMC free article] [PubMed] [Google Scholar]
- 41.Faibish D, Ott SM, Boskey AL. Mineral changes in osteoporosis: a review. Clinical orthopaedics and related research. 2006;443:28–38. doi: 10.1097/01.blo.0000200241.14684.4e. [DOI] [PMC free article] [PubMed] [Google Scholar]
- 42.Pienkowski D, Doers TM, Monier-Faugere MC, Geng Z, Camacho NP, Boskey AL, Malluche HH. Calcitonin alters bone quality in beagle dogs. Journal of bone and mineral research : the official journal of the American Society for Bone and Mineral Research. 1997;12:1936–43. doi: 10.1359/jbmr.1997.12.11.1936. [DOI] [PubMed] [Google Scholar]
- 43.Rissanen JP, Suominen MI, Peng Z, Halleen JM. Secreted tartrate-resistant acid phosphatase 5b is a Marker of osteoclast number in human osteoclast cultures and the rat ovariectomy model. Calcified tissue international. 2008;82:108–15. doi: 10.1007/s00223-007-9091-4. [DOI] [PubMed] [Google Scholar]
- 44.Aguirre JI, Plotkin LI, Stewart SA, Weinstein RS, Parfitt AM, Manolagas SC, Bellido T. Osteocyte apoptosis is induced by weightlessness in mice and precedes osteoclast recruitment and bone loss. J Bone Miner Res. 2006;21:605–15. doi: 10.1359/jbmr.060107. [DOI] [PubMed] [Google Scholar]
- 45.Hedgecock NL, Hadi T, Chen AA, Curtiss SB, Martin RB, Hazelwood SJ. Quantitative regional associations between remodeling, modeling, and osteocyte apoptosis and density in rabbit tibial midshafts. Bone. 2007;40:627–37. doi: 10.1016/j.bone.2006.10.006. [DOI] [PubMed] [Google Scholar]
- 46.Verborgt O, Tatton NA, Majeska RJ, Schaffler MB. Spatial distribution of Bax and Bcl-2 in osteocytes after bone fatigue: complementary roles in bone remodeling regulation? J Bone Miner Res. 2002;17:907–14. doi: 10.1359/jbmr.2002.17.5.907. [DOI] [PubMed] [Google Scholar]
- 47.Cheung WY, Simmons CA, You L. Osteocyte apoptosis regulates osteoclast precursor adhesion via osteocytic IL-6 secretion and endothelial ICAM-1 expression. Bone. 2012;50:104–10. doi: 10.1016/j.bone.2011.09.052. [DOI] [PubMed] [Google Scholar]
- 48.Bellido T, Ali AA, Plotkin LI, Fu Q, Gubrij I, Roberson PK, Weinstein RS, O’Brien CA, Manolagas SC, Jilka RL. Proteasomal degradation of Runx2 shortens parathyroid hormone-induced anti-apoptotic signaling in osteoblasts. A putative explanation for why intermittent administration is needed for bone anabolism. J Biol Chem. 2003;278:50259–72. doi: 10.1074/jbc.M307444200. [DOI] [PubMed] [Google Scholar]
- 49.Jilka RL, Weinstein RS, Bellido T, Roberson P, Parfitt AM, Manolagas SC. Increased bone formation by prevention of osteoblast apoptosis with parathyroid hormone. J Clin Invest. 1999;104:439–46. doi: 10.1172/JCI6610. [DOI] [PMC free article] [PubMed] [Google Scholar]
- 50.Weinstein RS. Glucocorticoid-induced osteonecrosis. Endocrine. 2011 Dec 15; doi: 10.1007/s12020-011-9580-0. Epub ahead of print. [DOI] [PMC free article] [PubMed] [Google Scholar]
- 51.Weinstein RS, Nicholas RW, Manolagas SC. Apoptosis of osteocytes in glucocorticoid-induced osteonecrosis of the hip. J Clin Endocrinol Metab. 2000;85:2907–12. doi: 10.1210/jcem.85.8.6714. [DOI] [PubMed] [Google Scholar]