Summary
Background and objectives
Hypervolemia is a major cause of morbidity, in part because of the lack of well characterized diagnostic tests. The hypothesis was that relative plasma volume (RPV) slopes are influenced by ultrafiltration rate, directly associate with improvement in arterial oxygen saturation, and are reproducible.
Design, setting, participants, & measurements
RPV slopes were measured on three consecutive hemodialysis sessions. Various relationships were tested using mixed models. Reproducibility was assessed by the intraclass correlation coefficient.
Results
RPV slopes averaged 1.37±1.45% per hour. The mean RPV slopes were steeper on the first dialysis of the week, which correlated with a higher ultrafiltration rate; RPV slope and ultrafiltration rate were directly related. Increasing ultrafiltration rate quartiles were associated with similar change in RPV in the first 1 hour of dialysis but steeper changes in RPV subsequently. A direct relationship emerged between increasing RPV slopes and increasing arterial oxygen saturation slopes. The intraclass correlation coefficient for the relative plasma volume slope was 0.77.
Conclusions
Although ultrafiltration rate is a major determinant of RPV slope, similar ultrafiltration rates are associated with varying RPV between individuals. Because RPV is associated with little change by ultrafiltration rate during the first 1 hour of dialysis, probing dry weight during the earlier part of dialysis may be safer. RPV slopes are physiologically meaningful, because they are associated with parallel changes in arterial oxygenation saturation slopes. RPV slopes are reproducible, and therefore, RPV may serve as a useful marker to judge changes in volume status within an individual.
Introduction
The assessment of volume status and efforts to optimize volume are important but often overlooked among patients on long-term hemodialysis (HD). Excess volume contributes to hypertension (1,2); volume removal lowers BP in dialysis patients (3). Volume excess may contribute to cardiovascular disease among patients on dialysis. According to the US Renal Data System (2008–2009), the adjusted cardiovascular hospitalization rate is 0.55 per patient-year. Most of these episodes are congestive heart failure, and the majority is attributable to volume overload (4–6).
Complacence in managing volume excess is, at least in part, because volume removal and optimizing volume remain subjective in nature. Physical examination often fails to accurately assess volume status in dialysis patients (7,8). Although several tests have been proposed to assess volume excess, there is no single test available that can serve as a reference standard for volume state. Techniques proposed to assess volume state include total body water measurement (9), bioimpedance (10), echocardiogram (11), atrial natriuretic peptide (12), evaluation of lung water by ultrasound (13), and relative plasma volume (RPV) monitoring (14). Of these techniques, RPV monitoring seems attractive, because it is easy to use and commercially available. RPV monitoring may serve as an important bedside tool that can assist in probing dry weight among dialysis patients. RPV slopes associate with all-cause mortality, even after accounting for interdialytic ambulatory BP and interdialytic weight gain (4). However, reproducibility of RPV within individuals remains unknown (15–21). Gauging reproducibility is important, and therefore, the reliability of this test can be ascertained. Likewise, the physiologic importance of RPV slopes has been scarcely examined. Compared with flatter RPV slopes at a given ultrafiltration rate (UFR), which reflect volume overload, steeper RPV slopes reflect lower intravascular refilling rate; accordingly, arterial oxygenation should improve more with steepening of RPV slopes in volume-overloaded patients. If so, improvement in arterial oxygenation would reflect that fluid volume was excessive.
The aim of the study was to test the reproducibility and predictors of RPV slopes within individuals across three consecutive dialysis sessions. To ascertain whether spontaneous changes in UFR or RPV translate into the physiologic change of oxygenation, we studied the relationship between RPV slope and oxygen saturation.
Materials and Methods
Patients
Between May of 2011 and December of 2011, a convenience sample of 20 patients from four dialysis units affiliated with Indiana University was recruited. Patients met the following criteria: (1) age more than 18 years, (2) chronic HD for at least 3 months, (3) HD prescribed three times per week, and (4) willingness to give informed consent. Patients were excluded for the following reasons: (1) active drug abuse, (2) body mass index≥40 kg/m2 and arm circumference>42 cm, and (3) expected survival<1 year.
Patients were prospectively studied for 1 week over three consecutive HD sessions. Accordingly, data from a total of 60 HD sessions were recorded (20 patients with three HD sessions per week). Prescribed dry weight and antihypertensive medication were held constant during the study.
The study protocol was approved by the local institutional review board and the Veterans’ Affairs Research and Development Committee. All of the patients provided written informed consent.
Measurements
All measurements were prospectively recorded. At each HD session, the following measurements were obtained before and after HD: body weight, BP, and heart rate. BP and heart rate were measured with an automated oscillometric monitor incorporated in the HD apparatus. Ultrafiltration volume as displayed by the dialysis machine was recorded every 15 minutes. Also, fluid intake while on dialysis was recorded to calculate the net ultrafiltration. Occurrence of hypotensive episodes and treatment interventions were recorded for each dialysis treatment.
RPV monitoring was performed with Crit-Line III TQA, which is a clinically available device that incorporates photo-optical technology to noninvasively measure absolute hematocrit (Hema Metrics, Kaysville, UT) (22). Hematocrit is measured every 20 seconds throughout the duration of HD. Measurements made by the machine have been validated against hematocrits measured by centrifugation (23). Oxygen saturation on dialysis was recorded on the arterial line of the dialyzer with Crit-Line III.
Statistical Methods
We exported the machine-stored time and hematocrit data to a relational database for additional analysis. The change in plasma volume with ultrafiltration dialysis approximates first-order elimination kinetics. RPV change was calculated using previously published methods (21). Briefly, we calculated the fraction of blood free of hematocrit using the Equation 100 hematocrit percent. Next, we took the natural log of this fraction as the dependent variable. A mixed model was used to allow for repeated measurements within individuals. Intraclass correlation coefficient was computed as the ratio of between-subject variance to total variance using mixed models. Median UFR was calculated, and then, UFR was divided into quartiles. We then modeled percentage change in RPV for different quartiles of UFR.
Patients were dialyzed on Monday, Wednesday, and Friday or Tuesday, Thursday, and Saturday. For analysis, Monday and Tuesday were defined as day of week (DOW) 0, Wednesday and Thursday were defined as DOW 1, and Friday and Saturday were defined as DOW 2.
All of the analyses were conducted using Stata 11.2 (Stata Corp). The P values reported are two-sided and taken to be significant at <0.05.
Results
Between May of 2011 and December of 2011, 20 patients were enrolled, and all the patients completed the study. A few protocol deviations were noted. For two patients, because of one missed HD session in the study week, the missed RPV monitoring had to be obtained on the first HD session of the following week. For some of the patients, part of the recordings toward the end of RPV monitoring was discarded because of machine malfunction, which was noted by sudden unphysiological and inexplicable changes in recordings.
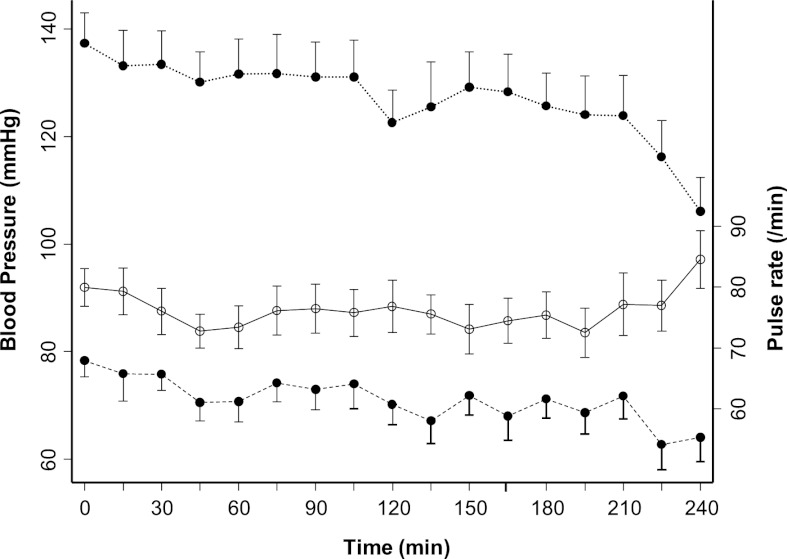
The clinical characteristics of these patients are shown in Table 1; 75% of the participants were black. Diabetes and hypertension accounted for causes of ESRD in 20% and 35% of participants, respectively. Although these patients were younger, average urea reduction ratio, serum albumin and hemoglobin reflect the general dialysis population. Of 60 HD sessions studied, cramping was reported during 10 HD sessions. These events mostly occurred at the end of dialysis and were treated by terminating ultrafiltration. As expected, the mean systolic and diastolic pressures recorded on HD showed a downward trend toward the end of dialysis but little change in pulse rate (Figure 1).
Table 1.
Clinical characteristics of the study sample
| Clinical Characteristic | Valuea |
|---|---|
| Age (yr) | 48.3±12.4 |
| Dialysis vintage (yr) | 7.9±6.2 |
| Men | 14 (70) |
| Race | |
| White | 5 (25) |
| Black | 15 (75) |
| Cause of ESRD | |
| Diabetes mellitus | 4 (20) |
| Hypertensive nephrosclerosis | 7 (35) |
| Nephritic glomerulonephritis | 3 (15) |
| Nephrotic glomerulonephritis | 4 (20) |
| Unknown/other | 2 (10) |
| History | |
| Myocardial infarction | 1 (5) |
| Congestive heart failure | 1 (5) |
| Stroke | 2 (10) |
| Current smoker | 7 (35) |
| Body mass index (kg/m2) | 27.9±6.6 |
| Urea reduction ratio | 76.6±8.6 |
| Albumin (g/dl) | 3.7±0.3 |
| Hemoglobin (g/dl) | 10.9±0.9 |
| Dialysate | |
| Temperature (°C) | 36.5±0.6 |
| Calcium (mEq/L) | 2.6±0.4 |
| Potassium (mEq/L) | 2.0±0.7 |
| Bicarbonate (mEq/L) | 37.2±2.2 |
| Prescribed blood flow rate (ml/min) | 390±34.8 |
| Prescribed dialysate flow rate (ml/min) | 786.3±61.5 |
| Prescribed duration (h) | 3.8±0.3 |
| Delivered dialysis duration (h) | 3.8±0.3 |
| Sodium profile | |
| Exponential | 2 (10) |
| Linear | 1 (5) |
| None | 17 (85) |
| Predialysis systolic BP (mmHg) | 141.8±23.1 |
| Predialysis diastolic BP (mmHg) | 79.8±12.7 |
| Predialysis heart rate (beats/min) | 83.6±13.5 |
| Postdialysis systolic BP (mmHg) | 131.8±24.4 |
| Postdialysis diastolic BP (mmHg) | 71.4±15.7 |
| Postdialysis heart rate (beats/min) | 78.7±12.5 |
| Predialysis weight (kg) | 78.5±20.2 |
| Postdialysis weight (kg) | 76.2±20.1 |
| Interdialytic weight gain (kg) | 2.21±1.04 |
| Ultrafiltration volume (ml) | 2510±1091 |
Values expressed as mean ± SD or number (percent).
Figure 1.
Mean systolic BP, diastolic pressure, and heart rate for 20 patients during the time on dialysis. The error bars represent SD. ●, BP; ○, pulse rate.
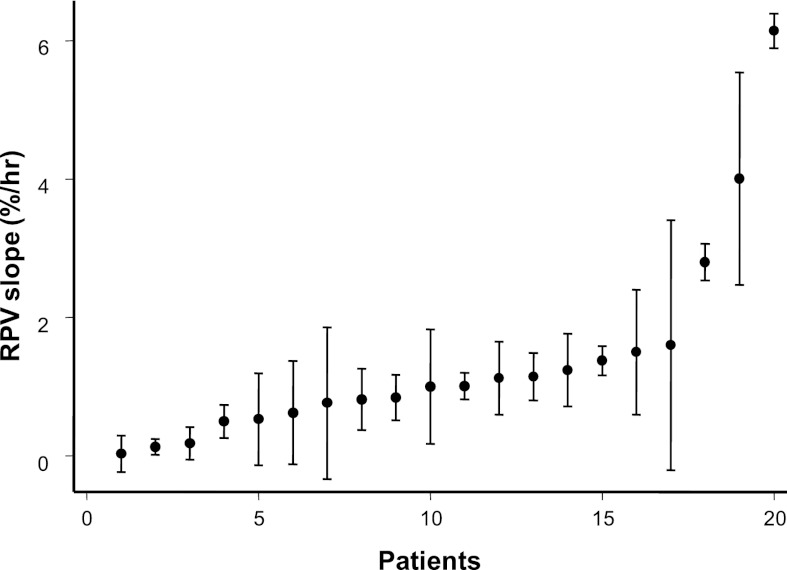
Figure 2 shows the mean RPV slopes (circles) and SD (whiskers) for individual patients in ascending order. The mean RPV slope was 1.37±1.45%/h. The slopes ranged from 0.028%/h to 6%/h. The intraclass correlation coefficient for the RPV slope was 0.77. By comparison, the intraclass correlation coefficient for interdialytic weight gain was 0.32, and the intraclass correlation coefficient for ultrafiltration volume was 0.53.
Figure 2.
Sorted relative plasma volume (RPV) slopes for each of the 20 patients in increasing order. Circles reflect the mean, and whiskers reflect the SD. Higher numbers reflect steeper slopes.
The RPV slopes varied with the day of week on HD; HD on first day of the week produced a steeper RPV slope than the following days (data not shown). However, this finding was associated with a higher UFR on the first dialysis of the week. Removing the data for the first dialysis of the week improved the intraclass correlation coefficient for RPV slopes from 0.77 to 0.81. By comparison, the intraclass correlation coefficient for interdialytic weight gain improved from 0.32 to 0.35 and the intraclass correlation coefficient for ultrafiltration volume improved from 0.53 to 0.74.
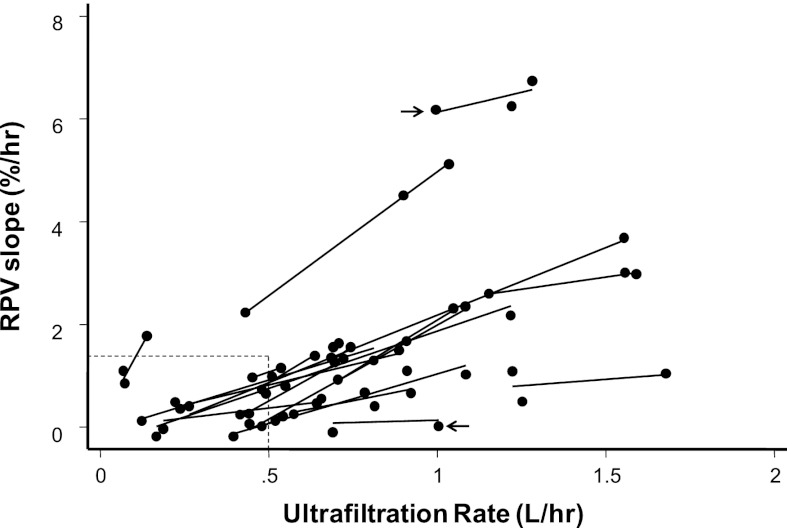
To examine whether UFR is associated with RPV slope, we plotted RPV slopes versus UFR. Figure 3 shows 20 regression slopes, one for each patient. A positive linear relationship between RPV and UFR is evident within and across individuals. Among dialysis treatments with UFR<0.5 L/h, the RPV slope was mostly less than the median slope seen among dialysis patients of 1.33%/h (21) (Figure 3, lower left rectangle). With increase in UFR, RPV slope steepened. However, given similar UFR, there were differences among RPV slopes between individuals (arrows in Figure 3 show different RPV slopes for the same UFR for two individuals).
Figure 3.
Relationship between ultrafiltration rate (UFR) and RPV slopes for each of the 20 patients. Each data point represents RPV slope (percent per hour) and UFR for a single hemodialysis (HD) session for an individual. Each line reflects regression of UFR on RPV over three consecutive HD sessions for the same individual. Arrows show that RPV slopes can be remarkably different for the same UFR between individuals. Lower left rectangle indicates data points with UFR<0.5 L/h and RPV slope<1.33%/h. Additional details are in the text.
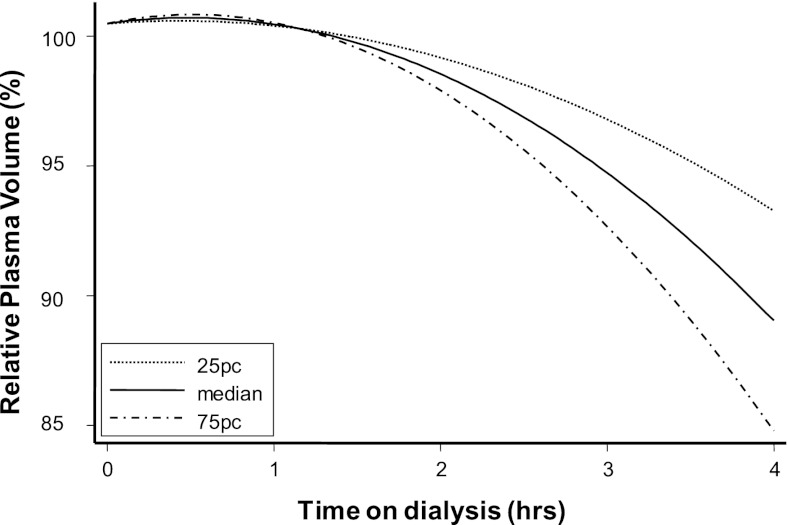
To further analyze how different UFR could change RPV over time, we modeled RPV slopes for three separate UFRs (25 percentile, median, and 75 percentile) (Figure 4). The mixed model used modeled the log of the hematocrit with independent fixed variables (instantaneous ulftrafiltration volume, time, and interaction of these two variables) and random variables (subjects and time using an unstructured covariance matrix). The RPV slopes remained almost the same, irrespective of the UFR in the initial 1 hour. Subsequently, increasing UFR was associated with steeper change in RPV (P<0.001).
Figure 4.
Modeled percent RPV at increasing quartiles of UFR. In the first 1 hour, increasing UFR had little change on RPV. During the last 1 hour of dialysis, increasing UFR was associated with steeper RPV change.
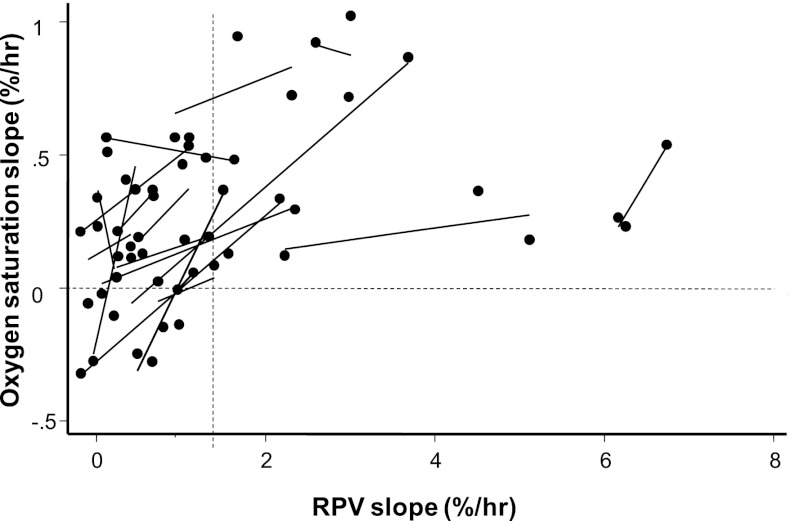
Next, we sought to answer the question of whether steeper RPV slopes on dialysis translate into improved oxygenation clinically measured as oxygenation saturation by the same device. Figure 5 plots oxygenation saturation slopes versus RPV slopes. Data on two patients who had indwelling central venous catheters are not shown. For 16 of 18 patients, there was a linear and positive relationship between increasing RPV slopes and increasing arterial oxygen saturation slopes. Notably, none of the patients with a steep RPV slope (slope more than 1.33%/h) had oxygen saturation slope<0 or negative slope (no observations were noted in the lower right quadrant of Figure 5). The statistical significance of these observations was confirmed using mixed models. For each percent increase in hematocrit, the oxygen saturation improved by 0.04%/h (95% confidence interval= 0.038–0.051, P<0.001).
Figure 5.
Relationship between RPV slope and oxygenation saturation slope. Each data point represents RPV slope (percent per hour) and oxygen saturation slope for a single HD session for an individual. Each line reflects regression of RPV slope on oxygen saturation slope over three consecutive HD sessions for the same individual. The vertical dashed line marks RPV slope of 1.33%/h (the median RPV slope seen in a larger study). The horizontal dashed line is drawn at the oxygen saturation slope of zero. For RPV slopes>1.33%, no patient had an oxygen saturation slope that was less than zero.
Discussion
The major finding of our study is that RPV slope obtained by a commercially available instrument is reproducible over 1 week. However, when comparing changes in RPV, physicians must take into account the intensity of ultrafiltration. UFR seems to be a major driver for changes in RPV across all individuals. Changes in RPV seem to produce parallel changes in arterial oxygen saturation, lending support to the notion that RPV slopes may be of physiologic importance. Given these considerations, it seems that RPV slopes can serve as a tool to assess volume status.
The use of RPV slope and its derivatives (RPV/UFR or RPV/UFR adjusted for body weight) has been proposed as a tool to assess volume status and hence, adjust dry weight (17,21,24–28). These studies propose that a flatter RPV slope can tolerate a greater dry-weight reduction (19,21,27,28). In a randomized trial, it was found that probing dry weight leads to steepened RPV slopes (21). Data on intraindividual (17,18) and interindividual variability (18,20) of relative blood volume monitoring are limited.
Comparisons with other studies pose some problems because of differences in techniques and definitions used to define reproducibility. For example, the work by Dasselaar et al. (17) used the Hemoscan device, which like the Crit-Line device, uses a monochromatic wavelength to measure hemoglobin and therefore, relative blood volume. However, to calculate the percent change in relative blood volume, the work by Dasselaar et al. (17) used the initial and final hemoglobin to calculate change. This change may be quite different from the change calculated by regressing all values of hemoglobin over time, which would be particularly true in the case of nonlinear change. Furthermore, the work by Dasselaar et al. (17) reported the coefficient of variation in the relative blood volume within 13 HD patients over 17 weeks, with each patient being dialyzed 51 times. The coefficient of variation had a mean of 22%, median of ∼20%, and a ranged of ∼11% to ∼40%. However, the coefficient of variation does not allow calculation of intraclass correlation coefficients, which we have reported in our study. In another study, Krepel et al. (18) used Crit-Line to measure relative blood volume among 10 HD patients over 10 sessions each. The work by Krepel et al. (18) reported the mean change in relative blood volume from baseline to various times during dialysis, including the mean change at 240 minutes. We used the data provided in the work in ref. 18 regarding the mean change and its coefficient of variation to simulate 10,000 replications and calculated the intraclass correlation coefficient of relative blood volume slope to be 0.604. This number is substantially lower than the 0.77 in our study. The lower intraclass correlation coefficient is surprising, because the work by Krepel et al. (18) was based on Crit-Line measurements from the same weekday over 10 consecutive weeks. The work by Krepel et al. (18) also excluded patients who required <1000 ml/treatment ultrafiltration. The discrepant results could be because the work by Krepel et al. (18) used only 10 minutes of data surrounding the 240-minute point to compute changes. We, in contrast, used all data points throughout dialysis. Also, we used the slope of relative plasma volume rather than a discrete change in relative blood volume from baseline to the end of dialysis. Moreover, the work by Krepel et al. (18) studied patients over 10 weeks, which is a long period over which changes in body composition are possible. Thus, the long-term reproducibility of RPV slopes may be lower, because it reflects biologic variation in the fluid volume state.
UFR is the major driver of RPV slope. This finding is consistent with previous studies (17,18). UFR acts as a stress stimulus and evokes a change in RPV slope. However, UFR is not the sole determinant of RPV slope. Similar UFRs can produce different RPV slopes between patients. For example, Figure 2 shows that a UFR of ∼1 L/h can produce an RPV slope of 0%/h in one patient and 6%/h in another patient. In the absence of a gold-standard definition of euvolemia based on RPV slopes, we suggest that steep RPV slopes, especially in the setting of modest UFRs, are associated with euvolemia. In contrast, flat RPV slopes in the setting of aggressive UFRs are associated with hypervolemia. In fact, we propose that flat RPV slopes, regardless of the UFRs, are more likely to occur in volume-overloaded patients. These volume-overloaded patients, perhaps because of congestive hepatomegaly, lose their appetite and have little interdialytic weigh gain. Thus, the interpretation of RPV slope requires knowledge of UFR. Although the RPV/UFR ratio has been proposed as a surrogate marker for volume assessment (17,21,24–28), it is, in our view, better to view each component of the equation separately because of the clinical information that each part provides.
Relationship of RPV slope at different levels of UFR shows that RPV slope, on average, changes little in the first 1 hour of dialysis (Figure 4). This finding may reflect greater vascular refilling balancing UFR, even when it is aggressive. In the last 1 hour of dialysis, the changes in RPV are more dependent on the rate of UFR. Accordingly, it seems that the initial 1 hour may be a safer time for probing dry weight, because it may be associated with fewer RPV changes and therefore fewer symptoms.
Hypoxia during HD has been previously reported, and it is usually attributed to acetate and sometimes, a bicarbonate bath (29–31). However, an important component driving hypoxia could be volume overload. Attainment of euvolemia in theory should decrease the alveolar-to-arterial gradient and improve oxygenation. In our study, we find that there is a positive relationship between RPV slope and change in oxygen saturation (Figure 5). The interesting point is that none of the patients with an RPV slope of >1.33%/h had a decrease in oxygen saturation over dialysis. We have previously found, at the population level, that an RPV slope of <1.33%/h is associated with being volume-overloaded (21). Because RPV is driven by UFR, this finding highlights the importance of ultrafiltration in improving oxygen saturation. The effect of ultrafiltration on improving oxygen saturation has been previously shown (30). Because dialysis patients usually have a limited a cardiopulmonary reserve, hypoxia on dialysis could be detrimental. Routine monitoring of oxygen saturation would serve as an indirect measure of volume, and changes in UFR tailored to improving saturation could likely improve volume outcomes. However, this concept needs additional studies to better determine how UFR could influence oxygen saturation.
Our study has a few limitations. First, the sample size of our study was relatively small. Although the consecutive dialysis sessions over which we measured RPV slopes were only three, our intent was to study the short-term variability of the test. Although longer-term measurements are possible, there is risk of introducing biologic variability because of changes in body composition over time. Second, RPV monitoring assumes that uniform mixing of red blood cells occurs throughout the vascular space. However, the distribution of hematocrit in the central circulation and microcirculation may not be constant and may change during episodes of hypotension (16). Despite this limitation, in a given patient, the distribution of hematocrit between compartments is not expected to change over the short term. Third, whether the changes in RPV slope with ultrafiltration on dialysis should be used to dictate how much fluid to remove remains unclear. Although we do not provide any protocol on how to use UFR and associated RPV changes for the optimization of dry weight, the reproducibility of RPV slopes in the short term is promising for additional development of this technique to assess dry weight.
In summary, the day of week plays an important role in determining RPV slope, but this result is mostly because of greater UFR after the long interdialytic interval. RPV slopes are physiologically meaningful, because they evoke changes in arterial oxygenation saturation slopes. Because RPV slopes are changed little by UFR during the first 1 hour of dialysis but much more during the latter part of treatment, probing dry weight during the earlier part of dialysis may be associated with less hemodynamic perturbation. Because RPV slopes are fairly reproducible, RPV slopes may be clinically useful to assess volume status and track changes over a period of time. Additional research is warranted.
Disclosures
R.A. serves either as a consultant, steering committee member, or on the speaker bureau for the following: Affymax, Amgen, Eli Lilly, Pfizer, Takeda, Abbott, Merck, Reata, Roche, Otsuka, Ardylx, and Celgene.
Acknowledgment
This work was funded by National Institutes of Health Grant 2R01-DK062030-08.
Footnotes
Published online ahead of print. Publication date available at www.cjasn.org.
References
- 1.Fagugli RM, Pasini P, Quintaliani G, Pasticci F, Ciao G, Cicconi B, Ricciardi D, Santirosi PV, Buoncristiani E, Timio F, Valente F, Buoncristiani U: Association between extracellular water, left ventricular mass and hypertension in haemodialysis patients. Nephrol Dial Transplant 18: 2332–2338, 2003 [DOI] [PubMed] [Google Scholar]
- 2.Lins RL, Elseviers M, Rogiers P, Van Hoeyweghen RJ, De Raedt H, Zachee P, Daelemans RA: Importance of volume factors in dialysis related hypertension. Clin Nephrol 48: 29–33, 1997 [PubMed] [Google Scholar]
- 3.Agarwal R, Alborzi P, Satyan S, Light RP: Dry-weight reduction in hypertensive hemodialysis patients (DRIP): S randomized, controlled trial. Hypertension 53: 500–507, 2009 [DOI] [PMC free article] [PubMed] [Google Scholar]
- 4.Agarwal R: Hypervolemia is associated with increased mortality among hemodialysis patients. Hypertension 56: 512–517, 2010 [DOI] [PMC free article] [PubMed] [Google Scholar]
- 5.Khosla UM, Johnson RJ: Hypertension in the hemodialysis patient and the “lag phenomenon”: Insights into pathophysiology and clinical management. Am J Kidney Dis 43: 739–751, 2004 [DOI] [PubMed] [Google Scholar]
- 6.Wizemann V, Wabel P, Chamney P, Zaluska W, Moissl U, Rode C, Malecka-Masalska T, Marcelli D: The mortality risk of overhydration in haemodialysis patients. Nephrol Dial Transplant 24: 1574–1579, 2009 [DOI] [PMC free article] [PubMed] [Google Scholar]
- 7.Agarwal R, Andersen MJ, Pratt JH: On the importance of pedal edema in hemodialysis patients. Clin J Am Soc Nephrol 3: 153–158, 2008 [DOI] [PMC free article] [PubMed] [Google Scholar]
- 8.Sinha AD, Agarwal R: Can chronic volume overload be recognized and prevented in hemodialysis patients? The pitfalls of the clinical examination in assessing volume status. Semin Dial 22: 480–482, 2009 [DOI] [PubMed] [Google Scholar]
- 9.Chan C, Smith D, Spanel P, McIntyre CW, Davies SJ: A non-invasive, on-line deuterium dilution technique for the measurement of total body water in haemodialysis patients. Nephrol Dial Transplant 23: 2064–2070, 2008 [DOI] [PMC free article] [PubMed] [Google Scholar]
- 10.Kuhlmann MK, Zhu F, Seibert E, Levin NW: Bioimpedance, dry weight and blood pressure control: New methods and consequences. Curr Opin Nephrol Hypertens 14: 543–549, 2005 [DOI] [PubMed] [Google Scholar]
- 11.Cheriex EC, Leunissen KM, Janssen JH, Mooy JM, van Hooff JP: Echography of the inferior vena cava is a simple and reliable tool for estimation of ‘dry weight’ in haemodialysis patients. Nephrol Dial Transplant 4: 563–568, 1989 [PubMed] [Google Scholar]
- 12.Satyan S, Light RP, Agarwal R: Relationships of N-terminal pro-B-natriuretic peptide and cardiac troponin T to left ventricular mass and function and mortality in asymptomatic hemodialysis patients. Am J Kidney Dis 50: 1009–1019, 2007 [DOI] [PMC free article] [PubMed] [Google Scholar]
- 13.Mallamaci F, Benedetto FA, Tripepi R, Rastelli S, Castellino P, Tripepi G, Picano E, Zoccali C: Detection of pulmonary congestion by chest ultrasound in dialysis patients. JACC Cardiovasc Imaging 3: 586–594, 2010 [DOI] [PubMed] [Google Scholar]
- 14.Lopot F, Kotyk P, Bláha J, Forejt J: Use of continuous blood volume monitoring to detect inadequately high dry weight. Int J Artif Organs 19: 411–414, 1996 [PubMed] [Google Scholar]
- 15.Candan C, Sever L, Civilibal M, Caliskan S, Arisoy N: Blood volume monitoring to adjust dry weight in hypertensive pediatric hemodialysis patients. Pediatr Nephrol 24: 581–587, 2009 [DOI] [PubMed] [Google Scholar]
- 16.Dasselaar JJ, Huisman RM, de Jong PE, Franssen CF: Measurement of relative blood volume changes during haemodialysis: Mand limitations. Nephrol Dial Transplant 20: 2043–2049, 2005 [DOI] [PubMed] [Google Scholar]
- 17.Dasselaar JJ, de Jong PE, Huisman RM, Franssen CF: Influence of ultrafiltration volume on blood volume changes during hemodialysis as observed in day-of-the-week analysis of hemodialysis sessions. ASAIO J 53: 479–484, 2007 [DOI] [PubMed] [Google Scholar]
- 18.Krepel HP, Nette RW, Akçahüseyin E, Weimar W, Zietse R: Variability of relative blood volume during haemodialysis. Nephrol Dial Transplant 15: 673–679, 2000 [DOI] [PubMed] [Google Scholar]
- 19.Reddan DN, Szczech LA, Hasselblad V, Lowrie EG, Lindsay RM, Himmelfarb J, Toto RD, Stivelman J, Winchester JF, Zillman LA, Califf RM, Owen WF, Jr: Intradialytic blood volume monitoring in ambulatory hemodialysis patients: A randomized trial. J Am Soc Nephrol 16: 2162–2169, 2005 [DOI] [PubMed] [Google Scholar]
- 20.Santoro A, Mancini E, Paolini F, Zucchelli P: Blood volume monitoring and control. Nephrol Dial Transplant 11[Suppl 2]: 42–47, 1996 [DOI] [PubMed] [Google Scholar]
- 21.Sinha AD, Light RP, Agarwal R: Relative plasma volume monitoring during hemodialysis AIDS the assessment of dry weight. Hypertension 55: 305–311, 2010 [DOI] [PMC free article] [PubMed] [Google Scholar]
- 22.Steuer RR, Bell DA, Barrett LL: Optical measurement of hematocrit and other biological constituents in renal therapy. Adv Ren Replace Ther 6: 217–224, 1999 [DOI] [PubMed] [Google Scholar]
- 23.Leypoldt JK, Cheung AK, Steuer RR, Harris DH, Conis JM: Determination of circulating blood volume by continuously monitoring hematocrit during hemodialysis. J Am Soc Nephrol 6: 214–219, 1995 [DOI] [PubMed] [Google Scholar]
- 24.Agarwal R, Kelley K, Light RP: Diagnostic utility of blood volume monitoring in hemodialysis patients. Am J Kidney Dis 51: 242–254, 2008 [DOI] [PubMed] [Google Scholar]
- 25.Dasselaar JJ, de Jong PE, Huisman RM, Franssen CF: Effect of high and low ultrafiltration volume during hemodialysis on relative blood volume. ASAIO J 52: 169–173, 2006 [DOI] [PubMed] [Google Scholar]
- 26.de Vries JP, Kouw PM, van der Meer NJ, Olthof CG, Oe LP, Donker AJ, de Vries PM: Non-invasive monitoring of blood volume during hemodialysis: Its relation with post-dialytic dry weight. Kidney Int 44: 851–854, 1993 [DOI] [PubMed] [Google Scholar]
- 27.Steuer RR, Germain MJ, Leypoldt JK, Cheung AK: Enhanced fluid removal guided by blood volume monitoring during chronic hemodialysis. Artif Organs 22: 627–632, 1998 [DOI] [PubMed] [Google Scholar]
- 28.Zellweger M, Quérin S, Madore F: Measurement of blood volume during hemodialysis is a useful tool to achieve safely adequate dry weight by enhanced ultrafiltration. ASAIO J 50: 242–245, 2004 [DOI] [PubMed] [Google Scholar]
- 29.Dhakal MP, Kallay MC, Talley TE: Hemodialysis associated hypoxia extends into the post-dialysis period. Int J Artif Organs 20: 204–207, 1997 [PubMed] [Google Scholar]
- 30.Nielsen AL, Jensen HA, Hegbrant J, Brinkenfeldt H, Thunedborg P: Oxygen status during haemodialysis. The Cord-Group. Acta Anaesthesiol Scand Suppl 107: 195–200, 1995 [DOI] [PubMed] [Google Scholar]
- 31.Smit JC, Jones JG: Oxygen saturation during hemodialysis. Ren Fail 15: 239–245, 1993 [DOI] [PubMed] [Google Scholar]


