

Abstract
All-atom explicit solvent model and replica exchange molecular dynamics were used to investigate binding of Alzheimer's biomarker FDDNP to the Aβ10–40 monomer. At low and high concentrations, FDDNP binds with high affinity to two sites in the Aβ10–40 monomer located near the central hydrophobic cluster and in the C-terminal. Analysis of ligand- Aβ10–40 interactions at both concentrations identifies hydrophobic effect as a main binding factor. However, with the increase in ligand concentration the interactions between FDDNP molecules also become important due to strong FDDNP self-aggregation propensity and few specific binding locations. As a result, FDDNP ligands partially penetrate the core of the Aβ10–40 monomer, forming large self-aggregated clusters. Ligand self-aggregation does not affect hydrophobic interactions as a main binding factor or the location of binding sites in Aβ10–40. Using the Aβ10–40 conformational ensemble in ligand-free water as reference, we show that FDDNP induces minor changes in the Aβ10–40 secondary structure at two ligand concentrations studied. At the same time, FDDNP significantly alters the peptide tertiary fold in a concentration-dependent manner by redistributing long-range, side-chain interactions. We argue that because FDDNP does not change Aβ10–40 secondary structure, its antiaggregation effect is likely to be weak. Our study raises the possibility that FDDNP may serve as a biomarker of not only Aβ fibril species, but of monomers as well.
Introduction
Alzheimer's disease (AD) is related to the aggregation of Aβ peptides (1,2), which, according to amyloid cascade hypothesis, is responsible for neuronal damage and loss of memory (3). Spontaneous Aβ aggregation is initiated with the oligomerization of monomeric polypeptides followed by the formation of polymorphic amyloid fibrils (4,5). Experimental data indicate that cytotoxicity is mainly determined by Aβ oligomers, even as small as dimers (6,7), whereas the fibril cytotoxicity is less pronounced (8,9). Definitive AD diagnosis and the development of disease-modifying therapies are complicated by the lack of reliable in vivo molecular imaging probe, which can detect the formation of Aβ amyloid deposits (10). One of the candidate molecular probes is a radiofluorinated naproxen derivative FDDNP, which has been shown to bind in vivo and in vitro to Aβ fibrils (11,12). The structures of tau fragment fibrils complexed with FDDNP ligands resolved recently by x-ray crystallography also suggest a nonspecific binding of the ligand to these fibrils (13). It is then perhaps not surprising that FDDNP can label not only AD-related amyloid deposits, but also other fibrils (e.g., of prions) (14). From a medical perspective, FDDNP ligand, together with positron emission tomography, can provide a noninvasive detection and visualization of amyloid deposits in brain tissues (15,16). In addition, the FDDNP biomarker can be used for evaluation of AD treatment outcomes and for screening the candidates for AD drug trials (17).
Although experimental studies have revealed the diagnostic utility of FDDNP (15,18), to our knowledge the molecular mechanisms of FDDNP-Aβ interactions are still poorly understood. It is not clear whether this ligand specifically recognizes fibril deposits, or if could also bind to other Aβ species such as monomers and oligomers; there is no information on the location and composition of FDDNP binding sites in Aβ species; to serve as a biomarker, FDDNP should not significantly affect Aβ aggregation or change Aβ conformations (however, the validity of this assumption is unknown as of this writing); and it is important to know the basic physicochemical factors and interactions which control FDDNP binding—such information can be of significant value in the design of new biomarkers with stronger affinity and better selectivity.
Molecular dynamics (MD) simulations are well positioned to investigate the questions posed above by mapping the interactions of Aβ species with the ligands at all-atom resolution (19). In recent years, MD has been used to explore the mechanisms of fibril growth (20–22) and to investigate the conformational ensembles of amyloidogenic monomers (23–25) and oligomers (26–30). More recently, MD studies have addressed the binding of small molecule ligands to amyloidogenic peptides (31–34). For example, binding of aromatic ligands to Aβ12–28 fragment has been investigated with implicit solvent MD (31). No significant changes in the peptide structural ensemble and no specific binding sites have been found. Binding of flavonoids to Aβ fibrils has been explored by explicit solvent MD (32). The results revealed ligand binding to the fibril edges and their penetration into the fibril hydrophobic core. In our group, we have initiated the MD studies of the interactions between Aβ peptides and nonsteroidal anti-inflammatory drugs, ibuprofen and naproxen (35–38). Our studies have indicated that these ligands may not only interfere with Aβ aggregation, but also change peptide conformations.
To answer the questions about FDDNP biomarker stated above, we report in this article the study of FDDNP binding to Aβ monomers probed by all-atom explicit solvent model and replica exchange molecular dynamics (REMD). We show that FDDNP binds via hydrophobic interactions to two Aβ sequence regions located near the central hydrophobic cluster (CHC) and in the C-terminal. At high ligand concentration, interligand interactions become also important due to strong FDDNP propensity for self-aggregation comparable with binding to Aβ itself. Consequently, FDDNP ligands partially penetrate the core of the Aβ monomer, forming large self-aggregated clusters. Comparison with the Aβ conformational ensemble in ligand-free water shows that FDDNP induces relatively minor changes in Aβ structure, which are limited to the formation of turn structure near CHC. Comparison of Aβ interactions with the imaging biomarker FDDNP and the anti-aggregation agent ibuprofen reveals significant differences in the binding mechanisms of these ligands.
Methods
All-atom explicit solvent model
To represent Aβ monomer and FDDNP ligands we used the all-atom explicit solvent CHARMM22 force field with CMAP corrections (39). These corrections improve the agreement between experimental and in silico protein structures in disordered regions (39). Testing the ability of the CHARMM22 force field to reproduce the Aβ monomer conformational ensemble has been reported in our previous study, which showed an agreement between in silico and experimental J-coupling constant distributions (40). The parameterization of FDDNP (Fig. 1 a) is described in the Supporting Material.
Figure 1.
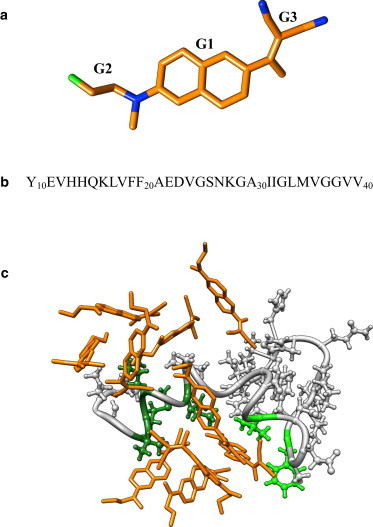
(a) FDDNP biomarker molecule consists of conjugated aromatic ring G1, fluoro terminal G2, and dicyano terminal G3. (Green and blue) Fluorine and nitrogen atoms, respectively. To serve as a tracer in positron emission tomography scans, FDDNP contains radiofluorinated 18F isotope. (b) Sequence of amino-terminal truncated Aβ10–40 peptide. Following the structure of Aβ peptide in the fibril (4), we define N- and C-termini as sequence regions 10–23 and 29–40. (c) Aβ10–40 monomer coincubated with 10 FDDNP ligands (in orange). (Light and dark green) Side chains composing the binding sites BS1 (Phe20, Val24) and BS2 (Ile32, Leu34, Met35, and Val36) are shown, respectively. (Light gray) The rest of Aβ. For clarity, water is not shown. (See online for colored figure.)
Previous experimental (41) and computational (42) studies have demonstrated that the size distributions and structures of the oligomers formed by Aβ10–40 and the N-terminal truncated fragment Aβ10–40 are similar. Furthermore, in the monomeric state the N-terminal of Aβ10–40 does not form extensive long-range interactions or an ordered secondary structure (25). Consequently, our simulations have been performed for the Aβ10–40 peptide by assuming that it can serve as a model for the full-length Aβ10–40 (Fig. 1 b).
We have considered two simulation systems with different concentrations of FDDNP. The first (S1) consisted of the Aβ10–40 monomer interacting with 10 FDDNP ligands in the 58.5 Å × 58.5 Å × 58.5 Å box containing 6277 TIP3P water molecules (Fig. 1 c). In S1, the ligand concentration is 80 mM and the ligand/Aβ stoichiometric ratio is 10:1. The second system (S2) was similar to S1 except that it contained only three FDDNP ligands. In S2, the ligand concentration is 32 mM and the ligand/Aβ stoichiometric ratio is 3:1. To neutralize the total charge in each system, one sodium ion was added. S1 and S2 simulations utilized periodic boundary conditions. Electrostatic interactions were computed using Ewald summation, whereas van der Waals interactions were smoothly switched off in the interval from 8 to 12 Å. Covalent bonds were constrained by SHAKE algorithm. The ligand/Aβ stoichiometric ratios used in our study are within the range typical for in vitro experiments (from 1:1 to 10:1) (43,44). Throughout the article, we refer to S1 and S2 as the systems with high and low ligand concentrations. Control simulations of Aβ peptide in ligand-free water, which were used as reference, have been performed earlier (40).
Replica exchange molecular dynamics
To sample conformational space of the systems S1 and S2 we used the NVT replica exchange method (45) coupled with the NAMD MD program (46). Forty replicas were distributed exponentially in the temperature range from 300 to 440 K. Canonical ensembles in individual replicas were produced by underdamped Langevin simulations of virtual solvent with the damping coefficient γ = 5 ps−1 and the integration step of 1 fs. Exchanges were attempted every 2 ps between all neighboring (along temperature axis) replicas with the average acceptance rates of 24% (S1) and 29% (S2). Four (S1) or three (S2) REMD trajectories were produced, resulting in cumulative simulation times of 3.2 and 2.4 μs, respectively (80 or 60 ns per replica). The initial segments of REMD trajectories discarded as nonequilibrated were of 20 (S1) and 4 (S2) ns. The REMD trajectories were started with random structures of Aβ peptide and ligands. Note that the S2 simulation time is shorter due to faster equilibration and sampling convergence of this system compared to S1. The REMD convergence and errors are analyzed in the Supporting Material.
Computation of structural probes
To compute molecular interactions we used the following procedure. A contact between Aβ amino acids is formed, if the distance between the centers of mass of side chains is <6.5 Å. We chose this cutoff because it approximately corresponds to the onset of hydration of side chains. FDDNP molecule can be divided into conjugated aromatic ring (G1), fluoro terminal (G2), and dicyano terminal (G3) (Fig. 1 a). G1 is hydrophobic, whereas G2 and G3 have mixed hydrophobic and hydrophilic properties. A contact with Aβ side chain occurs, if the distance between the centers of mass of the side chain and one of the FDDNP groups is < 6.5 Å. Two FDDNP molecules self-aggregate, if any of their G1–G3 centers of mass are within 6.5 Å distance. Ligand is assumed bound if it forms at least one contact with Aβ (Fig. 1 c). A ligand is in an extended bound shell if it is not directly bound to Aβ but is included in the cluster of self-aggregated ligands, which is bound to Aβ. Hydrogen bonds between donor (D) and acceptor (A) atoms exist, if the distance rDA ≤ 3.5 Å and ∠ DHA ≥ 120°. This definition was applied to detect intrapeptide and Aβ-ligand hydrogen bonds.
Peptide secondary structure was computed by STRIDE (47) and checked by applying the DSSP program (48; see the Supporting Material). To obtain solvent accessible surface area (ASA) we used VMD program and took into account all atoms including hydrogens, setting the probe radius to 1.4 Å (49). Hydrophobic accessible surface area (hASA) of amino acid is defined as a sum of ASA values for all apolar atoms in a side chain. Relative hASA of amino acid X is obtained by dividing the hASA of amino acid X by its ASA in the reference triplet state (50). Polar accessible surface area (pASA) of amino acid is the sum of ASA values for all polar atoms in a side chain. Its relative value is defined in the same way as relative hASA. The energetics of ligand binding was probed utilizing the NAMDEnergy module in VMD. Thermodynamic averages of structural quantities (denoted as 〈..〉) and free energy landscapes were computed using multiple histogram method (51). The data in the article are reported at 330 K.
Results
FDDNP binds to Aβ monomer
We first present our findings for the S1 system consisting of Aβ monomer and 10 FDDNP ligands. Using REMD, we computed the average number of bound ligands 〈L〉 at 330 K. Because 〈L〉 = 6.7 ± 0.1, we surmise that the binding probability for FDDNP molecule Pb is 0.67 ± 0.01. Note that Pb only accounts for the ligands directly bound to Aβ, i.e., residing in the first bound shell. If the ligands residing in the extended bound shell, i.e., bound to Aβ indirectly through other ligands, are included then Pb increases to 0.90 ± 0.04. In what follows, we refer to this probability as “extended binding probability”. To map the binding affinities of individual amino acids, we have computed the average number of contacts formed by amino acid i with the ligands, 〈Cl(i)〉. The plot of 〈Cl(i)〉 shown in Fig. 2 a demonstrates significant variations in the binding affinities of amino acids.
Figure 2.

(a) Average numbers of contacts formed by Aβ amino acids i with the ligands, 〈Cl(i)〉, are shown (shaded bars). Presented 〈Cl(i)〉values are normalized by the maximum value Cl,max. (Dashed line) Threshold value (2/3Cl,max) is used to define the ligand binding sites BS1 and BS2. (Solid circles) Changes in the relative hydrophobic ASA of amino acids i caused by FDDNP binding, 〈δhASA(i)〉. The average errors in 〈Cl(i)〉 and 〈δhASA(i)〉 are 5 and 10%. (Inset) Fraction of ligand-Aβ interactions attributed to the largest FDDNP cluster, fc = 〈Cl,c(i)/〈Cl(i)〉, where 〈Cl,c(i)〉 is the number of contacts formed by i with the largest cluster of self-aggregated ligands. (b) Free energy of FDDNP molecule, F(rb), as a function of the distance to Aβ monomer, rb. The states considered as bound (B) and unbound (U) for computing the free energy of binding are marked (solid circles). Both panels are computed for high ligand concentration at 330 K.
To identify binding sites, we assumed that an amino acid n participates in the binding site, if
where Cl,max is the maximum value of 〈Cl(i)〉 for all i. This definition identifies two binding sites: the first (BS1) is in the vicinity of the CHC (n = Phe20 and Val24) and the second (BS2) is in the C-terminal (n = Ile32, Leu34, Met35, and Val36). All binding amino acids are hydrophobic and most are located in the C-terminal. This conclusion is consistent with the computations of the average numbers of contacts with ligands formed by amino acids in the N-terminal (0.5 per amino acid) and in the C-terminal (0.9 per amino acid). Interestingly, five charged amino acids represent the five residues with the weakest affinity for FDDNP binding—Glu22 (0.08 ± 0.01), Glu11 (0.08 ± 0.01), Lys16 (0.12 ± 0.01), Asp23 (0.13 ± 0.02), and Lys28 (0.17 ± 0.02) (data in parenthesis are 〈Cl(i)〉 normalized by Cl,max). The total number of contacts between FDDNP molecules and Aβ is 20.2 ± 0.4, whereas the total number of contacts with hydrophobic amino acids is 13.5 ± 0 or 67%. In contrast, the average number of FDDNP-Aβ hydrogen bonds is 〈Nlhb〉 = 0.8 ± 0. Therefore, FDDNP binding is mostly driven by hydrophobic interactions with Aβ side chains, whereas FDDNP-Aβ hydrogen bonding does not play significant role.
To further substantiate our conclusions, Fig. 2 a presents the changes in the relative hydrophobic accessible surface areas (hASA) of amino acids caused by ligand binding, 〈δhASA(i)〉. (We define 〈δhASA(i)〉 = 〈hASAb(i)〉 − 〈hASAu(i)〉, where 〈hASAb(i)〉 and 〈hASAu(i)〉 are the hASA of amino acid i with FDDNP ligands bound or removed.) The figure displays remarkably strong correlation between 〈δhASA(i)〉 and 〈Cl(i)〉 (the correlation coefficient is r = 0.96). If one considers the absolute values of hASA, then the average hASA lost due to ligand binding is 28 ± 0 Å2 for hydrophobic residues, 9 ± 1 Å2 for polar, and 7 ± 1 Å2 and 3 ± 1 Å2 for positively and negatively charged amino acids. It is instructive to consider the change in the relative polar accessible surface areas (pASA) of amino acids caused by ligand binding, 〈δpASA(i)〉. Fig. S4 in the Supporting Material reveals that in contrast to 〈δhASA(i)〉, the change in pASA, 〈δpASA(i)〉, does not correlate with 〈Cl(i)〉 (r = 0.13). These results suggest that hydrophobic effect is the main driving factor of FDDNP binding.
To investigate the free energy of FDDNP finding, we computed the free energy of a ligand F(rb) as a function of the distance to Aβ surface rb. In Fig. 2 b, a deep and wide free energy minimum at rb,min ∼ 5 Å is associated with binding to the peptide. The free energy of binding can be defined as
where Fb is the bound free energy integrated over the states with F < F(rb,min) + 0.3 RT and Fu is the free energy of unbound state (rb > 18 Å). Then
so according to our definition ΔFb is −(2.2 ± 0.3) RT. This result is consistent with the extended binding probability Pb = 0.90, because F(rb) takes into account all ligands interacting with Aβ independent of their exact location in bound shells. The spatial distribution of FDDNP ligands around Aβ peptide is analyzed in Fig. S5.
FDDNP self-aggregation
FDDNP ligand is an uncharged hydrophobic molecule, in which apolar atoms make up ∼73% of its solvent accessible surface area (Fig. 1 a). This property raises the possibility of ligand self-aggregation during binding. To probe ligand-ligand interactions we have considered the average numbers of ligands 〈L(Sc)〉 forming bound clusters of the size Sc, where Sc (≥ 1) is the number of ligands in the cluster (Fig. 3). A cluster is considered bound to Aβ, if it includes at least one bound ligand. According to Fig. 3, the number of ligands in bound clusters is 〈Lc〉 = 9 ± 0.4, of which 8.8 ± 0.3 (or 98%) are included in the clusters of two or more molecules (Sc ≥ 2). Therefore, upon binding, the overwhelming majority of FDDNP ligands self-aggregate. Because the average number of ligands forming direct interactions with Aβ is 〈L〉 = 6.7 ± 0.1, approximately one-quarter of all ligands in bound clusters are not in direct contact with Aβ, thereby forming an extended bound shell. These calculations substantiate the correction to the probability of binding Pb in the previous section, which shows that the actual Pb is ∼0.90. Strong preference of FDDNP molecules for self-aggregation also follows from Table 1.
Figure 3.
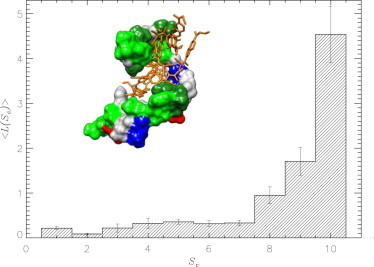
Average numbers of ligands 〈L(Sc)〉 involved in forming bound clusters consisting of Sc FDDNP molecules. The plot is obtained for high ligand concentration at 330 K. (Inset) FDDNP cluster cross-bridging the binding sites BS1 and BS2 (both in dark green) in the Aβ monomer. (Green, gray, blue, and red) Other hydrophobic, polar, positively and negatively charged amino acids. (See online for colored figure.)
Table 1.
Comparison of ligand-ligand and ligand-protein interactions
| System | 〈Clp〉 | 〈Cll〉 | 〈Elp〉, kcal/mol | 〈Ell〉, kcal/mol∗ |
|---|---|---|---|---|
| S1 | 2.0 ± 0.1 | 3.1 ± 0.1 | −11.8 ± 0.3 | −22.0 ± 0.6 |
| S2 | 3.1 ± 0.1 | 0.9 ± 0.1 | −15.6 ± 1.3 | −6.9 ± 1.4 |
Energy of interactions of a bound ligand with other ligands.
Bound FDDNP ligand, on an average, interacts with two amino acids (〈Clp〉 = 2 ± 0.1), but it forms more than three contacts with other ligands (〈Cll〉 = 3.1 ± 0.1). Furthermore, the energy of interactions of a bound ligand with other ligands is 〈Ell〉 = −22 ± 0.6 kcal/mol, whereas the energy of interactions of a bound ligand with Aβ is (〈Elp〉 = 11.8 ± 0.3 kcal/mol), i.e., ligand-ligand interactions are approximately twice stronger than ligand-peptide interactions. To provide an independent test of FDDNP self-aggregation, we have performed 30-ns simulations of FDDNP dimer in water at 330 K. Consistent with the findings for the system S1, the probability of dimer formation in water is Pla = 0.79, which is even higher than the probability of direct binding to Aβ. Hence, we expect ligand-ligand interactions to be an important factor in FDDNP binding.
Structure of Aβ peptide coincubated with FDDNP ligands
To evaluate the impact of FDDNP binding on Aβ structure, we have used program STRIDE to compute the secondary structure. Fig. 4 a shows the fractions of turn 〈t(i)〉 and helix 〈h(i)〉 structure formed by residues i. Overall, the conformational ensemble of Aβ monomer coincubated with FDDNP includes turn (〈t〉 = 0.57 ± 0.01), random coil (〈rc〉 = 0.32 ± 0.01), and helix (〈h〉 = 0.10 ± 0) fractions. The combined fraction of other types of secondary structure is negligible (0.01). The turn structure dominates the conformational ensembles in the N- and C-termini (0.65 ± 0.02 and 0.44 ± 0.01, respectively), whereas helix appears more frequently in the C-terminal (0.16 ± 0.01 vs. 0.04 ± 0 in the N-terminal). The random coil is approximately equally represented in both termini (0.31 ± 0.01 vs. 0.39 ± 0).
Figure 4.
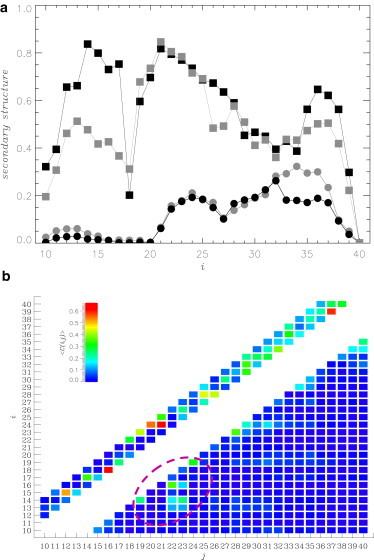
(a) Distribution of Aβ secondary structure: fractions of turn 〈t(i)〉 and helix 〈h(i)〉 structure formed by Aβ residues i are represented (squares and circles). (Solid and shaded representation) Data are for high FDDNP concentration and ligand free water, respectively. The average errors in 〈t(i)〉 and 〈h(i)〉 are 4 and 10%. (b) The contact map 〈C(i, j)〉 displays the probabilities of forming contacts between the side chains i and j (i < j). Local contacts (|i−j| < 5) are shown above the main diagonal, i.e., for those j < i. (Circled) Group of contacts between the sequence regions R1 and R2. All plots are obtained for high ligand concentration at 330 K. (See online for colored figure.)
Fig. 4 b presents the average map of Aβ side-chain contacts 〈C(i, j)〉. Analysis of the 16 most-frequent contacts in Table 2 and visual inspection of Fig. 4 b show that half of them are related to the long-range (|i – j| ≥ 5) interactions between the residues His13, His14, Lys16 (R1), and Glu22, Asp23, Val24 (R2). Importantly, the R1-R2 contacts represent the most long-range stable interactions in Aβ with the average |j – i| distance of 8.2 (excluding the contacts 14–19 and 19–24, see Table 2). For comparison, for other contacts in Table 2 the average |j – i| is 5.3. Although long-range 〈C(i, j)〉 for any specific pair of amino acids is low (≤0.36), the probability that at least one contact is established between R1 and R2 is significant (PR1−R2 = 0.61 ± 0.04). The most stable interaction between R1 and R2 (and across Aβ) is the salt bridge forming between Lys16 and Glu22 (〈C(16, 22)〉 ≈ 0.36). The only other intrapeptide contact with comparable probability of occurrence is the salt bridge Asp23-Lys28 (Table 2). The impact of R1-R2 interaction on the rigidity of Aβ backbone is considered in the Supporting Material.
Table 2.
List of the most stable long-range (|i – j| ≥ 5) intrapeptide contacts in the S1 system
| Rank | i | j | 〈C(i,j)〉 |
|---|---|---|---|
| 1 | 16 | 22 | 0.36 ± 0.06 |
| 2 | 23 | 28 | 0.36 ± 0 |
| 3 | 19 | 24 | 0.31 ± 0.01∗ |
| 4 | 14 | 23 | 0.25 ± 0.03 |
| 5 | 35 | 40 | 0.25 ± 0 |
| 6 | 14 | 19 | 0.25 ± 0.02∗ |
| 7 | 24 | 29 | 0.20 ± 0.03 |
| 8 | 34 | 40 | 0.17 ± 0.04 |
| 9 | 34 | 39 | 0.17 ± 0.02 |
| 10 | 14 | 22 | 0.17 ± 0.03 |
| 11 | 29 | 34 | 0.17 ± 0.05 |
| 12 | 24 | 31 | 0.16 ± 0.01 |
| 13 | 16 | 23 | 0.15 ± 0.02 |
| 14 | 30 | 35 | 0.13 ± 0.03 |
| 15 | 13 | 22 | 0.12 ± 0.06 |
| 16 | 13 | 23 | 0.12 ± 0.01 |
Contacts in bold represent the interactions between R1 and R2.
These two contacts bridge R1 and R2 regions through Phe19.
Impact of ligand concentration on binding mechanism
To investigate the dependence of FDDNP binding on the ligand/peptide stoichiometric ratio, we have studied the system S2 with reduced ligand concentration. Using REMD simulations we have obtained the binding probability Pb = 0.81 ± 0.05, which increases to 0.85 ± 0.5 if the ligands in the extended bound shell are included. As for S1 the binding affinities of individual amino acids i were probed by computing the average numbers of contacts with the ligands, 〈Cl(i)〉. Fig. 5 a shows that 〈Cl(i)〉 is very similar to that computed for the system S1 in Fig. 2 a (the correlation factor between the respective 〈Cl(i)〉 is 0.88). Using the same methodology as for S1, we determine from Fig. 5 a that the FDDNP binding sites are composed of Phe19, Phe20, and Val24 (BS1) and Leu34, Met35, and Val36 (BS2). Out of six binding amino acids for the systems S1 and S2, five are common. All binding amino acids identified for S2 are hydrophobic and charged amino acids (Glu22, Glu11, and Lys16) have the lowest binding affinities in Aβ peptide. The number of contacts with ligands 〈Cl(i)〉 in Fig. 5 a strongly correlates with the change in the relative hydrophobic ASA 〈δhASAb(i)〉 induced by binding (the correlation factor is r = 0.96). However, no correlation is observed between 〈Cl(i)〉 and the change in the relative polar ASA 〈δpASAb(i)〉 (r = 0.10, data not shown). These findings are consistent with those presented for S1.
Figure 5.
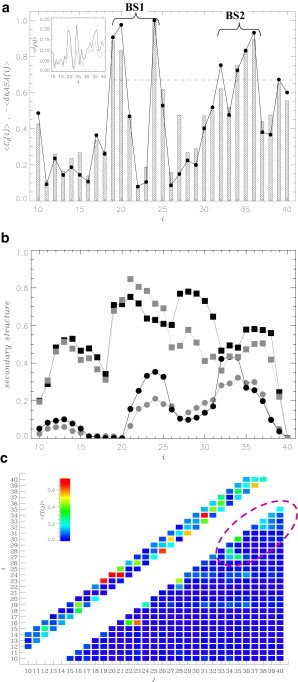
(a) Average numbers of contacts formed by Aβ amino acids i with the ligands, 〈Cl(i)〉 (shaded bars), in the system with low ligand concentration. The values of 〈Cl(i)〉 are normalized by the maximum value Cl,max. (Dashed line) Threshold value (2/3Cl,max) is used to define the ligand binding sites BS1 and BS2. (Black circles) Changes in the relative hydrophobic ASA 〈δhASA(i)〉 of amino acids i caused by FDDNP binding. (Inset) Comparison of 〈Cl(i)〉 computed for the systems with low (in solid representation) and high (in shaded representation) FDDNP concentrations. (b) Distribution of the Aβ secondary structure is characterized by the fractions of turn 〈t(i)〉 (squares) and helix 〈h(i)〉 (circles) structure formed by residues i. (Solid and shaded representations) Data represent low FDDNP concentration and ligand free water, respectively. The errors in panels a and b are similar to those in Figs. 2a and 4a. (c) The contact map 〈C(i, j)〉 shows the probabilities of forming contacts between the side chains i and j at low FDDNP concentration (i < j). Local contacts (|j−i| < 5) are shown above the main diagonal, i.e., for those j < i. (Circled) The group of stable contacts in the C-terminal. (See online for colored figure.)
There are also important differences between FDDNP binding in S1 and S2 systems. The inset to Fig. 5 a indicates that the ligands in S2 form more direct interactions with Aβ than in S1. From the inset we determine that, on an average, the number of contacts between amino acid and ligands in S2 is 1.6-times larger than in S1. This observation is consistent with Table 1, which shows that the average number of contacts with amino acids formed by a ligand 〈Clp〉 increases from 2.0 ± 0.1 (S1) to 3.1 ± 0.1 (S2). Simultaneously, there are significantly fewer ligand-ligand contacts 〈Cll〉 in S2 compared to S1 (0.9 ± 0.1 vs. 3.1 ± 0.1 in Table 1). Furthermore, in S2 the average energy of interaction of a bound FDDNP with Aβ is 〈Elp〉 = −15.6 ± 1.3 kcal/mol, which is almost 30% lower than 〈Elp〉 in S1.
However, the average energy of interactions of a bound ligand with other ligands 〈Ell〉 (= −6.9 ± 1.4 kcal/mol) is approximately three-times smaller than in S1 (〈Ell〉 = −22.0 ± 0.6 kcal/mol)). Therefore, although the locations of FDDNP binding sites are largely independent of ligand/peptide stoichiometry, the ligand concentration does affect binding energetics—namely, in S1, ligand-ligand interactions make far larger contribution to binding energetics than direct ligand-peptide interactions. Such large contribution of ligand-ligand interactions is not observed in S2. The difference reflects diminished self-aggregation of ligands in S2. Indeed, the average fraction of bound ligands, which do not interact with other ligands upon binding, is 0.02 in S1, but increases to 0.32 in S2. In addition, the fraction of ligands forming an extended bound shell is just 0.04 compared to 0.23 in S1.
The distribution of secondary structure in Aβ peptide coincubated with three FDDNP ligands is presented in Fig. 5 b. The dominant type of structure sampled by Aβ is turn (〈t〉 = 0.54 ± 0.01) followed by random coil (〈rc〉 = 0.30 ± 0) and helix (〈h〉 = 0.16 ± 0.01). The average fractions 〈t〉, 〈rc〉, and 〈h〉 are similar between S1 and S2, and the comparison of Figs. 4 a and 5 b reveals minor differences in the local secondary structure propensities. The root-mean-square deviations (RMSD) for the turn, random coil, and helix structures formed by individual amino acids are 0.16, 0.16, and 0.10, respectively, whereas the combined RMSD (i.e., the sum of three individual RMSDs) is 0.42. These calculations suggest that minor differences are observed in the distributions of turn (due to differing turn propensities in R1 and 27–31 region) and of random coil (in R1 and 27–34 region; data not shown).
In S1, long-range interactions between R1 and R2 regions are established (Fig. 4 b). However, comparison of the contact maps in Figs. 4 b and 5 c suggests that these interactions are largely absent in S2. Out of seven R1-R2 contacts in Table 2 (note that contacts 14–19 and 19–24 bridging R1 and R2 through Phe19 are counted as one), only two (salt bridges Lys16-Glu22 and Lys16-Asp23) are also found in the S2 contact map (Table 3). According to Tables 2 and 3 and visual inspection of Figs. 4 b and 5 c, most of the long-range interactions in S2 are shifted to the C-terminal, which participates in the 11 most-probable contacts in S2 (for S1, this number is five). In general, among 16 most-probable intrapeptide contacts in S1 and S2 systems (Tables 2 and 3) there are only seven common contacts. There are also significant changes in the probabilities of forming individual interactions. For example, the value of 〈C (16, 23)〉 increases from 0.15 ± 0.02 (S1) to 0.61 ± 0.06 (S2) or 〈C (30, 35)〉 changes from 0.13 ± 0.03 (S1) to 0.36 ± 0.02 (S2). Taken together, it appears that ligand concentration weakly affects Aβ secondary structure, but it does alter the distribution of tertiary interactions in Aβ monomer.
Table 3.
List of the most stable long-range (|i – j| ≥ 5) intrapeptide contacts in the S2 system
| Rank | i | j | 〈C(i,j)〉 |
|---|---|---|---|
| 1 | 16 | 23 | 0.61 ± 0.06 |
| 2 | 23 | 28 | 0.45 ± 0.05 |
| 3 | 16 | 22 | 0.37 ± 0.05 |
| 4 | 30 | 35 | 0.36 ± 0.02 |
| 5 | 27 | 35 | 0.28 ± 0.02 |
| 6 | 28 | 34 | 0.28 ± 0.01 |
| 7 | 19 | 24 | 0.24 ± 0 |
| 8 | 35 | 40 | 0.19 ± 0 |
| 9 | 33 | 38 | 0.17 ± 0.04 |
| 10 | 32 | 38 | 0.16 ± 0.03 |
| 11 | 27 | 34 | 0.16 ± 0.01 |
| 12 | 34 | 39 | 0.14 ± 0.01 |
| 13 | 22 | 28 | 0.12 ± 0.03 |
| 14 | 24 | 36 | 0.12 ± 0.03 |
| 15 | 32 | 39 | 0.11 ± 0.03 |
| 16 | 27 | 32 | 0.10 ± 0.01 |
Contacts in bold are common between S1 and S2 systems.
Discussion
Binding mechanism of FDDNP biomarker
Using exhaustive REMD sampling, we have studied binding of the FDDNP biomarker to the Aβ monomer. This ligand reveals a strong binding propensity, which, when measured by the binding probability Pb, reaches ∼0.90 independent of the precise value of ligand concentration. Analysis of the average number of contacts formed by amino acids i with ligands, 〈Cl(i)〉, suggests that the Aβ peptide has two binding sites, the first BS1 located near the CHC and the second BS2 in the C-terminal. These binding sites are entirely hydrophobic and composed of largely the same amino acids at both ligand concentrations (Figs. 2 a and 5 a). We further showed that ligand-Aβ interactions strongly correlate with the change in the relative hydrophobic ASA 〈δhASA(i)〉 induced by binding. At both biomarker concentrations the correlation factor between 〈δhASA(i)〉 and 〈Cl(i)〉 approaches 1.0 (Figs. 2 a and 5 a). It is important that no correlation is observed between the changes in the relative polar ASA 〈δpASA(i)〉 caused by binding and 〈Cl(i)〉 (see Fig. S4). Charged Aβ amino acids have the lowest binding affinities.
Further indication that FDDNP binding is largely driven by hydrophobic effect follows from the analysis of hydrophobicities of Aβ side chains involved in the interactions with ligands. The Aβ peptide contains amino acids of 15 types. Using the distribution of 〈Cl(i)〉 in Fig. 2 a, it is a straightforward process to obtain the average number of contacts with ligands formed by amino acid of the type a, 〈Cl(a)〉. Fig. 6 a presents 〈Cl(a)〉 as a function of the hydrophobicities of amino acids a based on Kyte-Doolittle scale, K(a) (52). This figure demonstrates that amino acids with higher hydrophobicities tend to form more interactions with FDDNP. The correlation coefficient of r = 0.82 for 〈Cl(a)〉 and K(a) confirms this trend. Similar correlation (r = 0.73) between 〈Cl(a)〉 and K(a) is seen when the ligand concentration is low (system S2).
Figure 6.
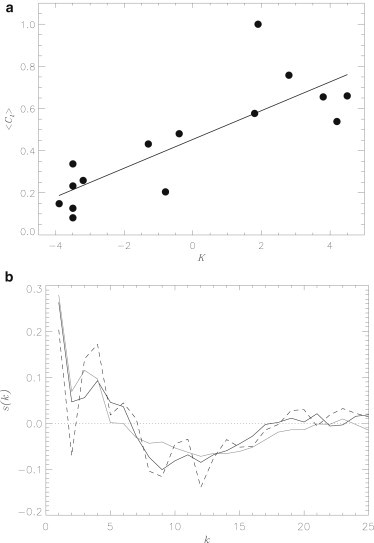
(a) Average number of contacts 〈Cl(a)〉 formed by amino acid of the type a with FDDNP ligands as a function of amino-acid hydrophobicity K(a) quantified by the Kyte-Doolittle scale. (Straight line) Linear fit 〈Cl(a)〉 = b0 + b1K(a) with b0 = 0.45 and b1 = 0.07. The plot is obtained for high ligand concentration at 330 K. (b) The function s(k) measures correlations in Aβ backbone orientation as a function of sequence distance k between residues. (Solid, shaded, and dashed lines) Data computed respectively for high FDDNP concentration solution, ligand-free water, and ibuprofen solution (40).
The correlation between 〈Cl(a)〉 and amino-acid hydrophobicity does not depend appreciably on the specific scale. For example, if the scales proposed by Rose et al. (50) or Eisenberg et al. (53) are used, the respective r values are 0.84 or 0.83 for the system S1. In principle, several FDDNP atoms including fluorine and nitrogens can serve as hydrogen-bond acceptors. However, because the number of ligand-Aβ hydrogen bonds is negligible, these interactions appear to play only minor roles in binding to Aβ. Taken together, our findings suggest that, at high and low ligand concentrations, the main factor governing FDDNP binding is hydrophobic effect. This conclusion is consistent with the fluorescence data showing that bound FDDNP probes tend to localize in the hydrophobic clefts on the fibril surface (12).
Our study has demonstrated that FDDNP ligands are characterized by a strong self-aggregation propensity. It follows from Fig. 3 that at high FDDNP concentration almost all bound ligands (98%) self-aggregate. According to Table 1, this propensity is so profound that bound FDDNP molecules form more interactions with other ligands than with Aβ. As a result, at high concentration, FDDNP ligands tend to coalesce into large clusters, which cross-bridge the two binding sites BS1 and BS2 (the inset to Fig. 3). Indeed, the probability for a single ligand cluster to be bound simultaneously to BS1 and BS2 is ≈0.7.
Furthermore, because almost all ligands are included in the largest cluster, the interactions between this cluster and Aβ constitute most of the ligand-Aβ interactions. The inset to Fig. 2 a shows the fraction fc of ligand-Aβ interactions attributed to the largest cluster. For all residues, fc > 0.8, with the average value being equal to ≈0.91. However, these aspects of FDDNP binding are concentration-dependent. At low concentration the binding energetics is dominated by direct ligand-Aβ interactions, whereas ligand-ligand interactions are far weaker. As evident from Table 1, the number of ligand-ligand contacts is threefold smaller than the number of Aβ-ligand contacts.
As a result, approximately one-third of all bound ligands at low concentration are stand-alone molecules forming no interactions with other ligands. Therefore, ligand self-aggregation makes an important contribution to binding with the increase in FDDNP concentration, but it does not alter the main binding factor (hydrophobic effect) or the locations of binding sites in Aβ. It is important to emphasize that self-aggregation of FDDNP is not merely the consequence of high ligand concentration, but is determined by FDDNP hydrophobicity and the existence of specific binding locations (BS1 and BS2) in Aβ peptide, which involve only 19% of its sequence or ∼21% of the peptide ASA. The following estimates for the system S1 illustrate this point. If the total loss of Aβ ASA associated with ligand binding is ≈690 Å2 and the average number of bound ligands is 〈L〉 ≈ 6.7, then the ASA occupied by a single-bound FDDNP is ∼103 Å2. The total Aβ ASA is ≈3329 Å2, which implies that the peptide can accommodate binding of up 32 ligands or of all ligands present in S1, provided that binding is not residue-specific. Yet, approximately one-quarter of ligands reside in the extended bound shells without forming direct interactions with Aβ, which is the consequence of FDDNP hydrophobicity and residue-specific binding.
We have recently studied the mechanism of ibuprofen binding to Aβ monomer using the system analogous to S1 (40). As FDDNP ibuprofen binding is driven by hydrophobic interactions and the ibuprofen binding sites, BS1 (Phe20, Val24) and BS2 (Ala30, Ile32, Leu34, Met35, Val36) are almost identical to those of FDDNP. This result is consistent with the experiments, which revealed that FDDNP and ibuprofen share binding sites in the Aβ fibril (11). However, FDDNP self-aggregation makes this ligand distinct from ibuprofen, which demonstrates a weak self-aggregation propensity due to its negative net charge.
One may expect that FDDNP self-aggregation propensity would play an important role in binding to Aβ fibrils. The experiments of Agdeppa et al. (12) have estimated that the number of FDDNP binding sites is from 3.5 to 7.1 per 10,000 fibril peptides. Such a small number of binding sites suggests that most of Aβ peptides are buried in the fibril, leaving only few on its surface available for binding. Given that a typical in vitro ligand/peptide stoichiometric ratio is ≥1, a large local excess of ligands over peptides should be expected. Then one may argue that binding FDDNP ligands are likely to self-aggregate on the fibril surface. In our previous studies of naproxen, which is structurally similar to FDDNP, we found that it tends to concentrate in the grooves and indentations on the fibril surface (37). Following the analogy with naproxen, we propose that FDDNP ligands display the same tendency. Similar localization of binding molecules in the fibril hydrophobic grooves has been observed computationally for thioflavin T dye and its neutral analog BTA-1 (54).
Finally, it is important to comment on the biological applicability of our results. Aβ peptides in vivo form a variety of aggregated species, from small oligomers to fibrils. A priori, it is not clear if the modes of FDDNP binding to these species are similar to those found for the Aβ monomers. Further studies specifically probing the interactions of FDDNP with Aβ oligomers will address this issue.
Does FDDNP binding change Aβ structure?
In our previous studies, we have mapped the structural ensemble of Aβ monomer in a ligand-free water environment (40). Using those REMD simulations, we can assess the impact of FDDNP binding on Aβ structure. We have shown that the conformational ensemble of Aβ monomer coincubated with 10 FDDNP ligands includes turn (〈t〉 ≈ 0.57), random coil (〈rc〉 ≈ 0.32), and helix (〈h〉 ≈ 0.10) structures. The propensity to form turns is especially strong in the N-terminal (〈t(Nt)〉 ≈ 0.65, Fig. 4 a). Comparison with the secondary structure of Aβ in ligand-free water (Fig. 4 a) indicates that FDDNP somewhat enhances the turn structure (in water 〈t〉 ≈ 0.48), especially in the region 12–17 near CHC.
However, Fig. 4 a also demonstrates that excluding this specific region the fractions of turn, helix, and random coil (not shown) are remarkably similar for Aβ peptides in ligand-free water and coincubated with FDDNP. Indeed, the average fractions of helix and random coil in water (0.13 and 0.38) differ little from those found for FDDNP. Minor changes in secondary structure induced by FDDNP are consistent with small changes in the numbers of intrapeptide hydrogen bonds 〈Nhb〉 (5.6 in water and 5.2 in FDDNP solution) and side-chain contacts 〈C〉 (26.4 in water and 24.6 in FDDNP solution), and in the radius of gyration 〈Rg〉 (14.7 Å in water and 15.5 Å in FDDNP solution). The RMSDs for the turn, random coil, and helix structures are 0.16, 0.15, and 0.05, respectively, with the combined RMSD of 0.36.
At low FDDNP concentration, the Aβ peptide adopts generally similar (to water) distributions of secondary structure (Fig. 5 b). Some differences are observed in the turn propensities within R1 and 27–31 region and in random coil within R1 and 27–34. The RMSDs for the turn, random coil, and helix structures are 0.12, 0.12, and 0.07, respectively, and the combined RMSD is 0.31. To put these results in perspective, we consider the changes in Aβ secondary structure induced by ibuprofen (40). We have shown that this ligand enhances helix propensity by forming helix-stabilizing cross-bridges between the amino acids i and i + 4. Consequently, the average helix fraction 〈h〉 increases from 0.13 in water to 0.33 in ibuprofen solution, whereas in the C-terminal region 29–35 〈h〉 rises from 0.25 to 0.74. With respect to water, the RMSD combined from the turn, random coil, and helix structures is 0.62 with the individual RMSDs being equal to 0.18, 0.17, and 0.27. These RMSDs especially for helix far exceed those computed for both FDDNP systems.
An independent measure of changes in Aβ secondary structure is provided by the autocorrelation function
where is a pseudo backbone vector and is the radius vector of the Cα atom in the residue i. The bar indicates an average taken over i and Aβ structures. The function s(k) measures the correlations in backbone orientation as a function of the distance k between residues. Fig. 6 b shows that the s(k) values computed for a high FDDNP concentration system and for ligand-free water are very similar, but sharply different from the s(k) value obtained for Aβ coincubated with ibuprofen. Sharp oscillations in s(k) values (e.g., at k = 2 and 4) reflect the formation of helix structures induced by ibuprofen, which are muted in water or FDDNP solution.
Although FDDNP induces minor change in Aβ secondary structure, it nevertheless alters the peptide tertiary fold. At high FDDNP concentration, long-range interactions are established between R1 and R2 Aβ sequence regions, which are largely absent at low ligand concentration (Figs. 4 b and 5 c and Tables 2 and 3). In the latter case, most long-range interactions emerge in the C-terminal. Fig. S7 demonstrates that in ligand-free water, the Aβ monomer lacks long-range interactions either between R1 and R2 or in the C-terminal, but contains numerous hydrophobic contacts between the residues near CHC (Phe19, Val24) and in the C-terminal (Gly29, Ile31, Val34, Met35). The Asp23-Lys28 salt bridge, which is important for Aβ fibril stability (4) and aggregation propensity (55), has low probability of occurrence in water (〈C(i, j)〉 ≈ 0.17), but is partially formed at low (0.45) and high (0.36) FDDNP concentrations. Therefore, in contrast to Aβ secondary structure, its tertiary fold can be modified by FDDNP interactions.
The potential implications of our study are twofold. First, changes in Aβ secondary structure induced by FDDNP are minor compared to the impact of ibuprofen. Moreover, in contrast to ibuprofen, FDDNP does not affect helix propensity. Recent experiments have analyzed the impact of 96 ligands on Aβ structure and aggregation propensity (44). These studies have shown that inhibitor ligands generally increase Aβ helix content, while the ligands stimulating peptide fibrilization tend to enhance β structure. In contrast to ibuprofen, FDDNP shows neither of these effects and leaves Aβ secondary structure largely unchanged. Then, FDDNP is expected to be a weak antiaggregation agent, at least compared to ibuprofen. This tentative conclusion is important for the following reason. Radiolabeled FDDNP has a decay half-time of ∼2 h. This timescale is sufficiently long for a ligand to distort Aβ equilibrium. For example, in vitro experiments have showed that within 2 h, ibuprofen or naproxen can reduce Aβ fibril load up to 50% (43), potentially elevating the concentration of cytotoxic Aβ oligomers (56). However, based on our findings, these concerns do not appear to be pertinent to FDDNP. Second, although the experiments have demonstrated FDDNP binding to Aβ fibrils (11,43), its interactions with other Aβ species have never been probed. Our study shows that FDDNP ligands can bind to Aβ monomers with high affinity. The possibility that FDDNP can simultaneously recognize benign monomers and cytotoxic fibrils, which are both found in vivo, raises the question of selectivity of this biomarker.
Conclusions
We have used all-atom explicit solvent model and replica exchange molecular dynamics to investigate binding of FDDNP biomarker to Aβ10–40 monomer. The significance of our results is fourfold. First, we have determined the mechanism of FDDNP binding to the Aβ10–40 monomer. At low and high concentrations this ligand binds with high affinity to two sites in the Aβ10–40 monomer located near the central hydrophobic cluster and in the C-terminal. Our analysis shows that at both concentrations hydrophobic effect is a main binding factor. However, with the increase in ligand concentration the interactions between FDDNP molecules also become important due to the strong FDDNP self-aggregation propensity and few specific binding locations. Second, we have probed the impact of FDDNP on Aβ10–40 structure. Taking the Aβ10–40 conformational ensemble in ligand-free water as reference, we showed that FDDNP induces minor changes in the Aβ10–40 secondary structure. At the same time, FDDNP does alter the peptide tertiary fold by redistributing long-range side-chain interactions. Third, we argued that, because FDDNP does not change Aβ10–40 secondary structure, it is likely to be a weaker anti-aggregation agent compared to ibuprofen. Fourth, our findings and previous experimental studies demonstrate that FDDNP ligands bind with high affinity to Aβ monomers and fibrils. Consequently, we suggest that the ability of FDDNP to distinguish cytotoxic fibrils from benign monomers must be verified in future studies.
Acknowledgments
The authors thank E. Prabhu Raman for assistance with parameterization of FDDNP using the CHARMM General Force Field and Kenno Vanommeslaeghe for access to a pre-release, developmental version of ParamChem 0.9.3.
Supporting Material
References
- 1.Glenner G.G., Wong C.W. Alzheimer's disease: initial report of the purification and characterization of a novel cerebrovascular amyloid protein. Biochem. Biophys. Res. Commun. 1984;120:885–890. doi: 10.1016/s0006-291x(84)80190-4. [DOI] [PubMed] [Google Scholar]
- 2.Steiner B., Mandelkow E.-M., Mandelkow E. Phosphorylation of microtubule-associated protein tau: identification of the site for Ca2+-calmodulin dependent kinase and relationship with tau phosphorylation in Alzheimer tangles. EMBO J. 1990;9:3539–3544. doi: 10.1002/j.1460-2075.1990.tb07563.x. [DOI] [PMC free article] [PubMed] [Google Scholar]
- 3.Hardy J., Selkoe D.J. The amyloid hypothesis of Alzheimer's disease: progress and problems on the road to therapeutics. Science. 2002;297:353–356. doi: 10.1126/science.1072994. [DOI] [PubMed] [Google Scholar]
- 4.Petkova A.T., Yau W.-M., Tycko R. Experimental constraints on quaternary structure in Alzheimer's β-amyloid fibrils. Biochemistry. 2006;45:498–512. doi: 10.1021/bi051952q. [DOI] [PMC free article] [PubMed] [Google Scholar]
- 5.Paravastu A.K., Leapman R.D., Tycko R. Molecular structural basis for polymorphism in Alzheimer's β-amyloid fibrils. Proc. Natl. Acad. Sci. USA. 2008;105:18349–18354. doi: 10.1073/pnas.0806270105. [DOI] [PMC free article] [PubMed] [Google Scholar]
- 6.Haass C., Selkoe D.J. Soluble protein oligomers in neurodegeneration: lessons from the Alzheimer's amyloid β-peptide. Nat. Rev. Mol. Cell Biol. 2007;8:101–112. doi: 10.1038/nrm2101. [DOI] [PubMed] [Google Scholar]
- 7.Shankar G.M., Li S., Selkoe D.J. Amyloid-β protein dimers isolated directly from Alzheimer's brains impair synaptic plasticity and memory. Nat. Med. 2008;14:837–842. doi: 10.1038/nm1782. [DOI] [PMC free article] [PubMed] [Google Scholar]
- 8.Yoshiike Y., Akagi T., Takashima A. Surface structure of amyloid-β fibrils contributes to cytotoxicity. Biochemistry. 2007;46:9805–9812. doi: 10.1021/bi700455c. [DOI] [PubMed] [Google Scholar]
- 9.Cheng I.H., Scearce-Levie K., Mucke L. Accelerating amyloid-β fibrilization reduces oligomer levels and functional deficits in Alzheimer disease mouse models. J. Biol. Chem. 2007;282:23818–23828. doi: 10.1074/jbc.M701078200. [DOI] [PubMed] [Google Scholar]
- 10.Nordberg A., Rinne J.O., Långström B. The use of PET in Alzheimer disease. Nat. Rev. Neurol. 2010;6:78–87. doi: 10.1038/nrneurol.2009.217. [DOI] [PubMed] [Google Scholar]
- 11.Agdeppa E.D., Kepe V., Barrio J.R. In vitro detection of (s)-naproxen and ibuprofen binding to plaques in the Alzheimer's brain using the positron emission tomography molecular imaging probe 2-(1-{6-[(2- [18F]fluoroethyl)(methyl)amino]-2-naphthyl}ethylidene) malononitrile. Neuroscience. 2003;117:723–730. doi: 10.1016/s0306-4522(02)00907-7. [DOI] [PubMed] [Google Scholar]
- 12.Agdeppa E., Kepe V., Barrio J.R. Binding characteristics of radiofluorinated 6-dialkylamino-2-naphthylethylidene derivatives as positron emission tomography imaging probes for β-amyloid plaques in Alzheimers disease. J. Neurosci. 2001;21:RC189. doi: 10.1523/JNEUROSCI.21-24-j0004.2001. [DOI] [PMC free article] [PubMed] [Google Scholar]
- 13.Landau M., Sawaya M.R., Eisenberg D. Towards a pharmacophore for amyloid. PLoS Biol. 2011;9:e1001080. doi: 10.1371/journal.pbio.1001080. [DOI] [PMC free article] [PubMed] [Google Scholar]
- 14.Bresjanac M., Smid L.M., Popovic M. Molecular-imaging probe 2-(1-[6-[(2-fluoroethyl)(methyl) amino]-2-naphthyl]ethylidene) malononitrile labels prion plaques in vitro. J. Neurosci. 2003;23:8029–8033. doi: 10.1523/JNEUROSCI.23-22-08029.2003. [DOI] [PMC free article] [PubMed] [Google Scholar]
- 15.Kepe V., Huang S.C., Barrio J.R. Visualizing pathology deposits in the living brain of patients with Alzheimer's disease. Methods Enzymol. 2006;412:144–160. doi: 10.1016/S0076-6879(06)12010-8. [DOI] [PubMed] [Google Scholar]
- 16.Shin J., Kepe V., Small G.W. The merits of FDDNP-PET imaging in Alzheimer's disease. J. Alzheimers Dis. 2011;26(Suppl 3):135–145. doi: 10.3233/JAD-2011-0008. [DOI] [PubMed] [Google Scholar]
- 17.Blennow K. Biomarkers in Alzheimer's disease drug development. Nat. Med. 2010;16:1218–1222. doi: 10.1038/nm.2221. [DOI] [PubMed] [Google Scholar]
- 18.Tolboom N., van der Flier W.M., van Berckel B.N. Molecular imaging in the diagnosis of Alzheimer's disease: visual assessment of [11C]PIB and [18F]FDDNP PET images. J. Neurol. Neurosurg. Psychiatry. 2010;81:882–884. doi: 10.1136/jnnp.2009.194779. [DOI] [PubMed] [Google Scholar]
- 19.Ma B., Nussinov R. Simulations as analytical tools to understand protein aggregation and predict amyloid conformation. Curr. Opin. Chem. Biol. 2006;10:445–452. doi: 10.1016/j.cbpa.2006.08.018. [DOI] [PubMed] [Google Scholar]
- 20.Nguyen P.H., Li M.S., Thirumalai D. Monomer adds to preformed structured oligomers of Aβ-peptides by a two-stage dock-lock mechanism. Proc. Natl. Acad. Sci. USA. 2007;104:111–116. doi: 10.1073/pnas.0607440104. [DOI] [PMC free article] [PubMed] [Google Scholar]
- 21.Krone M.G., Hua L., Shea J.E. Role of water in mediating the assembly of Alzheimer amyloid-β Aβ16–22 protofilaments. J. Am. Chem. Soc. 2008;130:11066–11072. doi: 10.1021/ja8017303. [DOI] [PMC free article] [PubMed] [Google Scholar]
- 22.Takeda T., Klimov D.K. Replica exchange simulations of the thermodynamics of Aβ fibril growth. Biophys. J. 2009;96:442–452. doi: 10.1016/j.bpj.2008.10.008. [DOI] [PMC free article] [PubMed] [Google Scholar]
- 23.Sgourakis N.G., Yan Y., Garcia A.E. The Alzheimer's peptides Aβ40 and 42 adopt distinct conformations in water: a combined MD/NMR study. J. Mol. Biol. 2007;368:1448–1457. doi: 10.1016/j.jmb.2007.02.093. [DOI] [PMC free article] [PubMed] [Google Scholar]
- 24.Yang M., Teplow D.B. Amyloid β-protein monomer folding: free-energy surfaces reveal alloform-specific differences. J. Mol. Biol. 2008;384:450–464. doi: 10.1016/j.jmb.2008.09.039. [DOI] [PMC free article] [PubMed] [Google Scholar]
- 25.Vitalis A., Caflisch A. Micelle-like architecture of the monomer ensemble of Alzheimer's amyloid-β peptide in aqueous solution and its implications for Aβ aggregation. J. Mol. Biol. 2010;403:148–165. doi: 10.1016/j.jmb.2010.08.003. [DOI] [PubMed] [Google Scholar]
- 26.Lu Y., Derreumaux P., Wei G. Thermodynamics and dynamics of amyloid peptide oligomerization are sequence dependent. Proteins. 2009;75:954–963. doi: 10.1002/prot.22305. [DOI] [PubMed] [Google Scholar]
- 27.Bellesia G., Shea J.-E. What determines the structure and stability of KFFE monomers, dimers, and protofibrils? Biophys. J. 2009;96:875–886. doi: 10.1016/j.bpj.2008.10.040. [DOI] [PMC free article] [PubMed] [Google Scholar]
- 28.Takeda T., Klimov D.K. Interpeptide interactions induce helix to strand structural transition in Aβ peptides. Proteins. 2009;77:1–13. doi: 10.1002/prot.22406. [DOI] [PMC free article] [PubMed] [Google Scholar]
- 29.Anand P., Nandel F.S., Hansmann U.H.E. The Alzheimer β-amyloid (Aβ (1–39)) dimer in an implicit solvent. J. Chem. Phys. 2008;129:195102. doi: 10.1063/1.3021062. [DOI] [PMC free article] [PubMed] [Google Scholar]
- 30.Urbanc B., Betnel M., Teplow D.B. Elucidation of amyloid β-protein oligomerization mechanisms: discrete molecular dynamics study. J. Am. Chem. Soc. 2010;132:4266–4280. doi: 10.1021/ja9096303. [DOI] [PMC free article] [PubMed] [Google Scholar]
- 31.Convertino M., Vitalis A., Caflisch A. Disordered binding of small molecules to Aβ(12–28) J. Biol. Chem. 2011;286:41578–41588. doi: 10.1074/jbc.M111.285957. [DOI] [PMC free article] [PubMed] [Google Scholar]
- 32.Lemkul J.A., Bevan D.R. Destabilizing Alzheimer's Aβ (42) protofibrils with morin: mechanistic insights from molecular dynamics simulations. Biochemistry. 2010;49:3935–3946. doi: 10.1021/bi1000855. [DOI] [PubMed] [Google Scholar]
- 33.Wu C., Bowers M.T., Shea J.E. On the origin of the stronger binding of PIB over thioflavin T to protofibrils of the Alzheimer amyloid-β peptide: a molecular dynamics study. Biophys. J. 2011;100:1316–1324. doi: 10.1016/j.bpj.2011.01.058. [DOI] [PMC free article] [PubMed] [Google Scholar]
- 34.Chebaro Y., Jiang P., Derreumaux P. Structures of Aβ17-42 trimers in isolation and with five small-molecule drugs using a hierarchical computational procedure. J. Phys. Chem. B. 2012;116:8412–8422. doi: 10.1021/jp2118778. [DOI] [PubMed] [Google Scholar]
- 35.Raman E.P., Takeda T., Klimov D.K. Molecular dynamics simulations of Ibuprofen binding to Aβ peptides. Biophys. J. 2009;97:2070–2079. doi: 10.1016/j.bpj.2009.07.032. [DOI] [PMC free article] [PubMed] [Google Scholar]
- 36.Chang W.E., Takeda T., Klimov D.K. Molecular dynamics simulations of anti-aggregation effect of ibuprofen. Biophys. J. 2010;98:2662–2670. doi: 10.1016/j.bpj.2010.02.031. [DOI] [PMC free article] [PubMed] [Google Scholar]
- 37.Takeda T., Chang W.E., Klimov D.K. Binding of non-steroidal anti-inflammatory drugs to Aβ fibril. Proteins. 2010;78:2859–2860. doi: 10.1002/prot.22804. [DOI] [PMC free article] [PubMed] [Google Scholar]
- 38.Kim S., Chang W.E., Klimov D.K. Naproxen interferes with the assembly of Aβ oligomers implicated in Alzheimer's disease. Biophys. J. 2011;100:2024–2032. doi: 10.1016/j.bpj.2011.02.044. [DOI] [PMC free article] [PubMed] [Google Scholar]
- 39.Buck M., Bouguet-Bonnet S., MacKerell A.D., Jr. Importance of the CMAP correction to the CHARMM22 protein force field: dynamics of hen lysozyme. Biophys. J. 2006;90:L36–L38. doi: 10.1529/biophysj.105.078154. [DOI] [PMC free article] [PubMed] [Google Scholar]
- 40.Lockhart C., Kim S., Klimov D.K. Explicit solvent molecular dynamics simulations of Abeta peptide interacting with ibuprofen ligands. J. Phys. Chem. B. 2012 doi: 10.1021/jp306208n. In press. [DOI] [PubMed] [Google Scholar]
- 41.Bitan G., Vollers S.S., Teplow D.B. Elucidation of primary structure elements controlling early amyloid β-protein oligomerization. J. Biol. Chem. 2003;278:34882–34889. doi: 10.1074/jbc.M300825200. [DOI] [PubMed] [Google Scholar]
- 42.Takeda T., Klimov D.K. Probing the effect of amino-terminal truncation for Aβ1–40 peptides. J. Phys. Chem. B. 2009;113:6692–6702. doi: 10.1021/jp9016773. [DOI] [PMC free article] [PubMed] [Google Scholar]
- 43.Hirohata M., Ono K., Yamada M. Non-steroidal anti-inflammatory drugs have anti-amyloidogenic effects for Alzheimer's β-amyloid fibrils in vitro. Neuropharmacology. 2005;49:1088–1099. doi: 10.1016/j.neuropharm.2005.07.004. [DOI] [PubMed] [Google Scholar]
- 44.Ryan T.M., Friedhuber A., Roberts B.R. Small amphipathic molecules modulate secondary structure and amyloid fibril-forming kinetics of Alzheimer disease peptide Aβ(1–42) J. Biol. Chem. 2012;287:16947–16954. doi: 10.1074/jbc.M111.321778. [DOI] [PMC free article] [PubMed] [Google Scholar]
- 45.Sugita Y., Okamoto Y. Replica-exchange molecular dynamics method for protein folding. Chem. Phys. Lett. 1999;114:141–151. [Google Scholar]
- 46.Kale L., Skeel R., Schulten K. NAMD2: greater scalability for parallel molecular dynamics. J. Comput. Phys. 1999;151:283–312. [Google Scholar]
- 47.Frishman D., Argos P. Knowledge-based protein secondary structure assignment. Proteins. 1995;23:566–579. doi: 10.1002/prot.340230412. [DOI] [PubMed] [Google Scholar]
- 48.Kabsch W., Sander C. Dictionary of protein secondary structure: pattern recognition of hydrogen-bonded and geometrical features. Biopolymers. 1983;22:2577–2637. doi: 10.1002/bip.360221211. [DOI] [PubMed] [Google Scholar]
- 49.Humphrey W., Dalke A., Schulten K. VMD: visual molecular dynamics. J. Mol. Graph. 1996;14:27–38. doi: 10.1016/0263-7855(96)00018-5. [DOI] [PubMed] [Google Scholar]
- 50.Rose G.D., Geselowitz A.R., Zehfus M.H. Hydrophobicity of amino acid residues in globular proteins. Science. 1985;229:834–838. doi: 10.1126/science.4023714. [DOI] [PubMed] [Google Scholar]
- 51.Ferrenberg A.M., Swendsen R.H. Optimized Monte Carlo data analysis. Phys. Rev. Lett. 1989;63:1195–1198. doi: 10.1103/PhysRevLett.63.1195. [DOI] [PubMed] [Google Scholar]
- 52.Kyte J., Doolittle R.F. A simple method for displaying the hydropathic character of a protein. J. Mol. Biol. 1982;157:105–132. doi: 10.1016/0022-2836(82)90515-0. [DOI] [PubMed] [Google Scholar]
- 53.Eisenberg D., Schwarz E., Wall R. Analysis of membrane and surface protein sequences with the hydrophobic moment plot. J. Mol. Biol. 1984;179:125–142. doi: 10.1016/0022-2836(84)90309-7. [DOI] [PubMed] [Google Scholar]
- 54.Wu C., Wang Z., Shea J.E. The binding of thioflavin T and its neutral analog BTA-1 to protofibrils of the Alzheimer's disease Aβ(16–22) peptide probed by molecular dynamics simulations. J. Mol. Biol. 2008;384:718–729. doi: 10.1016/j.jmb.2008.09.062. [DOI] [PMC free article] [PubMed] [Google Scholar]
- 55.Sciarretta K.L., Gordon D.J., Meredith S.C. Aβ40-Lactam(D23/K28) models a conformation highly favorable for nucleation of amyloid. Biochemistry. 2005;44:6003–6014. doi: 10.1021/bi0474867. [DOI] [PubMed] [Google Scholar]
- 56.Chen J., Armstrong A.H., Hecht M.H. Small molecule microarrays enable the discovery of compounds that bind the Alzheimer's Aβ peptide and reduce its cytotoxicity. J. Am. Chem. Soc. 2010;132:17015–17022. doi: 10.1021/ja107552s. [DOI] [PMC free article] [PubMed] [Google Scholar]
- 57.Vanommeslaeghe K., Hatcher E., MacKerell A.D., Jr. CHARMM general force field: a force field for drug-like molecules compatible with the CHARMM all-atom additive biological force fields. J. Comput. Chem. 2010;31:671–690. doi: 10.1002/jcc.21367. [DOI] [PMC free article] [PubMed] [Google Scholar]
- 58.Kim S., Takeda T., Klimov D.K. Globular state in the oligomers formed by Aβ peptides. J. Chem. Phys. 2010;132:225101. doi: 10.1063/1.3447894. [DOI] [PMC free article] [PubMed] [Google Scholar]
- 59.Han M., Hansmann U.H.E. Replica exchange molecular dynamics of the thermodynamics of fibril growth of Alzheimer's Aβ42 peptide. J. Chem. Phys. 2011;135:065101. doi: 10.1063/1.3617250. [DOI] [PMC free article] [PubMed] [Google Scholar]
Associated Data
This section collects any data citations, data availability statements, or supplementary materials included in this article.