

Abstract
Background and Purpose
High-level gait disorder (HLGD) is a debilitating disorder causing mobility decline in the elderly. Although its clinical characteristics are well described, its anatomical and pathophysiological underpinnings are poorly understood. This study examined the anatomical distribution of white matter (WM) changes in patients with mild to moderate HLGD of the cautious/disequilibrium type, using advanced magnetic resonance imaging (MRI) methods.
Methods
Thirteen patients with HLGD, 9 elderly and 13 middle-aged healthy controls, were scanned using diffusion tensor imaging, Q-space imaging, and conventional MRI. The regions of significant differences between the HLGD group and the elderly control group were defined, and the mean fractional anisotropy and displacement values of these areas were extracted.
Results
The HLGD patients had lower fractional anisotropy and higher displacement values in regions related to the motor system, including those along the corticospinal tract and the superior cerebellar peduncles, as well as in cognitive and affective-related areas, including the anterior limbs of the internal capsule and the genu of the corpus callosum.
Conclusions
The anatomical distribution associated with HLGD of the cautious/disequilibrium type involves WM pathways that convey motor-related, cognitive and affective-related functions. The underlying pathological process leading to these changes most probably includes demyelination.
INTRODUCTION
Gait impairment is a major cause of functional and mobility decline. In 15-30% of adults diagnosed with gait impairment, the etiology is unclear, and limitations in mobility tasks lead other findings on detailed neurological examinations.1,2 Such cases are usually classified as high-level gait disorder (HLGD).3,4 The cautious/disequilibrium type is one of the most common types of HLGD.4 These patients characteristically walk slowly, are fearful of falling, and their neurological findings reveal abnormal postural responses, mild extrapyramidal signs, and frontal release signs, as well as some dysexecutive syndrome.5,6
Both the anatomical and the pathophysiological nature of HLGD are poorly understood. Several groups have used conventional magnetic resonance imaging (MRI) to search for brain abnormalities in patients with HLGD.7-14 The findings of these studies suggest that white matter (WM) changes may be an important cause of this gait impairment. The most common radiological parameter associated with HLGD using conventional MRI is the severity of white matter hyperintensity (WMH), which is usually found to be most pronounced in the periventricular zone.10,13 Furthermore, enlargement of the lateral and third ventricles has been correlated with the presence of gait impairment in the elderly.10,12,15 Conventional MRI studies have also reported associations between HLGD and small vessel disease. Since WMH is associated with microangiopathy,16,17 HLGD has been considered to be a consequence of vasculopathy and atherosclerosis of the small vessels.18,19 It should be noted, however, that even though changes in WM have been previously reported, their anatomical localization in the context of WM pathways has not been specifically documented, and only gross, semi-quantitative measures have been applied thus far.
Therefore, the current exploratory study was aimed to detect the specific anatomical distribution of WM pathway changes among patients with cautious/disequilibrium type HLGD, using diffusion tensor imaging (DTI) and Q-space imaging (QSI). DTI 20,21 and QSI 22,23 are MRI techniques that address the limitations of conventional MRI sequences. Both methods are highly sensitive to WM microstructure and allow for quantification and pathological characterization of damage to WM.24,25 The use of these quantitative techniques may help to map the anatomical changes related to HLGD and to better understand the pathology underlying this enigmatic gait disorder.
METHODS
Subjects
Patients who met the clinical diagnostic criteria for HLGD of the cautious/disequilibrium type and who were attending the Gait and Falls Prevention Clinic of the Movement Disorders Unit at the Tel-Aviv Sourasky Medical Center were invited to participate in this study. They were all diagnosed by an experienced neurologist who specializes in gait disturbances of the elderly (NG), using previously established criteria.4-6 The major diagnostic criteria included: cautious gait with reduced mobility; significant fear of falling, as indicated by the Activities-specific Balance Confidence (ABC) Scale; and abnormal postural responses, as indicated by the pull test. Secondary features were mild extrapyramidal signs and frontal release signs. Exclusion criteria were the inability to walk independently; the presence of any other neurological disease (e.g., history of clinical stroke, Parkinson’s disease, significant head trauma, major depression based on DSMIV criteria, dementia based on DSMIV criteria, exposure to dopamine-receptor blocking drugs, and clinically significant visual or vestibular disturbances); or the presence of any other medical condition that could directly affect gait. We took an especially careful approach with regard to the possibility that a patient might have normal pressure hydrocephalus (NPH), and subjects were included only if NPH was clinically excluded. Thirteen elderly patients met the study inclusion criteria and provided informed consent to participate in the study.
Two groups of self-declared healthy subjects were recruited to serve as controls: 9 elderly and 13 middle-aged adults. The middle-aged adults were recruited to control for the effects of aging. The elderly controls were screened for the exclusion of gait abnormalities by neurologists who are experienced in gait disturbances of the elderly (NG or YB). All subjects underwent a regular MRI, as well as DTI and QSI (high-b value DWI), altogether in one session. The institutional review board committee of the hospital approved the study protocol, and subjects signed a written informed consent prior to undergoing the clinical and MRI assessments.
MRI Protocol
The MRI was performed on a 3T scanner (GE, Milwaukee, USA). The imaging protocol consisted of axial T1 weighted (TR/TE=500/14 ms, slice thickness/gap=4/0 mm); axial T2 weighted (TR/TE=5000/92 ms, slice thickness/gap=5/1 mm); and axial FLAIR (TR/TE=10000/165 ms, slice thickness/gap=5/1 mm) images, as well as DTI and QSI. All images were acquired in the anterior commissure and posterior commissure plane orientation.
DTI images were acquired with a spin-echo echo planar imaging (EPI) sequence, with 48 slices of 2.5 mm thickness, a resolution of 2.5×2.5×2.5 mm3, and a field of view (FOV) of 20 cm2. The images were acquired with a b-value of 1000 s/mm2, measured at 15 gradient directions plus one repetition with no diffusion weighting. The following parameters were used: TR>10000 ms; TE=98 ms; and Δ/δ=31/25 ms (where Δ is the diffusion time and δ is the diffusion gradient length).
The high b-value DWI data set of QSI was acquired using a spin-echo diffusion-weighted EPI sequence, with eight axial slices of 5 mm covering the frontal, temporal, and occipital lobes. The resolution was 3×3×5 mm3, and the FOV was 20 cm2. The following parameters were used: TR>3200 ms; TE=166ms; and Δ/δ=57/51ms. The diffusion gradients were applied in six gradient directions [xy; xz; yz; (−x)y; (−x)z; and y(−z)]. The magnitude of the gradients was incremented linearly from 0 to 4 G/cm to reach a maximal b-value of 12,000 s/mm2.
Image Analysis
The visual rating scale of Fazekas26 was applied to assess WMH using a conventional imaging approach. The Fazekas scale accounts for periventricular changes (PVCs) and deep WM changes (DWMCs) separately. For DWMCs, it separately accounts for the number and the extent of the lesions. Each item is rated on a scale of 0-3, where 0 = no lesion and 3 = major changes. The Fazekas scale is also used to rate the severity of age-related WM changes (ARWMCs).27 Ratings were determined on the FLAIR images. An experienced neuroradiologist blinded to the group assignment performed all of the ratings, as well as visual detection of any brain lesions.
For the DTI analysis, the DTI scans were first realigned using SPM2 software (2003, FIL, UCL, London, UK) for motion correction. They were then analyzed using in-house Matlab scripts (MathWorks, Natick, Massachusetts, USA) according to a procedure described by Basser and Pierpaoli.21 Voxel-based maps of the fractional anisotropy (FA) were produced for each subject.
For the QSI analysis, the Q-space approach was used to analyze the high b-value data, as previously described.23 In general, the QSI data set provides a measure of apparent displacement of water molecules. This measure is extracted from the Fourier transformation of the signal decay (after zero filling) to produce the displacement distribution function. The apparent displacement represents the full width at half maximum of the displacement distribution function. Previous work indicates that this parameter is indicative of the axonal microstructure integrity.28,29
To perform the analysis at the group level, all images (FA and displacement maps) were spatially normalized to a standard anatomical template (Montreal Neurological Institute, Montreal, Canada) and then smoothed with an 8 mm Gaussian kernel. These procedures were performed using SPM2 software. Fig. 1 shows the data set for a representative HLGD subject, including the DTI FA image and the QSI displacement image for one representative slice.
FIG. 1.
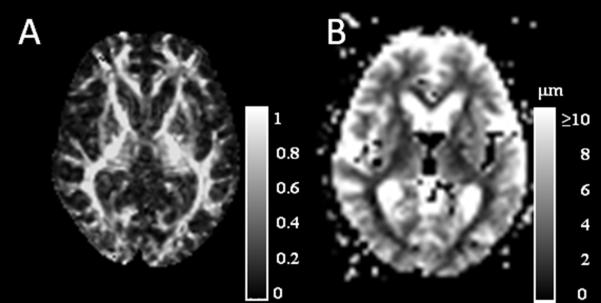
A data set for an HLGD subject (female, age 79), including DTI FA image (A) and Q-space displacement image (B).
FA and Displacement Analysis
FA and displacement analysis was performed in three stages: 1) generation of statistical parametric maps at the group level; 2) generation of regions of interest (ROIs); and 3) extraction of individual FA and displacement values. In the first stage, normalized and smoothed FA and displacement images of the HLGD group and the elderly control group were tested with two sample t-tests in order to generate statistical parametric maps for the contrasts of HLGD<elderly controls for the FA and HLGD>elderly controls for the displacement parameters. The statistical thresholds were set at P-uncorrected <0.001 for FA and P-uncorrected <0.01 for displacement. Different statistical thresholds were chosen because differences in the signal-to-noise ratio for each method resulted in different variances.
In the second stage, the statistical parametric maps were used to guide the ROI selection. Sphere ROIs with a 4-mm radius were generated in regions that passed the statistical threshold on the statistical parametric maps obtained for each parameter. Regions of gray matter in the frontal lobe were not represented, since they contain mainly gray matter and were previously reported to be related to age-related decline in gait, as described in the Introduction. These procedures resulted in two sets of ROIs: FA-based ROIs and displacement-based ROIs. The FA-based ROIs included: the left and right anterior limbs of the internal capsule (LALIC and RALIC); the left and right cerebral peduncles (LCP and RCP); and the left and right superior cerebellar peduncles (LSCP and RSCP) (Fig. 2A). The displacement-based ROIs included: the left and right posterior limbs of the internal capsule (LPLIC and RPLIC); the LALIC and RALIC; the genu of the left corpus callosum (LCCG); and the left and right ventral thalami (Fig. 2B). It should be noted that the QSI data set was acquired with eight 5 mm axial slices that covered the frontal, temporal, and occipital lobes only at the level of the internal capsule.
FIG. 2.

Statistical maps indicating areas of statistically significant differences between the high-level gait disorder (HLGD) group and the elderly control group in the fractional anisotropy (FA) parameter (Puncorrected < 0.001, color bars represent T score) (A) and the displacement parameter (Puncorrected < 0.01, color bars represent T score) (B). The white circles indicate decreased FA (A) and increased displacement (B).
In the third stage, the mean values of the measured parameters (FA and displacement) were extracted from the normalized images of each subject for every ROI and then averaged over the whole group. The ROIs of the cerebral peduncles and the superior cerebellar peduncles were defined manually due to normalization inaccuracy. All of these procedures were carried out using SPM2 software.
Statistics
To test for differences between the groups on the Fazekas scale scores, Kruskal-Wallis tests were performed, followed by Mann-Whitney tests for post-hoc comparisons. The threshold for statistical significance in this analysis was set at P<0.02 after Bonferroni correction for multiple comparisons. To test the group effect for the FA and displacement parameters, two multivariate analyses of variance (MANOVA) were performed with group as the independent variable. The dependent variables were the FA values on each of the FA-based ROIs or the displacement values on each of the displacement-based ROIs. This was followed up, when appropriate, by univariate ANOVA and post-hoc analysis, using Tukey’s honestly significant difference (HSD) procedure. The threshold for statistical significance in the univariate and post-hoc analyses was set at p<0.01 after Bonferroni correction for multiple comparisons. The statistical analysis was performed with SPSS version 18.0 (SPSS Inc., Chicago IL).
RESULTS
The 13 elderly subjects (8 females and 5 males) with mild to moderate HLGD of the cautious/disequilibrium type who met the study inclusion criteria had a mean age of 76.5±3.6 years. At the time of recruitment, they were all living in the community and were being seen for the first time in the Gait and Falls Prevention Clinic. Table 1 summarizes the demographic and clinical characteristics of the subjects. Their data were compared to those of the two healthy control groups, one comprised of 9 elderly adults (6 females and 3 males) with a mean age of 74.8±4.6 years, and the other of 13 middle-aged adults (9 females and 4 males) with a mean age of 46.7±8.8 years.
Table 1.
Demographic and clinical characteristics of HLGD subjects
| Gender | Age (years) |
Duration (years) |
Recurrent (≤2) Falls |
Clinical features | Extrapyramidal symptoms |
Medication to improve gait |
Physiotherapy | Walking aids |
Depressive disorder |
Cognitive decline |
|---|---|---|---|---|---|---|---|---|---|---|
| M | 79 | 2 | Yes | Arm tremor, disequilibrium, ataxia |
No | No | Yes | No | Mild | Mild |
| M | 80 | 3 | Yes | Frontal signs, orthostatism | Yes | Amantadine | Yes | No | Mild | Mild |
| F | 81 | 2 | Yes | Cautious gait, urge to have support |
No | No | Yes | No | Mild | No |
| M | 76 | 3 | No | Cautious gait, urge to have support |
No | No | Yes | No | Mild | Mild |
| M | 76 | 2 | Yes | Arm tremors, cautious gait, urge to have support |
No | Prysoline | Yes | No | No | Moderate (rivastigmine) |
| M | 80 | 6 | Yes | Shuffling gait, FOG, campto- cormia |
Yes | Rasagiline | Yes | Walker | No | No |
| F | 73 | 2-3 | No | Small steps, awkward gait, fear of falls |
No | No | Yes | No | No | No |
| F | 78 | 1 | Yes | Cautious gait | No | No | Yes | No | Yes | No |
| F | 80 | 1 | Yes | Hypomimia, leg bradykinesia, postural instability, FOG |
Yes | Levodopa 125 tid |
Yes | No | No | No |
| F | 77 | 5 | Yes | Bradykinesia, shuffling gait | Yes | No | Yes | No | Yes | Memantine |
| F | 82 | 1 | Yes | Cautious gait, postural instability, suspected VB- CVA |
No | No | Yes | No | Yes | No |
| F | 79 | 1 | Yes | Short steps, festination, postural instability |
No | No | Yes | No | Yes | No |
| F | 67 | 1 | No | Cautious gait, bradykinesia, axial rigidity, lack of right arm swinging |
Yes | No | Yes | No | Yes | No |
M: Male; F: Female; FOG: Freezing of gate; VB-CVA: vertebra-basilar cerebrovascular accident
The mean rates and statistical between-group comparisons of the visual WMH ratings are presented in Table 2. There were no significant differences between the HLGD group and the elderly control group for any of the items on the Fazekas scale. The group of middle-aged adults demonstrated significantly better rates on all items as compared to the other two groups, consistent with the presence of age-associated changes in WMH for both older groups. No subjects presented with imaging findings suggestive of a stroke.
Table 2.
Rating of each item on the visual rating scale of Fazekas (mean ± standard deviation) for the high-level gait disorder (HLGD) group, the elderly control group, and the middle-aged control group
| DWMC number | DWMC extent | PVC | |
|---|---|---|---|
| HLGD | 2.46±0.97 | 1.38±0.77 | 1.77±1.24 |
| Elderly controls | 2.33±1 | 0.89±0.33 | 1±0.87 |
| Middle-aged adults | 0.36±0.92 | 0.18±0.4 | 0.00 |
|
P-value HLGD vs. elderly controls |
P = 0.61 | P = 0.074 | P = 0.144 |
|
P-value HLGD vs. middle-aged adults |
P < 0.001 | P < 0.001 | P = 0.001 |
|
P-value elderly controls vs. middle-aged adults |
P < 0.001 | P = 0.002 | P = 0.002 |
DWMC: deep white matter changes; PVC: periventricular changes
The ROIs were defined for each parameter as described in the Methods section (see Fig. 2 and Table 3). In addition to region-specific ROIs, the statistical parametric map of the FA parameter showed an FA reduction in widespread areas of the frontal lobe and ventricle margins in the HLGD group. FA-based and displacement-based analyses were carried out on all the specified ROIs. MANOVA analyses showed significant group effects for the FA parameter (F(12,54)=11.15, p<0.001) and the displacement parameter (F(14,52)=3.7, p<0.001).
Table 3.
Montreal Neurological Institute (MNI) coordinates of the regions of interest (ROIs)
| ROIs | MNI [x y z] |
|---|---|
| FA-based | |
| Internal capsule- anterior limbs | −18 16 6 |
| Cerebral peduncles | Extracted individually |
| Superior cerebellar peduncles | Extracted individually |
|
| |
| Displacement-based | |
| Internal capsule- posterior limbs | −18 −10 12 |
| Internal capsule- anterior limbs | −20 0 16 |
| Corpus callosum- genu | −16 34 4 |
| Thalamus | −14 −16 0 |
Note: MNI coordinates point to the left hemisphere; the right hemisphere ROIs were located exactly opposite. ROIs of cerebral peduncles and superior cerebellar peduncles were defined manually for each subject due to normalization inaccuracy.
Post-hoc Tukey’s HSD tests for the FA parameter showed that mean FA values were significantly lower for the HLGD group than for the elderly controls on all the ROIs, except for the LALIC (P < 0.001 for RALIC, RSCP, LCP, and RCP; P = 0.002 for LSCP) and two of the ROIs for the HLGD group (P < 0.001 for RALIC and LCP). The elderly controls had significantly higher mean FA values on the RCP (P = 0.001). Fig. 3A depicts the mean FA values on each of the ROIs for the three groups.
FIG. 3.

Fractional anisotropy (FA) (A) and displacement (B) values (mean ± standard deviation) of the high-level gait disorder (HLGD) group (black bars), the elderly control group (gray bars), and the middle-aged adults control group (dotted bars) on the selected regions of interest (ROIs). P values are presented for the comparison between HLGD versus elderly controls. LALIC: left anterior limb of internal capsule; RALIC: right anterior limb of internal capsule; LCP: left cerebral peduncle; RCP: right cerebral peduncle; LSCP: left superior cerebellar peduncle; RSCP: right superior cerebellar peduncle; LPLIC: left posterior limb of internal capsule; RPLIC: right posterior limb of internal capsule; LCCG: left corpus callosum genu
Post-hoc Tukey’s HSD tests for the displacement parameter showed that the HLGD group had significantly higher mean displacement values on all the ROIs than did the elderly controls (P = 0.001 for RALIC and L thalamus; P= 0.002 for LPLIC; and P < 0.001 for all the other ROIs) or the middle-aged adults (P = 0.001 for L thalamus; P < 0.001 for all the other ROIs). There were no significant differences found between the elderly controls and the middle-aged adults. Fig. 3B depicts the mean displacement values on each of the ROIs for the three groups.
DISCUSSION
In the present study, we used DTI and QSI methods to investigate the anatomical distribution of WM changes in patients with HLGD. In addition to supporting previous studies demonstrating an association between WM changes and HLGD, 7,9,11,13,14 the MRI methods applied here were able to detect the involvement of specific WM pathways that have not been previously reported. Our findings suggest the involvement of specific motor-related pathways, including the corticospinal tract (i.e., the posterior limbs of the internal capsule and the cerebral peduncles) and the superior cerebellar peduncles (SCP), in this disorder. In addition, cognitive and affective-related WM pathways, namely, the anterior limbs of the internal capsule (ALIC) and the genu of the corpus callosum, were identified as being altered among the HLGD patients.
Moreover, to the best of our knowledge, the present findings provide the first imaging evidence to suggest that demyelination plays a role in the pathogenesis of HLGD. The finding of an association between HLGD and alteration in FA and displacement values in specific brain regions, as indicated by the results of the comparison between the HLGD group and the elderly controls, is further supported by the results of the comparison between the elderly controls and the middle-aged adults. We found no differences between these groups for either FA or displacement-based ROIs, except for the RCP in which the FA values were higher for the elderly controls.
It is reasonable to assume that a lesion of the corticospinal tract can lead to gait impairments, but it is of interest that mild pyramidal signs are not rare in this group of patients.6,30 The involvement of the superior cerebellar peduncles (SCP) suggests that cerebellar dysfunction may actually have a role in HLGD, though cerebellar signs (e.g., dysdiadochokinesis and dysmetria) were previously considered as exclusion criteria for the diagnosis of HLGD.6 The SCP consist primarily of efferent fibers that terminate on the motor nuclei of the thalamus31 and play a part in the cerebellar control of movement. The involvement of the ventral part of the thalamus is consistent with the involvement of the SCP, since this area of the thalamus mediates motor functions and relays information originating in the cerebellum to the motor cortex.31
Interestingly, we also found involvement of the ALIC and LCCG in HLGD. Age-related degradation of the ALIC was previously reported and was found to be correlated with performance of an executive function task.32 ALIC conveys a major part of the prefrontal and anterior cingulate interaction with the thalamus and also brings prefrontal input to the cerebrocerebellar system.33,34 The genu of the corpus callosum consists of fibers interconnecting the prefrontal cortices.35 Atrophy of this region has been shown to be associated with impairment in attention and executive functions 36 and with psychomotor slowing.37 Given these connections, our findings point to the involvement of areas related to the modulation of executive and affective functions in HLGD.38,39 These anatomical findings are supported by behavioral studies showing motor and cognitive-frontal dysfunctions in individuals with HLGD.6,40
It should be noted that HLGD is classically defined as being present when gait impairment cannot be explained by signs related to lesions of the middle or lower levels of the nervous system.2 However, this exclusion criterion is based on clinical testing or standard imaging methods that are limited in the ability to detect structural impairments. Using advanced imaging methods increases the ability to specifically detect changes in WM tracts, even in the absence of significant clinical signs. Our findings suggest that the combination of brain pathology at the middle and higher levels results in the clinical presentation of HLGD.
We also found widespread FA reduction in frontal areas and in ventricle margins in the HLGD group (see Fig. 2A). Similar changes were previously reported to be associated with normal aging and gait disturbances of the elderly.41 It is not yet clear whether this finding suggests an acceleration of the normal aging process in individuals with HLGD or whether it is a result of distinctive mechanisms related to HLGD. Regardless of the exact explanation, FA reduction in frontal areas and in ventricle margins appears to be more exaggerated in the HLGD group than it is in normal aging. Changes in these areas could further contribute to the cognitive-frontal dysfunction known to be associated with HLGD.40
Both the HLGD group and the elderly controls had significantly higher WMH than the middle-aged adults. However, this feature did not significantly differentiate the HLGD group and the elderly controls, who scored similarly on the Fazekas scale. We suggest two alternative interpretations of this finding. One is that it does not support previous propositions19,18 about vascular microangiopathy involvement in the pathophysiology of HLGD. WMH is the main variable to support these propositions, and it shows no differences between HLGD patients and the healthy elderly. This is in line with our earlier report of no significant differences between HLGD patients and healthy age-matched controls in vascular risk factors and vascular-related imaging findings.6
A second interpretation could be that in individuals with HLGD, the presence of pre-morbid WMH develops into more severe secondary WM lesions. Hence, while both groups had similar degrees of WMH, the HLGD patients had significantly lower FA and higher displacement in the above-mentioned areas. It should also be kept in mind that visual rating scales of WMH were previously reported to have low sensitivity in differentiating between clinical groups.42,43 As such, it might be that in the current study, the two elderly groups were not found to be significantly different due to the low sensitivity of the measurement tool.
DTI and QSI methods provide information about the underlying pathological changes that occur in WM. The degree of anisotropic diffusion, as measured by the FA parameter, is related to the directionality and integrity of WM fiber tracts44,45 and is reduced considerably when the WM is damaged.24 Thus, a reduction in FA may be an indicator of degenerative processes taking place in those areas. The cellular correlates of DTI parameters are not straightforward in healthy tissues and are even more unspecific in pathological ones. Usually, FA decreases can be related to several types of pathological processes.46 Some distinctions have been made by analyzing the radial and axial diffusivity and relating them to changes in myelination and neurofilament condition.47-49
In the current work, however, we used QSI, which is heavily related to myelin.50-52 The utility of QSI has been previously demonstrated in several brain conditions, including vascular dementia53 and multiple sclerosis.50 QSI is also reported to have greater sensitivity to myelin deficiency than DTI.54 Therefore, taken together with the DTI observations, the increases in water displacement demonstrated in this study in patients diagnosed with HLGD appear to be related to demyelination. This finding provides data for testable hypotheses about the origins and possible treatment of HLGD. It should also be noted that in the posterior limbs of the internal capsule, the differences between the HLGD group and the elderly controls were found only for the displacement parameter. This might be due to greater sensitivity of the QSI method to compartments of highly restricted diffusion.
Our study has several limitations that limit the interpretation of our findings. The sample size was small, hence limiting our analysis of the DTI and QSI images and our ability to generalize the findings. Thus, additional larger scale studies and detailed neuropathological assessments are needed to confirm these findings. Although we performed ROI analysis, which provides some level of correction for multiple comparisons, a larger sample size would allow for the use of a more conservative statistical threshold.
In addition, despite the fact that the diagnosis of individuals with HLGD was based on the clinical expertise of the neurologists in this study, the process did not include detailed quantitative clinical measures of motor and cognitive functions. Correlations between clinical and MRI findings, potentially an important source of information, were not performed due to lack of quantitative clinical measures. Despite these limitations, our novel findings demonstrate important associations between changes in specific WM pathways and HLGD and support the possibility of a pathophysiological explanation for those changes. As such, we believe that the present findings set the stage for future larger scale studies in this important area.
Footnotes
Financial Disclosure/Conflict of Interest: The authors have no conflict of interest related to this manuscript.
REFERENCES
- 1.Sudarsky L. Gait disorders: prevalence, morbidity, and etiology. Adv Neurol. 2001;87:111–117. [PubMed] [Google Scholar]
- 2.Thompson PD, Nutt JG. Higher level gait disorders. J Neural Transm. 2007;114:1305–1307. doi: 10.1007/s00702-007-0749-x. [DOI] [PubMed] [Google Scholar]
- 3.Snijders AH, van de Warrenburg BP, Giladi N, Bloem BR. Neurological gait disorders in elderly people: clinical approach and classification. Lancet Neurol. 2007;6:63–74. doi: 10.1016/S1474-4422(06)70678-0. [DOI] [PubMed] [Google Scholar]
- 4.Nutt J, Marsden C, Thompson P. Human walking and higher-level gait disorders, particularly in the elderly. Neurology. 1993;43:268–279. doi: 10.1212/wnl.43.2.268. [DOI] [PubMed] [Google Scholar]
- 5.Herman T, Giladi N, Gurevich T, Hausdorff JM. Gait instability and fractal dynamics of older adults with a "cautious" gait: why do certain older adults walk fearfully? Gait Posture. 2005;21:178–185. doi: 10.1016/j.gaitpost.2004.01.014. [DOI] [PubMed] [Google Scholar]
- 6.Giladi N, Herman T, Reider-Groswasser I, Gurevich T, Hausdorff J. Clinical characteristics of elderly patients with a cautious gait of unknown origin. J Neurol. 2005;252:300–306. doi: 10.1007/s00415-005-0641-2. [DOI] [PubMed] [Google Scholar]
- 7.Franch O, Calandre L, Alvarez-Linera J, Louis ED, Bermejo-Pareja F, Benito-Leon J. Gait disorders of unknown cause in the elderly: Clinical and MRI findings. J Neurol Sci. 2009;280:84–86. doi: 10.1016/j.jns.2009.02.001. [DOI] [PubMed] [Google Scholar]
- 8.Baloh R, Vinters H. White matter lesions and disequilibrium in older people. II. Clinicopathologic correlation. Arch Neurol. 1995;52:975–981. doi: 10.1001/archneur.1995.00540340067014. [DOI] [PubMed] [Google Scholar]
- 9.Benson R, Guttmann C, Wei X, et al. Older people with impaired mobility have specific loci of periventricular abnormality on MRI. Neurology. 2002;58:48–55. doi: 10.1212/wnl.58.1.48. [DOI] [PubMed] [Google Scholar]
- 10.Camicioli R, Moore M, Sexton G, Howieson D, Kaye J. Age-related brain changes associated with motor function in healthy older people. J Am Geriatr Soc. 1999;47:330–334. doi: 10.1111/j.1532-5415.1999.tb02997.x. [DOI] [PubMed] [Google Scholar]
- 11.Guttmann C, Benson R, Warfield S, et al. White matter abnormalities in mobility-impaired older persons. Neurology. 2000;54:1277–1283. doi: 10.1212/wnl.54.6.1277. [DOI] [PubMed] [Google Scholar]
- 12.Whitman G, DiPatre P, Lopez I, et al. Neuropathology in older people with disequilibrium of unknown cause. Neurology. 1999;53:375–382. doi: 10.1212/wnl.53.2.375. [DOI] [PubMed] [Google Scholar]
- 13.Whitman G, Tang Y, Lin A, Baloh R, Tang T. A prospective study of cerebral white matter abnormalities in older people with gait dysfunction. Neurology. 2001;57:990–994. doi: 10.1212/wnl.57.6.990. [DOI] [PubMed] [Google Scholar]
- 14.Wolfson L, Wei X, Hall C, et al. Accrual of MRI white matter abnormalities in elderly with normal and impaired mobility. J Neurol Sci. 2005;232:23–27. doi: 10.1016/j.jns.2004.12.017. [DOI] [PubMed] [Google Scholar]
- 15.Tell G, Lefkowitz D, Diehr P, Elster A. Relationship between balance and abnormalities in cerebral magnetic resonance imaging in older adults. Arch Neurol. 1998;55:73–79. doi: 10.1001/archneur.55.1.73. [DOI] [PubMed] [Google Scholar]
- 16.Pantoni L. Cerebral small vessel disease: from pathogenesis and clinical characteristics to therapeutic challenges. Lancet Neurol. 2010;9:689–701. doi: 10.1016/S1474-4422(10)70104-6. [DOI] [PubMed] [Google Scholar]
- 17.Zhang AJ, Yu XJ, Wang M. The clinical manifestations and pathophysiology of cerebral small vessel disease. Neurosci Bull. 2010;26:257–264. doi: 10.1007/s12264-010-1210-y. [DOI] [PMC free article] [PubMed] [Google Scholar]
- 18.Martin MP, O’Neill D. Vascular higher-level gait disorders--a step in the right direction? Lancet. 2004;363:8. doi: 10.1016/S0140-6736(03)15246-4. [DOI] [PubMed] [Google Scholar]
- 19.Liston R, Mickelborough J, Bene J, Tallis R. A new classification of higher level gait disorders in patients with cerebral multi-infarct states. Age Ageing. 2003;32:252–258. doi: 10.1093/ageing/32.3.252. [DOI] [PubMed] [Google Scholar]
- 20.Basser PJ, Pierpaoli C. Microstructural and physiological features of tissues elucidated by quantitative-diffusion-tensor MRI. J Magn Reson B. 1996;111:209–219. doi: 10.1006/jmrb.1996.0086. [DOI] [PubMed] [Google Scholar]
- 21.Basser PJ, Pierpaoli C. A simplified method to measure the diffusion tensor from seven MR images. Magn Reson Med. 1998;39:928–934. doi: 10.1002/mrm.1910390610. [DOI] [PubMed] [Google Scholar]
- 22.Assaf Y, Cohen Y. Assignment of the water slow-diffusing component in the central nervous system using q-space diffusion MRS: implications for fiber tract imaging. Magn Reson Med. 2000;43:191–199. doi: 10.1002/(sici)1522-2594(200002)43:2<191::aid-mrm5>3.0.co;2-b. [DOI] [PubMed] [Google Scholar]
- 23.Assaf Y, Mayk A, Cohen Y. Displacement imaging of spinal cord using q-space diffusion-weighted MRI. Magn Reson Med. 2000;44:713–722. doi: 10.1002/1522-2594(200011)44:5<713::aid-mrm9>3.0.co;2-6. [DOI] [PubMed] [Google Scholar]
- 24.Horsfield MA, Jones DK. Applications of diffusion-weighted and diffusion tensor MRI to white matter diseases - a review. NMR Biomed. 2002;15:570–577. doi: 10.1002/nbm.787. [DOI] [PubMed] [Google Scholar]
- 25.O’Sullivan M, Morris RG, Huckstep B, Jones DK, Williams SC, Markus HS. Diffusion tensor MRI correlates with executive dysfunction in patients with ischaemic leukoaraiosis. J Neurol Neurosurg Psychiatry. 2004;75:441–447. doi: 10.1136/jnnp.2003.014910. [DOI] [PMC free article] [PubMed] [Google Scholar]
- 26.Fazekas F, Chawluk JB, Alavi A, Hurtig HI, Zimmerman RA. MR signal abnormalities at 1.5 T in Alzheimer’s dementia and normal aging. Am J Roentgenol. 1987;149:351–356. doi: 10.2214/ajr.149.2.351. [DOI] [PubMed] [Google Scholar]
- 27.Pantoni L, Basile AM, Pracucci G, et al. Impact of age-related cerebral white matter changes on the transition to disability -- the LADIS study: rationale, design and methodology. Neuroepidemiology. 2005;24:51–62. doi: 10.1159/000081050. [DOI] [PubMed] [Google Scholar]
- 28.Assaf Y, Mayk A, Eliash S, Speiser Z, Cohen Y. Hypertension and neuronal degeneration in excised rat spinal cord studied by high-b value q-space diffusion magnetic resonance imaging. Exp Neurol. 2003;184:726–736. doi: 10.1016/S0014-4886(03)00274-7. [DOI] [PubMed] [Google Scholar]
- 29.Assaf Y, Kafri M, Shinar H, et al. Changes in axonal morphology in experimental autoimmune neuritis as studied by high b-value q-space (1)H and (2)H DQF diffusion magnetic resonance spectroscopy. Magn Reson Med. 2002;48:71–81. doi: 10.1002/mrm.10183. [DOI] [PubMed] [Google Scholar]
- 30.Huber-Mahlin V, Giladi N, Herman T, Perez C, Gurevich T, Hausdorff JM. Progressive nature of a higher level gait disorder: a 3-year prospective study. J Neurol. 2010;257:1279–1286. doi: 10.1007/s00415-010-5507-6. [DOI] [PubMed] [Google Scholar]
- 31.Kandel ER, Schwartz JH, Jessell TM. Principles of neural science. 4th ed McGraw-Hill, Health Professions Division; New York: 2000. [Google Scholar]
- 32.Sullivan EV, Zahr NM, Rohlfing T, Pfefferbaum A. Fiber tracking functionally distinct components of the internal capsule. Neuropsychologia. 2010;48:4155–4163. doi: 10.1016/j.neuropsychologia.2010.10.023. [DOI] [PMC free article] [PubMed] [Google Scholar]
- 33.Schmahmann JD. Vascular syndromes of the thalamus. Stroke. 2003;34:2264–2278. doi: 10.1161/01.STR.0000087786.38997.9E. [DOI] [PubMed] [Google Scholar]
- 34.Schmahmann JD, Pandya DN. Disconnection syndromes of basal ganglia, thalamus, and cerebrocerebellar systems. Cortex. 2008;44:1037–1066. doi: 10.1016/j.cortex.2008.04.004. [DOI] [PMC free article] [PubMed] [Google Scholar]
- 35.Chao YP, Cho KH, Yeh CH, Chou KH, Chen JH, Lin CP. Probabilistic topography of human corpus callosum using cytoarchitectural parcellation and high angular resolution diffusion imaging tractography. Hum Brain Mapp. 2009;30:3172–3187. doi: 10.1002/hbm.20739. [DOI] [PMC free article] [PubMed] [Google Scholar]
- 36.Jokinen H, Ryberg C, Kalska H, et al. Corpus callosum atrophy is associated with mental slowing and executive deficits in subjects with age-related white matter hyperintensities: the LADIS Study. J Neurol Neurosurg Psychiatry. 2007;78:491–496. doi: 10.1136/jnnp.2006.096792. [DOI] [PMC free article] [PubMed] [Google Scholar]
- 37.Jokinen H, Frederiksen KS, Garde E, et al. Callosal tissue loss parallels subtle decline in psychomotor speed. A longitudinal quantitative MRI study. The LADIS Study. Neuropsychologia. doi: 10.1016/j.neuropsychologia.2012.03.020. published online ahead of print April 2012. [DOI] [PubMed] [Google Scholar]
- 38.Schmahmann JD. From movement to thought: anatomic substrates of the cerebellar contribution to cognitive processing. Hum Brain Mapp. 1996;4:174–198. doi: 10.1002/(SICI)1097-0193(1996)4:3<174::AID-HBM3>3.0.CO;2-0. [DOI] [PubMed] [Google Scholar]
- 39.Schmahmann JD, Pandya DN. The cerebrocerebellar system. Int Rev Neurobiol. 1997;41:31–60. doi: 10.1016/s0074-7742(08)60346-3. [DOI] [PubMed] [Google Scholar]
- 40.Giladi N, Huber-Mahlin V, Herman T, Hausdorff JM. Freezing of gait in older adults with high level gait disorders: association with impaired executive function. J Neural Transm. 2007;114:1349–1353. doi: 10.1007/s00702-007-0772-y. [DOI] [PubMed] [Google Scholar]
- 41.Seidler RD, Bernard JA, Burutolu TB, et al. Motor control and aging: links to age-related brain structural, functional, and biochemical effects. Neurosci Biobehav Rev. 2010;34:721–733. doi: 10.1016/j.neubiorev.2009.10.005. [DOI] [PMC free article] [PubMed] [Google Scholar]
- 42.van den Heuvel DM, ten Dam VH, de Craen AJ, et al. Measuring longitudinal white matter changes: comparison of a visual rating scale with a volumetric measurement. AJNR Am J Neuroradiol. 2006;27:875–878. [PMC free article] [PubMed] [Google Scholar]
- 43.van Straaten EC, Fazekas F, Rostrup E, et al. Impact of white matter hyperintensities scoring method on correlations with clinical data: the LADIS study. Stroke. 2006 Mar;37(3):836–840. doi: 10.1161/01.STR.0000202585.26325.74. [DOI] [PubMed] [Google Scholar]
- 44.Pierpaoli C, Basser PJ. Toward a quantitative assessment of diffusion anisotropy. Magn Reson Med. 1996;36:893–906. doi: 10.1002/mrm.1910360612. [DOI] [PubMed] [Google Scholar]
- 45.Beaulieu C. The basis of anisotropic water diffusion in the nervous system - a technical review. NMR Biomed. 2002;15:435–455. doi: 10.1002/nbm.782. [DOI] [PubMed] [Google Scholar]
- 46.Assaf Y, Pasternak O. Diffusion tensor imaging (DTI)-based white matter mapping in brain research: a review. J Mol Neurosci. 2008;34:51–61. doi: 10.1007/s12031-007-0029-0. [DOI] [PubMed] [Google Scholar]
- 47.Farrell JA, Zhang J, Jones MV, et al. q-space and conventional diffusion imaging of axon and myelin damage in the rat spinal cord after axotomy. Magn Reson Med. 2010;63:1323–1335. doi: 10.1002/mrm.22389. [DOI] [PMC free article] [PubMed] [Google Scholar]
- 48.Klawiter EC, Schmidt RE, Trinkaus K, et al. Radial diffusivity predicts demyelination in ex vivo multiple sclerosis spinal cords. Neuroimage. 2011;55:1454–1460. doi: 10.1016/j.neuroimage.2011.01.007. [DOI] [PMC free article] [PubMed] [Google Scholar]
- 49.Sun SW, Liang HF, Cross AH, Song SK. Evolving Wallerian degeneration after transient retinal ischemia in mice characterized by diffusion tensor imaging. Neuroimage. 2008;40:1–10. doi: 10.1016/j.neuroimage.2007.11.049. [DOI] [PMC free article] [PubMed] [Google Scholar]
- 50.Assaf Y, Ben-Bashat D, Chapman J, et al. High b-value q-space analyzed diffusion-weighted MRI: application to multiple sclerosis. Magn Reson Med. 2002;47:115–126. doi: 10.1002/mrm.10040. [DOI] [PubMed] [Google Scholar]
- 51.Assaf Y, Chapman J, Ben-Bashat D, et al. White matter changes in multiple sclerosis: correlation of q-space diffusion MRI and 1H MRS. Magn Reson Imaging. 2005;23:703–710. doi: 10.1016/j.mri.2005.04.008. [DOI] [PubMed] [Google Scholar]
- 52.Biton IE, Mayk A, Kidron D, Assaf Y, Cohen Y. Improved detectability of experimental allergic encephalomyelitis in excised swine spinal cords by high b-value q-space DWI. Exp Neurol. 2005;195:437–446. doi: 10.1016/j.expneurol.2005.06.011. [DOI] [PubMed] [Google Scholar]
- 53.Assaf Y, Mayzel-Oreg O, Gigi A, et al. High b value q-space-analyzed diffusion MRI in vascular dementia: a preliminary study. J Neurol Sci. 2002;203-204:235–239. doi: 10.1016/s0022-510x(02)00297-6. [DOI] [PubMed] [Google Scholar]
- 54.Bar-Shir A, Duncan ID, Cohen Y. QSI and DTI of excised brains of the myelin-deficient rat. Neuroimage. 2009;48:109–116. doi: 10.1016/j.neuroimage.2009.06.019. [DOI] [PubMed] [Google Scholar]