

Abstract
Fourier-transform infrared imaging (FT-IR) is a well-established modality but requires the acquisition of a spectrum over a large bandwidth, even in cases where only a few spectral features may be of interest. Discrete frequency infrared (DF-IR) methods are now emerging in which a small number of measurements may provide all the analytical information needed. The DF-IR approach is enabled by the development of new sources integrating frequency selection, in particular of tunable, narrow-bandwidth sources with enough power at each wavelength to successfully make absorption measurements. Here, we describe a DF-IR imaging microscope that uses an external cavity quantum cascade laser (QCL) as a source. We present two configurations, one with an uncooled bolometer as a detector and another with a liquid nitrogen cooled Mercury Cadmium Telluride (MCT) detector and compare their performance to a commercial FT-IR imaging instrument. We examine the consequences of the coherent properties of the beam with respect to imaging and compare these observations to simulations. Additionally, we demonstrate that the use of a tunable laser source represents a distinct advantage over broadband sources when using a small aperture (narrower than the wavelength of light) to perform high-quality point mapping. The two advances highlight the potential application areas for these emerging sources in IR microscopy and imaging.
INTRODUCTION
Fourier-transform infrared (FT-IR) spectroscopy is strongly emerging for chemical mapping and imaging1 in a variety of scientific areas2,3,4,5,6 due to technological advances since its commercial inception.7 FT-IR microscopic imaging8 is now well established for fast, spatially-resolved spectroscopy,9 using a combination of multiplexing via rapid-scan interferometry10,11 and multichannel detection via array detectors. The development of multiple-element linear and faster 2D array detectors has been the principal driving force for improving widefield FT-IR microscopy via advancing hardware.3 While these detector improvements have resulted in tremendous progress, sources and spectrometer advancements have not taken place at the same rate. With notable exceptions,12,13 instruments use an interferometer coupled to a thermal source. Setups based on thermal sources are exceptionally efficient, stable and commercially successful; however, practitioners have to acquire a large bandwidth of data even if they are interested in only a small set of wavelengths. A smaller set has been shown to be particularly useful, for example, in tissue classification14 or for monitoring dynamic processes in polymers.15 Techniques which save time by probing only bands of interest may facilitate rapid data acquisition and analyses. As opposed to FT-IR spectroscopic methods, hence, measurements of a few, selected spectral features may be desirable in some areas. Approaches to accomplish the same may be termed discrete frequency IR (DF-IR) spectroscopy methods.1 One straightforward approach to DF-IR spectroscopy and imaging is to use a grating. The use of a dispersive or scanning monochromator for IR microscopy is uncommon due to the inherent low blackbody illumination intensity at individual wavelengths, thereby forfeiting Jacquinot’s advantage as well as the spectral multiplexing (Fellgett) advantage.16 In imaging, the multiplexing advantage may be recovered somewhat by using an array detector, but a configuration in which part of the array is used for spectral and part for spatial measurements compromises the imaging potential. While sources such as a synchrotron can potentially provide the flux to overcome the throughput disadvantage,17,18 a recent emphasis in the use of synchrotrons has been to use the brightness of the source to instead perform high-resolution imaging,19 which would not provide sufficient flux for non-multiplexed methods. Narrowband filters may enable both widefield imaging and DF-IR spectroscopy but are only now maturing as a technology and are intensity limited by the coupled broadband source.20
Recently, narrow-bandwidth quantum cascade lasers (QCLs) have become available. In their most common implementation, QCLs are tunable, external-cavity mid-infrared lasers with outputs on the order of hundreds of milliwatts and grating-assisted spectral selection. First developed in the 90s,21 these devices have been previously used in the detection of trace particles in gases,22 wavelength-modulation absorption measurements,23 and in photoacoustic spectroscopy.24 Early QCLs featured too limited a spectral range to be useful for general spectroscopic analyses. While the tunable range of individual QCLs still covers only a small region of the mid-IR spectrum (for example, here we use a QCL over the range 980–1204 cm−1), these devices represent emerging sources with broad tunable ranges, high-power, and narrow-bandwidths which are suitable for mid-IR spectroscopy. Additionally, these characteristics may render these new lasers suitable as sources for discrete frequency infrared spectroscopy or microscopy. The use of QCLs for IR imaging has been proposed and demonstrated25,26,27 but not in a microscopy format. It is presently unclear whether QCLs offer a microscopy advantage over FT-IR imaging and what specific advances may be enabled by the higher flux. In this manuscript, we describe the use of a QCL as a source in microscopic imaging and point-mapping. By coupling the bright source to an infrared microscope, we take advantage of the laser’s high power to perform imaging in a DF mode and compare the results to FT-IR imaging. We also examine whether a low-cost bolometer can be used as a widefield detector alternative to the current standard of expensive liquid-nitrogen cooled detectors. Further extending attainable data quality, we examine the possibility for high resolution point mapping based on recent theory28 using a micrometer-sized aperture. As QCLs are a coherent source, finally, we describe the implications of spatial coherence with regards to imaging.
EXPERIMENTAL SECTION
Instrumentation
The instrumentation, set up in-house, consists of three main components: a narrow-bandwidth (<1cm−1 spectral bandwidth over the tunable range of 980–1204 cm−1) QCL laser (Daylight Solutions, San Diego, CA, prototype of model UT-9), an infrared microscope (Varian Inc., Palo Alto, CA), and detectors. Two detectors were used - a microbolometer camera with a 324 by 256 pixel detector (Photon series, FLIR, Boston, MA), and a liquid nitrogen cooled single element mercury cadmium telluride (MCT) detector (InfraRed Associates, Stuart, FL). In a second widefield imaging configurations, we employed a cooled focal plane array (FPA) in place of the bolometer (Santa Barbara Focal Plane, Santa Barbara). For widefield imaging, the output beam from the QCL was expanded 10:1 (from a 6mm beam diameter to approximately 60mm) via two gold-coated parabolic mirrors. The expanded beam was passed through an iris and entered the side port of the infrared microscope. In transmission mode, the beam was condensed through a 0.5 NA Schwarzchild objective lens before passing through the sample stage. The beam exiting the sample stage was collected using a matched 15X Schwarzchild reflecting objective. The image was then passed through the microscope’s open aperture and imaged onto the bolometer. For point mapping measurements, the same configuration was used but apertures of variable opening were placed in the beam path after the sample to restrict light to be from a defined spatial region of the sample. Beam expansion optics were removed, and the single element detector was also used in place of the array detector.
A rotating diffuser plate consisting of a one inch diameter, scratched calcium fluoride plate and a small motor was employed in certain portions of the experiment to reduce coherence effects. When in use, it was placed between the second parabolic mirror and the iris, after beam expansion but before the microscope entrance. With the rotating diffuser in place, 64 sequential frames were acquired for each wavelength. These were averaged in order to correct for the changing position of the plate. Acquiring a series of individual frames was necessary because the limited dynamic range of the bolometer prevented integration times from being equal to one period of the diffuser rotation. Single frames were acquired for images without the diffuser. While obviously affecting the signal to noise ratio of the data, we do not consider this aspect here as our aim was to obtain imaging contrast.
A commercial FT-IR imaging spectrometer (Spotlight 400, Perkin Elmer, Waltham, MA) was also used as a performance standard to compare with the instrument described above. The spectrometer was operated in rapid scan mode at a mirror speed of 1 cm/s. Data were acquired and truncated to the 4000–720 cm−1 range of interest. N-B medium apodization was used for spectral transformation and a suitable background was acquired from a region adjacent to the sample.
Data Acquisition and Processing
The test sample in this manuscript was a USAF 1951 optical resolution (bar) target fabricated in-house. Briefly, during the fabrication process, uncured SU-8 photoresist resin was spin coated onto barium fluoride substrate to a desired thickness, cured, post-baked and solvent developed. The target is evaluated using optical microscopy to confirm geometric fidelity. Elements 5 and 6 of cycle 3 were imaged in all instances. All image processing was performed in ENVI (ITT Visual Information Solutions, Boulder, CO) and Matlab (The MathWorks, Nantucket, MA) using code written in-house. Single-beam images had no correction applied, while absorbance images had been divided by a reference image consisting of unmodified barium fluoride substrate. Images taken at discrete frequencies with the QCL and the bolometer also have a ‘dark current’ chip image subtracted from both the single-beam and background images.
Safety Considerations
The quantum cascade laser is the single most hazardous component of the experiments outlined in this manuscript. Depending on the operating wavelength, the output can exceed 400 mW. As a well-collimated beam of diameter ~6mm, the maximum permissible exposure (MPE) of this radiation is reached in less than one second as defined by ANSI Z136.1.29 Additionally, all output frequencies are invisible to the eye, adding to the potential risk of exposure. Lab personnel operating these devices should be trained in laser safety and wear high optical density (OD7+) eye protection at all times.
RESULTS AND DISCUSSION
Optical microspectroscopy and imaging configurations to conduct experiments described in this manuscript were set up. A schematic of the two major setups is shown in Figure 1. These flexible configurations allowed us to perform a number of experiments by changing aspects of the optical train, as needed, to understand the different effects associated with using QCLs. For this preliminary study, we chose to image a USAF 1951 optical resolution bar target, which has historically been used as a standard for measuring the performance of imaging instrumentation. The target features a motif of three equally-spaced rectangles which is patterned many times in decreasing sizes. The particular target used in this manuscript consisted of an approx. 10 μm thick layer of SU-8 polymer (which has a distinctive IR absorption spectrum) on a barium fluoride substrate (which is transparent to mid-infrared light). In all examples, we examined one region of the target: cycle 3, elements 5 and 6, which contain ‘bars’ of widths of approximately 39 and 35 μm, respectively. This particular structure was chosen because it approaches the size limit for targets which are well-resolved by commercial FT-IR imaging instruments.
Figure 1.

Schematics of the two DF-IR systems evaluated in these experiments. Both utilize a tunable, narrow-bandwidth mid-infrared QCL and the same infrared microscope frame. A) QCL coupled to an uncooled bolometer camera. A parabolic mirror pair is used for 10:1 beam expansion before the microscope. For one experiment, a cooled focal plane array (FPA) was substituted for the bolometer. B) A cooled single-element MCT detector is utilized with an adjustable aperture that focuses at the sample plane for point measurements. Flat mirrors replace the parabolic mirror pair so that the beam is not expanded.
We first acquired images of the standard USAF sample using a bolometer array detector, shown in Figure 2a. Uncooled detectors have also been proposed for use in IR spectroscopic imaging measurements but coupling a bolometer to a globar source produced exceptionally low signal-to-noise data.30 The higher flux of the QCL (hundreds of milliwatts with spectral width <1 cm−1 versus tens of microwatts from wavelength 5–10 μm for a typical globar source31) makes imaging with a microbolometer feasible. The lower cost of the microbolometer as well as its larger format compared to the majority of cooled array detectors available makes this a very attractive technology. With a more even illumination, such an imaging system could compete against the established FT-IR imaging systems that usually employ a thermal source (globar) and a cooled array detector. The data acquired using a QCL were compared to those acquired from a commercial FT-IR imaging spectrometer in Figure 2c. It is notable that the QCL-based system used a low-performance bolometer while the FT-IR imaging system is the best available today in terms of signal to noise ratio (SNR). The data demonstrate that the coupling of a QCL to an imaging system can be achieved and presents an opportunity to compare with FT-IR imaging systems even though the two sources are significantly different in nature.
Figure 2.

USAF 1951 optical resolution target absorption images (cycle 3, elements 5 and 6) as acquired by three different instruments. A) QCL+bolometer system without diffuser plate. B) QCL+bolometer system with rotating diffuser plate. C) Commercial FT-IR instrument. Please note the differences in the color bars between the three sets of images. Scale bar in the images denotes100 μm.
A fine structure overlain with the target was apparent in the QCL-based data and was the most striking difference from the FT-IR imaging data. We hypothesized that this effect arose from multiple reflections and scattering from the sample as well as etaloning, both of which were exacerbated by the spatial coherence of the laser. To alleviate this problem, we placed a diffusing element in the beam path. With the use of this diffuser (Figure 2b), the fringes and interference were not entirely eliminated but image quality was substantially improved. Such a diffuser has been used in at least one other study32 but its effect was not presented and the effects of laser coherence on images were not shown. The diffuser employed was a transparent salt plate that was heavily scratched on one face to induce random phase shifts in the beam. Simply placing the plate in the path of the beam had little effect as a structure to the spatial correlation in the beam was still transmitted (images not shown). As a result, the diffuser plate was rotated. Rotating the plate allows energy to be evenly distributed over the specimen but a drawback is that multiple images have to be acquired in order to average out rotation artifacts. Images acquired by the QCL/bolometer instrument with the diffuser plate can be seen in Figure 2b. Compared to Figure 2a, the fine structure is markedly reduced. A slight shadowing effect can be seen in both sets of images, partly the result of an imperfectly aligned system and the presence of a central obscuration in all Schwarzchild objectives. Even with rotation, the collected image is a function of the exact rotational position of the plate at the time of acquisition. Scratching the plate cannot yield completely randomized scattered light in general; consequently, regions of pronounced scratches or less scratching retain some coherence and are projected through the sample and onto the bolometer. A series of 64 sequential images was captured and averaged to ‘smooth out’ this enduring structure. As it is not a perfect solution, the ‘swirling’ pattern caused by the rotating diffuser plate is evident in the images, but this degrades the images far less than without the diffuser in place. In addition to reducing the coherence of light, the scratched diffuser plate also causes additional scattering. This is ordinarily undesirable, as light scattered (or absorbed) by the plate cannot be used for imaging, but in this setup the losses were small compared to the available flux.
The effects of the beam’s spatial coherence are clearly an issue of concern if QCLs are to be used for IR imaging. A theoretical framework to explain image formation including the light coherence is desirable. Using coherent light, every detector element (P′) has electric field contribution, not only from the corresponding point (P) on the sample being imaged, but also from every other point around P within a radius determined by the coherence area.33 If the source is coherent, photons incident at different spatial locations of the sample are in phase with one another. The electric field associated with light scattered at any point from the sample can interfere with light transmitted from other points. The amplitude of the interfered electric fields are added and quadratically encoded in the resulting intensity, which is measured by the detector. Hence, the detector image is the result of both the corresponding image that would be observed using an incoherent source as well as the effects of spatial interference. A complete description of the recorded absorbance is possible using recently developed electromagnetic theory-based models of image formation in IR microscopes and specific sample shapes.34,35,36 Here, we extend a more recent formulation that is especially useful for examining the effects on recorded data of periodic structures in samples.37 For the purposes of simulation in this study, we modified the previously reported framework to include beam coherence and the resulting scattered and transmitted fields were added. To improve image quality and more accurately document the effects of coherence, the bolometer was temporarily replaced with a cooled FPA. The results are shown in Figure 3.
Figure 3.

A) Commercial (globar source) infrared absorbance image of a USAF 1951 optical resolution target (cycle 3, elements 4 through 6) at 1180 cm−1. B) A profile of three ‘bars’ of element 5, indicated by the red line in 3a. C) QCL + FPA absorbance image of the same target at 1180 cm−1. Note that there is no longer a diffuser plate in the beam path such that full coherent effects are present. D) A profile of three bars of element 5, indicated by the red line in 3c. E) Simulated absorbance image of the same region at 1180 cm−1 assuming a coherent source. F) A profile of three simulated ‘bars’ of element 5, indicated by the red line in 3e.
The simulations indicate that the effects of coherence are to impart a fine structure in the recorded absorbance. The most striking feature of the source can be seen in the extracted absorbance profiles at an edge. While data from the globar equipped system shown an apparent absorbance increase at the edge due to scattering,38 the fine structure of the beam extends considerably beyond the edge in the QCL-based system. Although this observation and modeling of the fine structure serves as a caution to the use of QCLs and interpretation of recorded data, it also presents new opportunities in modeling and, perhaps, extracting additional information about the structure of the sample. At this time, however, the expectation that the only outcome of a simple coupling of QCLs to existing microscopy systems would be to obtain an equivalent system but with higher SNR is unfounded. The fringes in the recorded images contain information about sample structure which can be extracted via careful theory, modeling and signal processing. While the formulation of these reconstructions is beyond the scope of this manuscript, a practical concern is that the signal to noise ratio needs to be high for the reconstruction to be reliable. Comparison of theoretical and experimental data demonstrate that further optimization of the optical setup and experimental parameters is required.
In comparing bolometer measurements to those acquired by a commercial FT-IR system, “image quality” can be described by several different factors, including spatial resolution, spectral quality, and signal-to-noise ratio. The spatial resolution of a system is defined completely by wavelength, numerical aperture, and effective detector pixel size. While the QCL instrument utilizes a smaller numerical aperture objective, it can be observed from the measured profiles that resolution does not appear to differ wildly between the two, as is expected. Figure 4a shows the bar motif profiles for target 5, cycle 3 for both the commercial FT-IR instrument and the bolometer plus diffuser plate setup. After a correction for pixel size (the size per pixel in the FT-IR images is almost 2.5 times as large as those in the bolometer images), it is apparent that the two are on the same order. As there are more pixels representing the same area for the bolometer images, this system has the potential to achieve higher quality images. The relative equivalence of images is not surprising as the optical setup is similar; however, the relative equivalence in the presence of coherence effects is encouraging. This may indicate that QCL based systems could be effective for qualitative imaging and will reasonably correlate with FT-IR imaging data, provided that absorbance is high and scattering is not especially strong. For weak absorbance and domain sizes on the order of the wavelength, results between the two would deviate significantly.
Figure 4.

(A) Bar-target profile for a commercial FT-IR instrument and the QCL+bolometer system as indicated by the black and red line segments. Because the two detectors contain a different number of pixels, the scale of the measured bolometer profile was adjusted to match that of the commercial instrument. (B) Overlaid absorption spectra of SU-8 polymer for both the commercial FT-IR system and the QCL+bolometer system. The commercial system recovers the spectrum using an inverse Fourier transform recorded by an interferometer with a 0.25 cm maximum retardation (~4 cm−1 resolution). The discrete absorbance measurements were taken every 4cm−1 for the bolometer system by tuning the QCL sequentially.
Arguably more important than resolution in chemical imaging is the quality of the recorded spectra. When sequential images across a range of evenly-spaced wavelengths are acquired, an absorption spectrum at each pixel is generated. Figure 4b shows the spectrum of SU-8 as acquired by the bolometer instrument with diffuser plate and as acquired by the commercial FT-IR system. It is clear from the similarity of the band shapes that the bolometer instrument is capable of collecting a representative spectrum. While the band intensities are not identical to those determined by the commercial instrument, this is to be expected. Bolometers are inherently noisier than cooled focal plane arrays and are generally not considered capable of quantitative measurements. While not explicitly observed, it is probable that these power fluctuations can be exacerbated at the far limits of the laser’s tunable range. The differences may also be due to optical effects, as reported previously for other configurations,34–38 but need to be examined in detail using available theory and simulations. The SNR of acquired data is another important aspect of image quality which should be evaluated. Due to uneven illumination in this unoptimized setup, we have measured the signal-to-noise ratio as varying from less than 1 to as large as 32. These values are for images whose acquisition time is on the order of milliseconds and signal averaging may well improve the SNR if the noise is detector dominated. It can be argued that the QCL system has a higher capacity for signal-to-noise ratio than does the FT-IR instrument: not only is the source power much higher at each individual wavelength measured (between 200mW and 400mW at most wavelengths), but the entire dynamic range of the detector is used for a single wavelength at a time rather than evaluating all wavelengths simultaneously. Finally, the QCL-bolometer system underperforms the commercial FT-IR imaging system, indicating the need for further improvement. When these challenges are addressed, the QCL-bolometer system will offer advantages over FT-IR imaging for certain applications. The higher flux makes measurement in aqueous environments possible.39 Only a handful of bands are required for certain biological analyses,14 making acquisition of the entire spectrum redundant. Discrete frequency methods could offer a distinct speed advantage in cases where only some bands are required for measurement. Additionally, due to the direct acquisition of data without the need for performing a Fourier transform, the possibility for real-time infrared microscopy and monitoring becomes available.
Given the multichannel detection advantage and the emergence of IR imaging systems with exceptional quality,2,19 we focused on widefield microscopy applications of the QCL source. Interferometric instrumentation is not appropriate for point mapping applications due to the very low throughput of a broadband source through a small aperture. In comparison, a potentially use for QCLs as IR spectroscopy sources may lie in high-throughput point mapping measurements. The large flux, focused into a single channel, may offset some of the speed advantages of multichannel detection and the need to diffuse the beam over a large area. The use of point illumination may also be used to circumvent the fine structure seen in images as there would not be a scattered and transmitted wave at two different points to interfere. As a final instrumentation setup, we examined the use of QCL for point mapping.9 For point mapping, the expansion optics (gold-coated parabolic mirrors, iris) and diffuser plate were removed from the DF-IR setup. This kept the unaltered beam tightly focused (less than 2mm diameter) upon entering the microscope. The bolometer camera was replaced with a cooled single-element MCT detector, allowing for enhanced sensitivity. For simple point measurements by rastering large areas, a QCL system will not be able to best an FT-IR imaging system with a globar source. The speed of these conventional widefield systems would far outperform QCL point mapping; the advantage of a QCL source lies in the ability to create truly diffraction limited spot sizes with large NA objectives and small apertures. We replaced our objective with a 74x Schwarzchild objective of 0.65 NA. The high magnification of the objective meant that the microscope’s builtin adjustable square aperture could be used to create a very small effective aperture (0.72 μm) for point-imaging. This aperture size is significantly smaller than the range of illumination wavelengths for imaging and smaller than any objective reported for a globar or synchrotron-based system.40,41,42 Even with this small aperture in place, a large SNR was observed, and by rastering the stage in increments 1μm or 0.5 μm, spectral data were obtained over larger areas. To date, this is the smallest far-field aperture and smallest point spacing reported. While we caution that diffraction still limits the spot size and therefore the resolution that can be achieved, the image improvement over the use of ~10 μm apertures is obvious in the recorded data. Figure 5 demonstrates data acquired from two polystyrene spheres that are approximately 10 μm in diameter. The pixel density is over 100 times that of a synchrotron and nearly 1000 times more than that of a globar.19 For localizing samples in a microscopy configuration, QCL-based point mapping systems present a new opportunity to image small regions and generate images that are of high pixel density for small feature recognition. The reproduction of structure is quite faithful. At ~10 μm imaging wavelength, the 10 μm diameter spheres can be clearly seen and easily separated.
Figure 5.
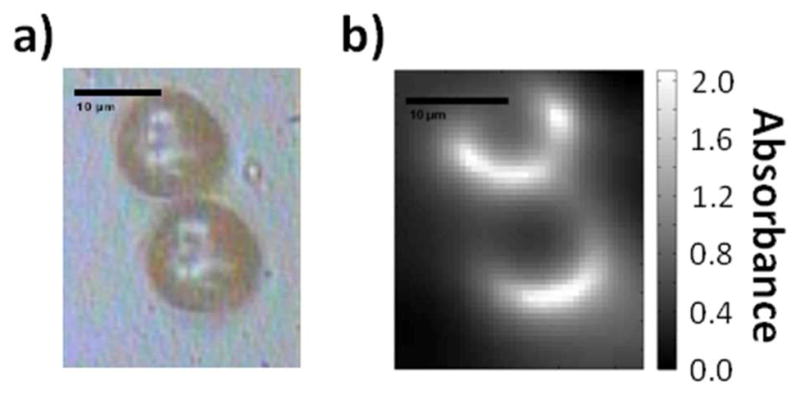
A) White-light image of two touching polystyrene spheres, diameter 10μm. B) Point-mapping IR absorption image of the same two spheres at 1080cm−1, 0.5μm steps, 0.72μm aperture.
This point mapping method also allows for the investigation of scattering effects with enhanced clarity. Scattering by the edges of structural features in infrared imaging is extensive, but difficult to quantify in a widefield regime. The corner of one of the ‘bars’ in the USAF 1951 optical resolution target from the first set of experiments was imaged with both a commercial FT-IR instrument and the point mapping setup to compare the clarity of scattering effects. As imaged by the commercial system in Figure 6a, the feature shows an increased loss of transmission at the edges (misinterpreted by the instrument as increased absorbance). The image shows no well-defined structure to the increased scattering. This is evidenced by Figure 6b which shows an absorbance profile of one row of pixels in the image. When imaged by the point-mapping QCL system in 0.5um steps, it becomes apparent that there is a well-defined structure to the scattering that was not discernible in the globar image. Figure 6c shows the multiple spatial maxima and minima that occur with edge scattering, and Figure 6d shows one row of pixels in greater detail. The richness of information from the edge deserves increased examination and is likely to spur further interest in understanding image formation in the IR.
Figure 6.

A) Image of a USAF 1951 bar target corner with a commercial FT-IR instrument. The increased ‘absorbance’ at the sharp feature edges is actually due to increased scattering. B) Graphical profile of one row of pixels from 6a. Aside from some blurring, there does not appear to be well-defined interference pattern at the feature edges due to scattering. C) Image of the corner with the point-mapping instrument and a 0.72 μm aperture. The edge structure looks starkly different from that of 6a. D) Graphical profile of one row of pixels from 6c. Each edge shows a series of minima and maxima that were not discernible with a commercial FT-IR instrument.
CONCLUSION
The latest developments in tunable QCL technology have large tuning ranges, narrow spectral linewidths and high fluxes to the point where these become feasible sources for discrete-frequency infrared imaging. We have demonstrated an application of a QCL for use as a source in infrared microscopy. When coherence is reduced and the beam is expanded, images of an optical resolution target can be acquired on a bolometer-type camera. These images are comparable to commercial FT-IR measurements in spatial resolution, but lack in spectral clarity and signal-to-noise ratio. When used for point-mapping, the QCL provides a throughput advantage unmatched by incoherent broadband sources and allows for high-resolution infrared imaging through a small aperture. These properties of QCLs as an infrared source allow for additional advantages, including rapid widefield imaging at single wavelengths, enhanced localization of signal and the possibility for real-time infrared monitoring.
Acknowledgments
The described work was supported by the National Science Foundation (CHE 0957849) and by the National Institutes of Health (R01EB009745). M.V.S. would like to acknowledge support from the Department of Defense.
References
- 1.Bhargava R. Appl Spectrosc. 2012;66(10):1091–1120. doi: 10.1366/12-06801. [DOI] [PMC free article] [PubMed] [Google Scholar]
- 2.Walsh MJ, Reddy RK, Bhargava R. IEEE J Sel Top Quant. 2012;18(4):1502–1513. [Google Scholar]
- 3.Levin IW, Bhargava R. Ann Rev Phys Chem. 2005;56:429–474. doi: 10.1146/annurev.physchem.56.092503.141205. [DOI] [PubMed] [Google Scholar]
- 4.Bhargava R, Wang SQ, Koenig JL. Adv Polym Sci. 2003;163:137–191. [Google Scholar]
- 5.Prati S, Joseph E, Sciutto G, Mazzeo R. Acc Chem Res. 2010;43(6):792–801. doi: 10.1021/ar900274f. [DOI] [PubMed] [Google Scholar]
- 6.Bellisola G, Sorio M. Am J Cancer Res. 2012;2:1–21. [PMC free article] [PubMed] [Google Scholar]
- 7.Kwiatkoski JM, Reffner JA. Nature. 1987;328(27):837–838. [Google Scholar]
- 8.Lewis EN, Treado PJ, Reeder RC, Story GM, Dowrey AE, Marcott C, Levin IW. Anal Chem. 1995;67(19):3377–3381. doi: 10.1021/ac00115a003. [DOI] [PubMed] [Google Scholar]
- 9.Bhargava R, Wall BG, Koenig JL. Appl Spectrosc. 2000;54(4):470–479. [Google Scholar]
- 10.Huffman SW, Bhargava R, Levin IW. Appl Spectrosc. 2002;56(8):965–969. [Google Scholar]
- 11.Snively CM, Katzenberger S, Oskarsdottier G, Lauterbach J. Opt Lett. 1999;24(24):1841–1843. doi: 10.1364/ol.24.001841. [DOI] [PubMed] [Google Scholar]
- 12.Elmore DL, Tsao MW, Frisk S, Chase DB, Rabolt JF. Appl Spectrosc. 2002;56(2):145–149. [Google Scholar]
- 13.Liu JN, Schulmerich MV, Bhargava R, Cunningham BT. Opt Exp. 2011;19(24):24182–24197. doi: 10.1364/OE.19.024182. [DOI] [PMC free article] [PubMed] [Google Scholar]
- 14.Bhargava R. Anal Bioanal Chem. 2007;389(4):1155–1169. doi: 10.1007/s00216-007-1511-9. [DOI] [PubMed] [Google Scholar]
- 15.Lendl B, Schindler R. Vib Spectrosc. 1999;19(1):1–10. [Google Scholar]
- 16.Griffiths PR, De Haseth JA. Fourier Transform Infrared Spectrometry. 2. John Wiley & Sons; Hoboken, New Jersey: 2007. [Google Scholar]
- 17.Hirschmugl CJ, Gough KM. Appl Spectrosc. 2012;66(5):475–491. doi: 10.1366/12-06629. [DOI] [PubMed] [Google Scholar]
- 18.Petibois C, Piccinini M, Guidi MC, Marcelli AJ. Synchrotron Radiat. 2010;17(1):1–11. doi: 10.1107/S0909049509046056. [DOI] [PubMed] [Google Scholar]
- 19.Nasse MJ, Walsh MJ, Mattson EC, Reininger R, Kajdacsy-Balla A, Macias V, Bhargava R, Hirschmugl CJ. Nat Methods. 2011;8:413–416. doi: 10.1038/nmeth.1585. [DOI] [PMC free article] [PubMed] [Google Scholar]
- 20.Kodali AK, Schulmerich M, Ip J, Yen G, Cunningham BT, Bhargava R. Anal Chem. 2010;82(13):5697–5706. doi: 10.1021/ac1007128. [DOI] [PMC free article] [PubMed] [Google Scholar]
- 21.Faist J, Capasso F, Sivco DL, Sirtori C, Hutchinson AL, Cho AY. Science. 1994;264(5158):553–556. doi: 10.1126/science.264.5158.553. [DOI] [PubMed] [Google Scholar]
- 22.Kosterev AA, Tittel FK. IEEE J Quantum Electron. 2002;38(6):582–591. [Google Scholar]
- 23.Namjou K, Cai S, Whittaker EA, Faist J, Gmachl C, Capasso F, Sivco DL, Cho AY. Opt Lett. 1998;23(3):219–223. doi: 10.1364/ol.23.000219. [DOI] [PubMed] [Google Scholar]
- 24.Paldus BA, Spence TG, Zare RN, Oomens J, Harren FJM, Parker DH, Gmachl C, Cappasso F, Sivco DL, Baillargeon JN, Hutchinson AL, Cho AY. Opt Lett. 1999;24(3):178–180. doi: 10.1364/ol.24.000178. [DOI] [PubMed] [Google Scholar]
- 25.Weida MJ, Buerki PR, Pushkarsky M, Day T. Micro- and Nanotechnology Sensors, Systems, and Applications. 2011;8031:803127. [Google Scholar]
- 26.Brandstetter M, Genner A, Anic K, Lendl B. Procedia Eng. 2010;5:1001–1004. [Google Scholar]
- 27.Phillips MC, Ho N. Opt Exp. 2008;16(3):1836–1845. doi: 10.1364/oe.16.001836. [DOI] [PubMed] [Google Scholar]
- 28.Reddy R, Davis B, Carney PS, Bhargava R. IEEE I S Biomed Imaging. 2011:738–741. [Google Scholar]
- 29.ANSI Z136.1 - American National Standard for Safe Use of Lasers. Laser Institute of America; Orlando: 2007. [Google Scholar]
- 30.Haka AS, Levin IW, Lewis EN. Appl Spectrosc. 2000;54(5):753–755. [Google Scholar]
- 31.Kwon B, Schulmerich MV, Elgass LJ, Kong R, Holton SE, Bhargava R, King WP. Ultramicroscopy. 2012;116:56–61. doi: 10.1016/j.ultramic.2012.03.007. [DOI] [PubMed] [Google Scholar]
- 32.Amrania H, McCrow A, Phillips C. Rev Sci Instrum. 2009;80:123702. doi: 10.1063/1.3262499. [DOI] [PubMed] [Google Scholar]
- 33.Born M, Wolf E, editors. Principles of Optics: Electromagnetic Theory of Propagation, Interference and Diffraction of Light. 6. Cambridge University Press; Cambridge, United Kingdom: 2006. [Google Scholar]
- 34.Davis BJ, Carney PS, Bhargava R. Anal Chem. 2010;82:3487–3499. doi: 10.1021/ac902068e. [DOI] [PubMed] [Google Scholar]
- 35.Davis BJ, Carney PS, Bhargava R. Anal Chem. 2010;82:3474–3486. doi: 10.1021/ac902067p. [DOI] [PubMed] [Google Scholar]
- 36.Davis BJ, Carney PS, Bhargava R. Anal Chem. 2011;83:525–532. doi: 10.1021/ac102239b. [DOI] [PubMed] [Google Scholar]
- 37.Reddy RK, Walsh MJ, Schulmerich MV, Carney PS, Bhargava R. Appl Spectrosc. 2012 doi: 10.1366/11-06568. In press. [DOI] [PMC free article] [PubMed] [Google Scholar]
- 38.Bhargava R, Wang SQ, Koenig JL. Appl Spectrosc. 1998;52:323–328. [Google Scholar]
- 39.Schaden S, Haberkorn M, Frank J, Baena JR, Lendl B. Appl Spectrosc. 2004;58(6):667–670. doi: 10.1366/000370204872971. [DOI] [PubMed] [Google Scholar]
- 40.Dumas P, Carr GL, Williams GP. Analusis. 2000;28(1):68–74. [Google Scholar]
- 41.Jamin N, Dumas P, Moncuit J, Fridman WH, Teillaud JL, Carr GL, Williams GP. Proc Nat Acad Sci USA. 1998;95(9):4837–4840. doi: 10.1073/pnas.95.9.4837. [DOI] [PMC free article] [PubMed] [Google Scholar]
- 42.Miller LM, Smith RJ. Vib Spectrosc. 2005;38(1–2):237–240. [Google Scholar]