

Abstract
Heterochromatin represents a significant portion of eukaryotic genomes and has essential structural and regulatory functions. Its molecular organization is largely unknown due to difficulties in sequencing through and assembling repetitive sequences enriched in the heterochromatin. Here we developed a novel strategy using chromosomal rearrangements and embryonic phenotypes to position unmapped Drosophila melanogaster heterochromatic sequence to specific chromosomal regions. By excluding sequences that can be mapped to the assembled euchromatic arms, we identified sequences that are specific to heterochromatin and used them to design heterochromatin specific probes (“H-probes”) for microarray. By comparative genomic hybridization (CGH) analyses of embryos deficient for each chromosome or chromosome arm, we were able to map most of our H-probes to specific chromosome arms. We also positioned sequences mapped to the second and X chromosomes to finer intervals by analyzing smaller deletions with breakpoints in heterochromatin. Using this approach, we were able to map >40% (13.9 Mb) of the previously unmapped heterochromatin sequences assembled by the whole-genome sequencing effort on arm U and arm Uextra to specific locations. We also identified and mapped 110 kb of novel heterochromatic sequences. Subsequent analyses revealed that sequences located within different heterochromatic regions have distinct properties, such as sequence composition, degree of repetitiveness, and level of underreplication in polytenized tissues. Surprisingly, although heterochromatin is generally considered to be transcriptionally silent, we detected region-specific temporal patterns of transcription in heterochromatin during oogenesis and early embryonic development. Our study provides a useful approach to elucidate the molecular organization and function of heterochromatin and reveals region-specific variation of heterochromatin.
Heterochromatin is a fundamental component of eukaryotic genomes and in many species comprises a substantial fraction of genomic content (for example, 30% of the human genome). It is cytologically and functionally distinct from euchromatin, often exists in large blocks near the centromeres and telomeres, and remains densely packed throughout the cell cycle. Heterochromatin has a low gene density but is enriched for repetitive DNA sequences such as satellite DNAs and transposable elements (TEs). It has long been considered as transcriptionally inactive, and it leads to repression of euchromatic genes positioned nearby (for review, see Grewal and Jia 2007). Despite its apparent “inactive” status, heterochromatin has important cellular functions, such as chromosome segregation (Allshire et al. 1995; Kellum and Alberts 1995), nuclear organization (Csink and Henikoff 1996; Dernburg et al. 1996), and silencing of active TEs through RNA interference pathways (for reviews, see Huisinga and Elgin 2009; Malone and Hannon 2009). Although generally regarded as transcriptionally silent, heterochromatin contains actively transcribed genes (for review, see Dimitri et al. 2009). For example, in Drosophila, more than 40 genes essential for viability or fertility have been mapped to pericentric heterochromatin (Dimitri et al. 2005). Although the compacted configuration and transcriptional inactivity of heterochromatin has been well characterized in differentiated tissues, it is not clear whether these repressive features would also be expected in early embryos before differentiation starts. The lack of comprehensive physical maps of heterochromatin has made detailed molecular characterization difficult.
Drosophila melanogaster provides a useful model for studying heterochromatin because of its powerful genetic, cytological, and genomic approaches. About 30% of the D. melanogaster genome (∼180 Mb) is heterochromatin (Manning et al. 1975; Adams et al. 2000). Heterochromatin in Drosophila is divided into 62 distinct cytological regions and mainly localized at the pericentric regions of five major chromosome arms (2L, 2R, 3L, 3R, and X), as well as the Y and fourth chromosomes (Dimitri 1991; Koryakov et al. 2002). In polytene chromosomes heterochromatin is underrepresented and appears as two morphologically distinct portions: more centromerically localized, highly compacted α heterochromatin, which is mainly composed of satellite DNA, and more distally localized loosely compacted β heterochromatin, which is enriched for TE and other middle-repetitive elements but also contains single copy DNA (Heitz 1934; Miklos and Cotsell 1990; Leach et al. 2000). To date, only a minor part of D. melanogaster heterochromatin, mainly restricted to the β heterochromatin, has been mapped: A small portion (4.7 Mb, henceforth termed as “h”) has been positioned contiguous with the assembled euchromatic arms. Another 11.2 Mb were assembled into individual scaffolds and positioned on specific chromosome arms, but their order and orientation were not fully determined (“arm Het”) (Hoskins et al. 2007). The majority of the heterochromatic sequences in the current genome assembly (Release 5) are unmapped, including 33.9 Mb of DNA contigs arbitrarily concatenated into arm U (8.4 Mb) and Uextra (25.5 Mb) (Hoskins et al. 2007). Mapping of these sequences has been hindered by the difficulties in sequencing, assembly, and localization of repetitive sequences that populate the heterochromatin. To date, molecular analyses of D. melanogaster heterochromatin have been limited to fully (“h”) or partially (arm “Het”) mapped sequences (Smith et al. 2007; Graveley et al. 2011; Kharchenko et al. 2011). Construction of molecular maps with DNA sequence markers is critical for a more comprehensive analysis of heterochromatin.
Here, we demonstrate a new strategy that allowed us to identify and map a large number of D. melanogaster heterochromatic sequences. Taking advantage of the large collections of chromosome rearrangements generated by the Drosophila community in the past few decades, we produced embryos bearing deletions for specific chromosomal regions and recognized them by the phenotypes that result from the absence of specific genes required for early embryonic development. We then analyzed the DNA from the deficiency embryos by comparative genomic hybridization (CGH) analysis and localized sequences to specific chromosomal regions according to their absence from DNA prepared from deficiency embryos. Using this approach, we positioned 13.9 Mb of the previously unmapped heterochromatic sequences to 18 different chromosomal regions. We also identified and mapped 110 kb of novel heterochromatic sequences not previously present in sequence databases. We found that different regions in the heterochromatin have very distinct chromatin compositions, replication behaviors in the polytene chromosomes, and patterns of small RNA production. Surprisingly, we detected transcriptional activity in broad regions of heterochromatin during oogenesis and early embryo development, including the satellite-rich α-heterochromatin. The timing of such expression appears to be region specific. Overall, by positioning sequences into defined heterochromatic regions, our study provides new insight into the structural organization and biological activities of heterochromatin.
Results
Identification of sequence-specific probes for Drosophila heterochromatin
In order to establish heterochromatin-specific probes for CGH analysis, we analyzed DNA libraries prepared from Drosophila embryos on an Illumina GAIIX DNA sequencer to an overall haploid genome coverage depth of 40×. To identify sequences that are specific to the heterochromatin, we removed sequence reads that aligned to the assembled euchromatin or the mapped heterochromatin (“h”). Highly repetitive, simple tandem repeats, were also removed based on their low-sequence complexity. The remaining sequence reads, which were putative heterochromatic-specific sequences, were assembled into contigs and used for designing 60-nucleotide (nt) candidate heterochromatic-specific probes (H-probes) for microarray analysis (Supplemental Fig. S1).
To investigate the sequence composition of the candidate H-probes, we examined their similarity to the reference genome. The probes were classified into two groups (Fig. 1A; Supplemental Fig. S3; Supplemental Table S1). The first group contains sequences that can be aligned to the reference genome (allowing up to one mismatch or equivalent in 60 nt). As expected from the existing heterochromatin in the Release 5 assembly, the vast majority of the H-probe reads could be aligned to arm Het, arm U, and/or Uextra. The second group contains sequences that do not match to the reference genome (i.e., two or more mismatches). Many of them likely represent polymorphisms to the reference genome, as their closest BLAST hits were euchromatic and the chromosomal location of the alignments were consistent with our mapping assignments (see below). This group also contains a number of novel heterochromatic sequences that are not present in the current reference genome (described below). Although the exact fractions vary depending on the criteria used in their initial classification, our grouping of candidate H-probes into heterochromatic and polymorphic euchromatic is remarkably robust (Supplemental Fig. S4).
Figure 1.

Sequence analysis of candidate H-probes. (A) Distribution of candidate H-probes according to their sequence similarity to the reference genome shown here as BLAST e-values. The pie diagrams on the right show the distribution of the best BLAST hit for each category. H-probes in category 1 map to heterochromatic sequences, whereas most H-probes in category 2 have their best matches evenly distributed to euchromatic regions. (B) Comparison of H-probes with chromosome U sequences. 60mer pseudo probes were generated spanning the entire arm U with a 30-nt overlap. Their best alignments on the assembled euchromatin (including “h”) or annotated TEs were assessed. Our H-probes show low similarity to euchromatic sequences in the reference genome (blue) or to TEs (red), whereas a significant fraction of the pseudo arm U probes show such homology. (C) Distribution of arm U contigs according to the percentage of the contig sequence that is covered by H-probes. (D) Two examples showing the typical patterns of H-probe location relative to the euchromatin-like and TE-like sequences in arm U contigs. Some U contigs are predominantly composed of sequences that are highly similar to the euchromatin and therefore only contain a small number of H-probes (top), whereas others show little sequence similarity to the euchromatin and are populated by H-probes (bottom).
Our approach to generating H-probes excluded euchromatic sequences including most transposable element (TE) families distributed in both euchromatin and heterochromatin (Kaminker et al. 2002). Thus, our H-probes cover only a subset of arm Het, arm U, and arm Uextra sequences (5.5%, 16%, and 13.5%, respectively) and localize to regions that do not share perfect matches with euchromatic sequence (Fig. 1B). To evaluate the distribution of H-probes within heterochromatin, we examined the position of H-probes on arm U contigs. The arm U contigs split into two populations with distinct levels of H-probe coverage (0%–40% vs. 70%–100%) (see Fig. 1C,D for two examples). The sequence composition of these two populations of heterochromatic contigs is further discussed below. Overall, we identified 11,475 H-probes corresponding to published unmapped or partially mapped heterochromatic sequence (arm Het, U, and Uextra in the Release 5 reference genome), and 31,419 probes that are either polymorphic sequence or novel H-probes. We designed microarrays containing all candidate H-probes, and included ∼23,000 probes corresponding to annotated genes as reference probes for chromosomal locations and expression levels.
Positioning of unmapped heterochromatin sequences by CGH analysis of large chromosome deletions
We developed a CGH-based assay to position unmapped H-probes to chromosome arms by analyzing embryos deficient for a specific chromosome/chromosome arm. Such embryos were produced by flies bearing compound chromosomes, in which the two left or two right arms are attached to the same centromere (Rasmussen 1960; Scriba 1967, 1969). The surviving adults in such stocks have normal diploid DNA contents, but one quarter of the embryos produced by such flies will lack the left arm, and another quarter will be missing the right arm (Supplemental Fig. S2A). The deficiency embryos show phenotypes at around the blastoderm stage when specific zygotic gene products from the missing arm become required for normal development (Merrill et al. 1988; Wieschaus and Sweeton 1988). The DNA libraries we initially sequenced were derived from two types of embryos collected from the compound second chromosome stock (C2V): One lacked all 2L sequences that are more distal to the 2L breakpoint, and the other lacked all 2R sequences that are more distal to the 2R breakpoint. Comparing the two libraries confirmed our genetic expectation that all euchromatic sequences of 2L or 2R were missing from the 2L or 2R sample, respectively, validating our accuracy of embryo sorting, DNA preparation, sequencing, assembly, and alignment to the reference genome (data not shown).
Using embryos from the C2V stock, we were able to classify a fraction of our H-probes to 2L or 2R heterochromatic regions distal to the breakpoint in C2V. A second compound stock, the compound entire second chromosome (C(2)entire), produces embryos lacking the entire second chromosome (“2En-”, Supplemental Fig. S2B), therefore allowing us to identify H-probes located in the centromeric region between the 2L and 2R breakpoints in C2V. We also collected embryos lacking the entire third chromosome (“3En−”), 3L (“3L−”), 3R (“3R−”), the fourth chromosome (“4−”), the X chromosome (“X−”), or both X and Y chromosomes (“XY−”). DNA purified from these embryos was analyzed by CGH using wild-type Oregon R embryos harvested before significant polytenization (0–8 h) as a reference diploid whole-genome DNA for hybridization. We first examined the distribution of the log2-ratios of the deficiencies versus reference for the annotated euchromatic genes. For each deficiency, the array probes located in the deleted region showed log2-ratios highly biased toward the reference, clearly distinct from probes corresponding to genes that are not deleted (Supplemental Fig. S5). Using the annotated euchromatic genes as training data (Fig. 2A), we used a machine-learning approach (support vector machine, SVM) to assign all probes to one of the following chromosomal locations: 2L-het, 2R-het, 2CEN-het, 3L-het, 3R-het, 3CEN-het, 4-het, X-het, and Y-het. The confidence of each assignment was categorized as “high confidence,” “low confidence,” or “unmappable” using a SVM score cutoff that achieved 95% accuracy on the known probes (Supplemental Table S1). The accuracy of the assignments was evaluated by leave-one-out estimates (error: 6.59%; recall: 93.57%; precision: 81.54%). We also checked H-probes that align to arm Het with one mismatch or less. For probes that were mapped with high confidence (62% of total), 80% were assigned to the correct chromosome arms (Fig. 2B; Supplemental Table S3). These results demonstrated that our high-confidence assignments had a very good correct recognition rate for both euchromatic and heterochromatic sequences. We then used the SVM to localize H-probes that correspond to previously unmapped arm U and arm Uextra assembled contigs. A total of 83% could be mapped with high confidence (Fig. 2C; Supplemental Table S3). The majority (82%) mapped to the third and X chromosomes, whereas only a small fraction were mapped to the second chromosome. This is consistent with previous studies showing that >70% of the second chromosome heterochromatin is composed of AT-rich simple tandem repeats (Lohe et al. 1993). By comparing the cytological locations of the arm Het scaffolds and the mapping assignments of H-probes that correspond to arm Het, we were able to estimate the position of the breakpoints in the compound autosomes, and therefore correlated the locations of the H-probes with the cytological regions (Fig. 2H).
Figure 2.

Assignment of unmapped H-probes to specific chromosomal regions by CGH analysis of chromosome deletions. CGH analysis of embryos lacking specific chromosomes or chromosome arms. (A) Single-copy euchromatic reference probes localized by their hybridization behavior to DNA deficient for individual chromosomes or chromosome fragments. Probes are clustered according to their chromosomal localizations as indicated on the right of the image. (Green) Fold decrease relative to Oregon R normal diploid reference. (Red) Fold increase. (B) Locations of H-probes that align to arm Het. Probes are clustered according to the position of their best match on arm Het. Each probe was mapped with either high confidence (H), low confidence (L), or unmappable (U). Note that we detected a previously reported misassignment of scaffold CP000217 from 3L to 2R (arrow) (Hoskins et al. 2007). (C) New assignment of H-probes that map to arm U or Uextra. Chromosome regions and number of probes mapped to each region are shown on the right. (D) Identification of novel H-probes from probes that do not have a perfect match in the reference genome but were mapped to a specific chromosome or chromosome arm. Novel H-probes mapping to 2CEN, 3CEN were identified based on their absence in deficiency DNA from compound entire stocks. For three chromosome arms (X, 2L, and 3L), novel H-probes are identified by CGH analysis of translocations breaking at the euchromatin/heterochromatin boundary. Numbers of H-probes mapped to the heterochromatin (het) or euchromatin (eu) are indicated. (E) CGH analysis of translocations with breakpoints in 2R heterochromatin. (Top) Cytological map of 2R heterochromatin and a model showing the translocation breakpoints. The cytological positions of the breakpoints were determined based on H-probes that match to 2R Het. (Bottom) Hierarchical clustering of H-probes that were mapped to 2R and 2CEN. These H-probes were further positioned into six nonoverlapping regions on 2R heterochromatin (R1–R6). (F) CGH analysis of the X chromosome rearrangements, including (1) Y duplicated for a piece of proximal X and (2) X deficiencies encompassing part or all of the X heterochromatin. Using hierarchical clustering, we were able to classify the X-specific H-probes into four nonoverlapping categories (X1–X4). Note that X4 contains almost all H-probes that match to X Het (h26). (G) Distinguishing Y-specific H-probes from those shared by X and Y by CGH analysis of polytene chromosomes from ovaries (Ov) and salivary glands (SG). Both groups were initially mapped to Y because they are depleted in X-Y−, but present in X-Y+. Y-specific H-probes are expected to be absent in female tissues and therefore show greater degree of depletion in ovaries than in salivary glands, whereas XY-shared H-probes are expected to be less depleted in the ovaries than in salivary glands because of the higher degree of polytenization in the latter (Fig. 4B). H-probes mapped to Y are clustered into two populations. One population that overlaps with autosomal H-probes and shows greater log2(Ovary/embryo) and log2(Ovary/Salivary gland) values is categorized as XY-shared, while the other population that overlaps with most control probes from YHet is categorized as Y-specific. (H) The position of chromosome regions on the cytogenetic map of Drosophila heterochromatin with numbered divisions (h1–h58) and centromeres (c). Modified from Gatti et al. (1994). The breakpoints of the compounds 2 and 3 chromosomes were determined according to the cytological location of the arm “h” and arm Het scaffolds (double arrows) and the sets of H-probes that match to them.
For candidate H-probes that do not have perfect matches to the reference genome, we sought to distinguish novel, previously unidentified heterochromatic sequences from polymorphic variants of euchromatic sequences in the reference genome using CGH analysis of deficiency embryos that lack the euchromatic but not the heterochromatic portion of each chromosome arm. To obtain such embryos, we crossed compound chromosome females with males bearing translocations with breakpoints at the euchromatin–heterochromatin boundary. One-eighth of the embryos from such a cross will lack the sequences more distal to the translocation breakpoint, which we were able to select based on their mutant phenotypes (Supplemental Fig. S2C). We tested three sets of translocations that cover ∼60% of the euchromatic genome (2L, 3L, and X) and found that the majority of “novel” H-probes mapped to a given arm indeed mapped to regions more distal to the euchromatin–heterochromatin boundary, and therefore were probably polymorphic euchromatic sequences (Fig. 2D). In support of this, we found that for most of them the mapping positions were consistent with their best BLAST hits in the euchromatin (Supplemental Fig. S7). The approach did, however, identify 1097 novel H-probes (110 kb of contig sequence), most of which were mapped to the heterochromatin in chromosome X and Y (Fig. 2D). A total of 57% of the novel H-probes appear to be polymorphic to arm Het, arm U, or arm Uextra, while the rest do not show clear sequence homology with the known heterochromatic sequences (Supplemental Fig. S8; Supplemental Table S3).
We further applied this mapping technique with embryos carrying smaller deficiencies generated from translocations with breakpoints at various positions along the chromosomes. Using a set of translocations that break at 2R heterochromatin, we found that most H-probes mapped to 2CEN-het indeed locate on 2R heterochromatin, and we were able to position the 2R-specific H-probes into six subregions (Fig. 2E; Supplemental Fig. S9A). Alternatively, smaller deletions for mapping could also be produced from duplications and deficiencies. As an example, using a set of X-chromosome duplications and deficiencies, we were able to position the X-specific H-probes into four subregions (Fig. 2F; Supplemental Fig. S9B).
We also examined DNA extracted from female tissues (ovaries) to validate our sequence assignments to the Y chromosome. To our surprise, we found that only a subset of H-probes mapped to Y were depleted from the ovaries. We suspected that the sequences showing partial depletion from ovaries are shared between X and Y, and are therefore missing from X-Y−, but not X-Y+ embryos. Comparing the level of depletion in ovaries and in salivary gland polytene chromosomes (see below) allowed us to further classify the H-probes mapped to Y into Y specific (“Y-het”) and shared between X and Y (“XY-het”) (Fig. 2G). In D. melanogaster, clusters of tandemly repeated ribosomal DNA (rDNA) are located both in the middle of the X heterochromatin and on the short arm of the Y chromosome (Ritossa 1973; Long and Dawid 1979). Indeed, we found that 20% of “XY-het” H-probes show sequence similarity to rDNA (see Fig. 3B). We could not define the location of the “XY-het” H-probes on the X heterochromatin with finer resolution because of the presence of the Y chromosome in all deficiency embryos that we used to map the X heterochromatin.
Figure 3.

Sequence composition of the H-probes. (A) Sequence composition of H-probes mapped to different heterochromatic regions. (B,C) Bar graphs summarizing the satellite DNA populations (B) and TE populations (C, grouped into clades) within H-probes mapped to different heterochromatic regions. (Xp) X1; (Xd) X2-4.
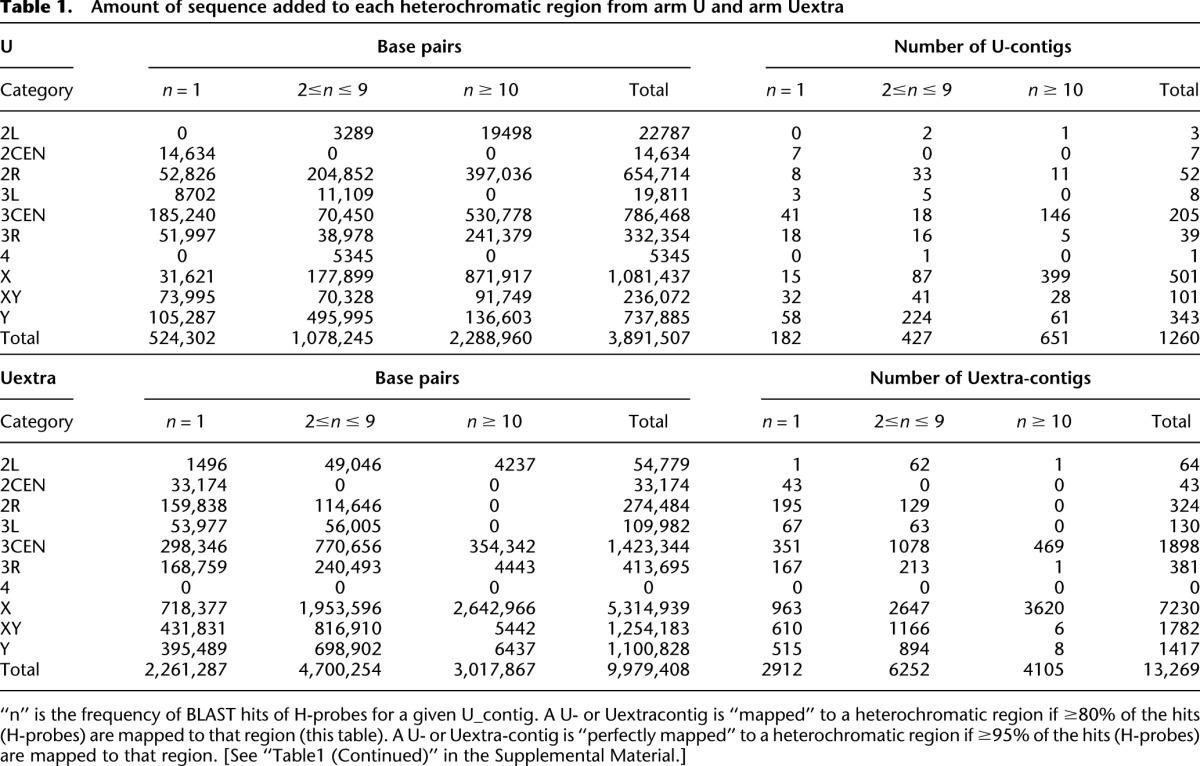
In summary, we mapped ∼10,000 H-probes and subdivided the heterochromatin into 18 subregions flanking the X chromosome and autosomal centromeres. The majority of these probes correspond to previously assembled but partially mapped (arm Het, 19%) or unmapped (arm U/Uextra, 70%) scaffolds. This allowed us to further position 3.9 Mb (46%) of arm U- and 10.0 Mb (39%) of arm Uextra-contigs to specific chromosome arms (Table 1; Supplemental Tables S4, S5). In addition, we identified and mapped 110 kb novel heterochromatic sequences that are not present in the reference genome. These newly mapped sequences provided us with a unique tool to examine the molecular organization and properties of the heterochromatin, and we used them in the subsequent analysis. The polymorphic euchromatic probes (henceforth called “genomic euchromatic probes”) as well as the annotated euchromatic genes on the microarrays were used as controls.
Table 1.
Amount of sequence added to each heterochromatic region from arm U and arm Uextra
Repetitiveness of the heterochromatic sequences, their underreplication in the polytene chromosomes, and their association with small RNA production
We performed BLAST analysis to compare our H-probes with known repetitive sequences in D. melanogaster (Lohe et al. 1993; Kaminker et al. 2002). We found that 43% of mapped H-probes are related to previously identified satellite DNAs, mainly to the GC-rich dodeca satellites and the 359-bp satellites. A total of 1.5% of H-probes are related to rDNA, most of which were mapped to XY-het. Another 21.6% of H-probes show sequence similarity to known TEs, although they are not so similar that they would have been excluded in the initial comparison with the established genome sequence. The remaining 33.8% of H-probes did not show clear satellite DNA or TE origin (Fig. 3A; Supplemental Table S3). Our sequence alignments indicate that most satellite-like H-probes mapped to 3CEN-het correspond to the dodeca satellites, and those mapped to proximal X-het (subregion X1, henceforth “Xp-het”) correspond to the 359-bp satellites (Fig. 3B), which is consistent with the previous in situ hybridization studies (Abad et al. 1992; Lohe et al. 1993; Koryakov et al. 2002). Other previously identified satellite DNAs that we mapped in this study include the Rsp-element on 2R-het (Brittnacher and Ganetzky 1989; Gatti and Pimpinelli 1992), the 356-bp satellites on 3L-het (Losada and Villasante 1996), and the stellate-like repeats on Y-het (Palumbo et al. 1994). The non-satellite H-probes generally are more evenly distributed on different chromosome arms other than 2L-het (Fig. 3A,C), which is mainly composed of AT-rich simple satellite repeats (Lohe et al. 1993). An exception is the R1-elements, also known as “Type I rDNA insertions” (Jakubczak et al. 1990; Yamamoto et al. 1990), which we found nearly exclusively map to distal X-het (subregions X2–X4, henceforth “Xd-het”). Often we observe H-probes similar to the same type of satellite DNA or TE that map to different chromosomal locations, likely revealing region-specific enrichment of different variants of the same ancestor. We also expanded our analysis to the arm U contigs mapped in this study and found a strong region-dependent enrichment of distinct classes of satellites and TEs (Supplemental Fig. S10). Interestingly, we found that most U-contigs showing high H-probe coverage (Fig. 1C) map to 3CEN-het or Xp-het and are nearly exclusively composed of sequences similar to the dodeca or 359-bp satellites, respectively (Supplemental Fig. S11).
A defining feature of heterochromatin in Drosophila is its underreplication as cells differentiate. We prepared DNA from two highly differentiated tissues (larval salivary glands and adult ovaries) and used CGH analyses in comparison to DNA from the blastoderm stage embryos to determine whether different H-probes showed region-specific differences in replication. The H-probes on average were strongly underrepresented in comparison to the euchromatic probes. The degree of underreplication as measured by the log2-ratios showed great heterogeneity (Fig. 4A; Supplemental Fig. S12; Supplemental Table S6). Within each arm the satellite-like HSPs usually show the greatest level of underreplication, such as the dodeca and the 359-bp satellites. These satellite-like H-probes, which usually mapped to the most centromeric region, likely represent α-heterochromatin, while the less underreplicated non-satellite H-probes likely correspond to β-heterochromatin. It is worth noting that a subset of H-probes were not underreplicated in the polytene chromosomes, even though they mapped to heterochromatic regions (Fig. 4A). Most H-probes in this group (83.7%) do not have clear satellite or TE origins. Intriguingly, we found that this group is enriched for H-probes that are associated with a low level of H3K9Me3 (Supplemental Fig. S13; Supplemental Table S7). Although the level of underreplication in salivary glands and ovaries were highly correlated, the satellite-like H-probes are different from the non-satellite-like H-probes in that they tend to be more highly underreplicated in salivary glands (Fig. 4B), suggesting that the differential degrees of underreplication of α- and β-heterochromatin are distinct in different tissues or at various developmental stages.
Figure 4.

Repetitiveness of the H-probes and their underreplication in polytene chromosomes. (A) CGH analysis of polytene DNA purified from larval salivary glands and DNA from blastoderm stage embryos collected prior to tissue differentiation and chromosome polytenization. The data were normalized such that the mean log2-ratios of polytene DNA and embryonic DNA were zero for single-copy euchromatic genes (Eu). The H-probes were strongly underrepresented in the polytene DNA, and the level of underreplication varied for H-probes mapped to different chromosomal regions. (B) Comparing the degree of underreplication in salivary glands and ovaries. The colored lines are the linear fits to the data for the indicated category of H-probes. Note that the slope of linear regression fit for the satellite-like H-probes is less steep compared with the non-satellite-like H-probes. (C) Comparing sequence repetitiveness with level of underreplication in polytene chromosomes. To measure repetitiveness, sequence reads from an independent D. melanogaster genomic library were aligned to the probe sequences and the number of reads per probe was taken as an indication for repetitiveness. (Eu) Annotated euchromatic genes. (Het) H-probes. (D) H-probes from different sequence element families within individual heterochromatic regions show characteristic patterns of repetitiveness and underreplication in salivary gland polytene chromosomes.
A second feature of heterochromatin is that many of the sequences are highly repetitive. To evaluate repetitiveness of our H-probes, we aligned sequencing reads from an independently prepared Drosophila genome library to the probe sequences and measured repetitiveness by determining the sequencing coverage (Supplemental Table S6). The H-probes were on average more repetitive than euchromatic probes (∼300-fold) with strong correlation with the degree of underreplication (Fig. 4C; r = −0.80). H-probes similar to the same satellite DNA often show a characteristic high degree of repetitiveness and underreplication in polytene chromosomes, whereas the non-satellite-like H-probes were much less repetitive and, with the exception of those mapped to Xd-het, appear to be more divergent (Fig. 4D). Our finer mapping of 2R-het also revealed that sequences with different degrees of underreplication and repetitiveness, including single-copy sequences, are interspersed across large regions within heterochromatin (Supplemental Fig. S14). Examining sequence coverage in another genomic library prepared from a different stock yielded a very similar result (Supplemental Fig. S15), suggesting that the variation of repetitiveness between different strains is low. In addition to the sequencing coverage assessment, we further assessed the repetitiveness of probes across all of the deficiency stocks by comparing the hybridization intensities to a single common reference of normal diploid DNA from early Oregon R embryos. We observed high correlation of abundances between the test strains and the control (Supplemental Fig. S6; Supplemental Table S8), further supporting the stability of repeat element abundances across different stocks.
A third defining feature of heterochromatin related to its repetitive nature is as templates for expression of small RNAs such as Piwi-interacting RNA (piRNA) and endogenous siRNA (endo-siRNA) (for review, see Huisinga and Elgin 2009; Malone and Hannon 2009). Many of these small RNAs correspond to active TEs and are thought to function in repressing transposon activities and maintaining the integrity of the genome. We analyzed the abundance of small RNAs derived from different heterochromatic regions by aligning raw sequence reads from published small RNA libraries (Chung et al. 2008) to H-probes (Fig. 5A; Supplemental Table S9). The average number of small RNA reads aligned to H-probes (60 reads/probe) was much higher than the number of small RNA reads aligned to the genomic euchromatic probes (0.3 reads/probe). H-probes mapped to X-het, including both the TE-enriched distal region and the satellite-enriched proximal region, showed the highest average number of reads. The vast majority of piRNAs originate from discrete genomic regions called piRNA clusters. Of 30 previously identified piRNA clusters on arm U (Brennecke et al. 2007) mapped by this study, 20 are present on X-het (Supplemental Table S10). For the other chromosomes, the satellite-like H-probes are associated with a higher number of small RNAs (Fig. 5A, insets). The majority of the H-probe-associated small RNAs derived from the X chromosome and autosomes were highly abundant in embryos and female bodies that contain ovary and embryo materials, whereas small RNAs derived from the Y chromosome were mostly abundant in imaginal discs and male bodies (Fig. 5B). Most of the highly abundant small RNAs also showed strong strand biases (Supplemental Fig. S16), suggesting that they are piRNAs but not endo-siRNAs (Ghildiyal et al. 2008).
Figure 5.

Generation of small RNA from the heterochromatic sequences. Sequence reads of small RNA libraries produced from 0 to 1-h embryos, 2 to 6-h embryos, 6 to 10-h embryos, imaginal discs, female bodies, female heads, male bodies, or male heads (Chung et al. 2008) were aligned to the probe sequences, and the number of reads that match each probe was measured. (A) Heterochromatic regions differ in their production of small RNAs corresponding to different types of repetitive sequences. All show overall higher levels of small RNA than that of the euchromatic genes (Eu), but between different heterochromatic regions the overall abundance of small RNAs and the type of repetitive sequences they originate from vary substantially. Inset highlights the log2(small RNA reads) of the major satellite DNAs at the region. (B) Temporal profile of small RNA expression. Heat map showing log2 (small RNA reads) at different developmental stages.
Transcription profile of the heterochromatic sequences
Heterochromatin is not generally thought to be highly active transcriptionally. The chromatin status of specific sequences may, however, be developmentally regulated and not yet completely inactive in very early embryos. We therefore investigated the transcription profiles of our mapped sequences by microarray, focusing on early developmental stages (0–1 h; cycle13 to early cycle 14 [∼2–2.5 h]; mid- to late cycle 14 [∼2.5–3 h]; 3-4 h; and 4–5 h). We detected transcription from a substantial fraction of probes that corresponds to annotated heterochromatic genes (58%) or TE-like sequences (57%), consistent with the previous genome-wide profiling of Drosophila transcriptome (Fig. 6A; Supplemental Fig. S17; Graveley et al. 2011). Unexpectedly, we also detected transcripts from a high fraction (91%) of the Satellite-like H-probes (Fig. 6A; Supplemental Table S11), which is markedly different from the genomic euchromatic probes on the array, of which only 15% are transcribed. Although the transcription level of H-probes is on average low (Fig. 6A), a fraction of them (2.6%) were expressed with a level comparable to the top 40% of the annotated euchromatic genes (Supplemental Table S12).
Figure 6.

Transcription profile of the heterochromatic sequences. cDNA were prepared from manually staged wild-type Oregon R embryos at various developmental stages and analyzed by microarray using cDNA prepared from Oregon R embryos with mixed developmental stages (0–16 h) as reference for hybridization. The hybridization intensities of the test cDNAs were normalized according to the reference cDNA and used as a measure of transcription levels. The cutoff for background (nonspecific) hybridization intensity was determined using control probes that do not hybridize with Drosophila sequences. (A, left) Percentage of H-probes that are transcribed during the examined stages. (Right) The average transcription level of the H-probes that are transcribed. Annotated euchromatic genes (anno-eu), annotated heterochromatic genes (anno-het), and genomic euchromatic sequences (genomic-eu) were included as controls. (B) Temporal pattern of expression shown as fold changes compared to the reference. H-probes from each chromosomal region were grouped by hierarchical clustering according to their expression profiles (left and middle). Only transcribed probes are shown. Prevalent temporal patterns were detected for H-probes mapped to Xd-het and Xp-het and the satellite-like H-probes mapped to 3CEN-het, but not the non-satellite-like H-probes mapped to autosomal heterochromatin. Annotated heterochromatic genes (Het genes) and 2000 randomly selected euchromatic genes were clustered and shown as controls (right). (C) Histone modifications associated with H-probes. ChIP-seq reads for H3K9Me3 and H3K27Me3 (modENCODE) were aligned to H-probes and the number of reads for each H-probe was normalized to the input. Heat map demonstrates enrichment of each modification by showing log2(normalized reads). H-probes within the same category were clustered by hierarchical clustering. Note that H-probes mapped to the same subdivision (X2, X3, or X4) of Xd-het share similar patterns of H3K27Me3 enrichment. Annotated euchromatic and heterochromatic genes (Het genes) were included as controls. (D, left) Bivariate scatter plots comparing H3K9Me3 enrichment with level of transcription during early embryogenesis. The x-axis is the average of log2(normalized reads for H3K9Me3) at 0–4 h, 4–8 h, and 8–12 h of the embryonic development. The y-axis is the log2 scale of the highest transcription level during 2.5–5 h of the embryonic development detected by microarray. (Right) Distribution of the H-probes according to their enrichment for H3K9Me3 during 0–12 h.
Based on the developmental profile, some of these RNA appeared to be loaded into the embryo following transcription during oogenesis (present in 0 to 1-h embryos), while others were newly transcribed during embryogenesis (lacking in 0 to 1-h embryos, but present at later stages after zygotic transcription is activated). Several heterochromatic regions show characteristic temporal patterns of H-probe expression. Most non-satellite H-probes that mapped to Xd-het, for example, showed activation of zygotic transcription at cycle 13, which tapered down in the following 2–3 h and was no longer evident in 19 to 22-h embryos (Fig. 6B). This pattern was distinct from the satellite-like H-probes on Xp-het and 3CEN-het. In contrast, the non-satellite H-probes located elsewhere did not show a predominant pattern (Fig. 6B).
Transcriptional activities are regulated by post-translational histone modifications. We examined the association of two histone modifications, H3K9Me3 and H3K27Me3, with H-probes using publicly available ChIP-seq data from modENCODE (Kharchenko et al. 2011; Supplemental Table S13). H3K9Me3 and H3K27Me3 are generally recognized as silencing markers associated with “closed” chromatin and repression of transcription in heterochromatin (Filion et al. 2010; Kharchenko et al. 2011). As expected, H-probes showed high enrichment for H3K9Me3 in comparison to euchromatic probes (Fig. 6C; Kharchenko et al. 2011; Riddle et al. 2011; Supplemental Fig. S18). As a control, H3K9Ac, which often associated with the promoters and transcription start sites of the actively transcribed euchromatic genes, did not show enrichment in H-probes (data not shown). Noticeably, highly expressed non-Satellite H-probes and annotated heterochromatic genes were more often associated with a low level of H3K9Me3 (Fig. 6D) (“Het genes,” “Autosomal-het”). In contrast, the H-probes mapped to Xd-het and the satellite-like H-probes, which show higher and more uniform H3K9Me3 associations lack clear correlation between enrichment of H3K9Me3 and expression levels (Fig. 6D; Supplemental Fig. S19). Interestingly, H3K27Me3 displayed divergent patterns of enrichment or depletion between different groups of H-probes or at different developmental stages (Fig. 6C). Highly expressed H-probes also associated with low H3K27Me3 levels (Supplemental Fig. S19). Remarkably, the three subregions at Xd-het that show distinct H3K27Me3 association patterns over time also differ in their transcriptional profiles (Fig. 6C; Supplemental Fig. S20). Overall, we observe that a substantial portion of Drosophila heterochromatin is transcribed and their transcriptional activity is correlated with their associated histone modifications, although the specific rules of this relationship may differ from those previously characterized in the euchromatin.
Discussion
Mapping heterochromatin by CGH analysis of chromosome deletions
By CGH analysis of deficiency embryos we mapped a substantial amount of previously unmapped heterochromatic contigs into chromosome arms or even more defined chromosomal regions. Our strategy involved the assembly and validation of ∼10,000 short 60-nt probes (H-probes) that excluded euchromatic sequences, transposable elements, and highly repeated simple AT-rich satellite sequences. These H-probes provide sequence markers distributed along the previously unmapped heterochromatic scaffolds of chromosome-U and Uextra. Despite the repetitive nature of most H-probes, a majority could be mapped to specific chromosomal regions. Our findings confirmed previous cytological analysis of satellite DNAs using in situ hybridization (Abad et al. 1992; Lohe et al. 1993; Koryakov et al. 2002) and demonstrated that different heterochromatin regions contain unique or predominant species of repetitive sequences. Using the H-probes that match sequences on arm U and Uextra, we mapped 3.9 Mb sequences out of the 8.4 Mb of sequence comprising arm U, and 10.0 Mb out of 25.5 Mb present in arm Uextra, to specific chromosome arms. We were not able to map the rest of the heterochromatic contigs on arm U and Uextra due to lack of H-probes that match to them, probably because they are highly similar to the euchromatic sequences or composed of simple satellite repeats. We have focused on the pericentric heterochromatin, and therefore did not include any telomeric or interstitial heterochromatin.
Our approach allows mapping sequences to intervals defined by any given set of breakpoints. The mapping resolution is limited by the available breakpoints in the region under study. In Drosophila, a wealth of translocations and deficiencies have been generated over past decades and are widely used as genetic tools. New chromosomal rearrangements can also be produced and characterized using standard genetic and cytological approaches. Therefore, our strategy is particularly suitable for mapping the Drosophila genome. In principle, the strategy can also be applied to other model organisms, including mouse, in which chromosome translocations and deletions can be induced by ionizing irradiation or chemical mutagens, or engineered using Cre-loxP recombination system (Ramirez-Solis et al 1995). However, since our mapping approach involves generating embryos bearing a series of segmental deficiencies, it is not applicable to mapping human heterochromatin.
Because our approach involves comparing stocks bearing chromosome rearrangements with a wild-type strain, the reliability of our analysis depends on overall low intraspecific sequence variation. Although we observed sequence polymorphism between C2V and the reference genome (Fig. 2D), we believe that our conclusion is robust to intraspecific variation because of the following reasons. First, the overall level of per-nucleotide variation among wild D. melanogaster populations is low (0.4%–2%) (Begun and Aquadro 1993; Moriyama and Powell 1996), and would be expected to be even lower among inbred laboratory stocks. Second, the majority of our newly mapped H-probes perfectly match armU and/or Uextra in the reference genome, suggesting that we selected heterochromatic sequences that are less variable between strains. Third, although previous studies of cytological banding patterns revealed some structural variations in heterochromatin such as size, location, and orientation among D. melanogaster laboratory stocks (Halfer 1981), the reported variations are largely restricted to the Y chromosome. Finally, the hybridization intensity of the H-probes that are expected to be present at normal diploid levels are highly correlated between Oregon R and test strains (Supplemental Fig. S6), suggesting that the abundance of these repetitive sequences is comparable between strains we examined.
Organization and transcriptional activities of D. melanogaster pericentric heterochromatin
Our analysis demonstrated that the heterochromatin is spatially organized into broad domains with distinct properties. The most centromeric regions of the heterochromatin contain large blocks of region-specific, highly repetitive satellite-like sequences, which are highly underreplicated in the polytene chromosomes, whereas the flanking distal heterochromatic regions were populated with the less underreplicated, non-satellite-like sequences. Our finer mapping of 2R-het indicated that although, in general, more distal heterochromatic sequences are less repetitive and less underreplicated in polytenized tissues, both distal and proximal heterochromatic regions contain sequences with a broad range of these properties. Our data confirmed previously observed differences in the levels with which heterochromatic sequences from different regions are underreplicated in polytenized tissues (Yamamoto et al. 1990) and further demonstrated that this difference is tissue specific. We generated a comprehensive picture of the sequence diversity of the α- and β-heterochromatin that corresponds well to their observed localization and compactness in the polytenized chromosomes.
We observed transcription from an unexpectedly large number of H-probes, in particular the low but significant level of transcripts detected from tandemly repeated satellite DNAs. Cell-cycle-specific transcription of pericentric tandem repeats has been observed from both fission yeast and mammals and has been suggested to function in maintaining the condensed structure of heterochromatin (Lu and Gilbert 2007; Chen et al. 2008; Probst et al. 2010). Interestingly, we found that transcription from the dodeca and 359-bp satellites has distinct temporal patterns. The specific temporal regulation of transcription of the satellite DNAs in fly heterochromatin might also carry functions during embryonic development. For example, a recent study suggested a role of the maternally deposited RNAs derived from the 359-bp satellite on the X chromosome in maintaining the heterochromatin structure for normal mitotic chromosome segregation in early embryos (Ferree and Barbash 2009). One possibility is that these satellite DNA-derived transcripts serve as precursors for small RNA biogenesis. In support of this, we showed that abundant small RNAs were mapped to the H-probes that share sequence similarity to the 359-bp satellite on the X chromosome. The observation that the X-het-derived small RNAs were highly abundant during oogenesis and embryogenesis, whereas Y chromosome-derived small RNAs were particularly enriched in imaginal discs also suggests that different populations of small RNAs have developmental-stage and tissue-specific functions.
The broad transcription from heterochromatin, in particular the α-heterochromatin, is surprising, as the heterochromatic sequences are extensively associated with transcriptional repressing histone modifications such as H3K9Me3. Previous studies demonstrated that H3K9Me3 and its effector HP1 can associate with heterochromatic genes that are transcriptionally active and that a heterochromatic environment appears to be critical for the expression of several heterochromatic genes (for review, see Dimitri et al. 2009). Nevertheless, we detected a negative correlation between the levels of gene expression and H3K9Me3 enrichment within β-heterochromatin, suggesting that lower association of the repressive marker is preferred for high-transcriptional activities, while a lack of such correlation in α-heterochromatin suggests that transcription may be differently regulated there. Interestingly, H3K27Me3 displays region-specific patterns of enrichment or depletion within α-heterochromatin and appears to correlate with the dynamic temporal profile of transcription in the Xd-het region, suggesting a role of the polycomb group proteins targeted by H3K27Me3 in developmental regulation of heterochromatin transcription. Future investigations using the selection of H-probes we mapped are likely to provide more insight into the relation between chromatin organization and transcriptional activities within heterochromatin.
Methods
(See Supplemental Material for fly stocks, genetics and a full description of methods.)
CGH analysis, data normalization, and mapping assignment by support vector machine
For each experiment 100–150 embryos of the appropriate genotype were collected, dechorionated, and digested with proteinase K prior to phenol/chloroform extraction. DNA was then sonicated and sodium acetate/ethanol precipitated. DNA purified from 0–8 h wild-type Oregon R embryos was used as the reference. Purified DNA was labeled using the BioPrime kit (Life Technologies) and hybridized with the microarray following standard Agilent CGH protocol. Feature extraction was performed by Agilent feature extraction software using the CGH protocol. DNA used for the underreplication analysis was isolated from whole salivary glands dissected from roaming third-instar larvae or from ovaries dissected from adult females.
Array data were normalized using the limma package in R (Smyth and Speed 2003). Arrays were first normalized by variance stabilization between arrays using NormalizeBetweenArrays (Huber et al. 2002) with a control array of cycle 14 wild-type Oregon R embryos hybridized to the usual 0 to 8-h wild-type Oregon R embryo reference as the training model. Each array was then normalized using NormalizeWithinArrays with all mapped euchromatic probes present at normal diploid levels as control probes. These normalized ratiometric data were then classified using a support vector machine. SVM-multiclass from the SVM Light package (Joachims 1999) trained using the locations of euchromatic probes with known positions that have single BLAST hits to the genome. Classification was carried out using both ratiometric data and raw intensities of the array data corresponding to the deletion data. The SVM scores of the classifier on known probes were used to determine a cutoff score for which 95% of positive calls are accurate. This cutoff was then used to group H-probe position calls into “high confidence” and “low confidence” groups.
Microarray analysis of gene expression
Total RNA was extracted from 100 visually staged Oregon R embryos with TRIzol (Invitrogen). Six developmental stages were examined: (1) 0–1 h; (2) cycle13 to early cycle 14; (3) mid- to late cycle 14; (4) 3–4 h; (5) 4–5 h; and (6) 19–22 h. A total of 325 ng of RNA was used to synthesize complementary RNA (cRNA) according to the Agilent protocol. cRNA from an Oregon R embryo sample with broad developmental stages (0-16 h) was used as the reference. A total of 1000 ng of labeled cRNA for each channel was hybridized with the array following the standard Agilent CGH protocol. Feature extraction was performed by Agilent feature extraction software using the gene expression protocol. Raw intensities of the array data were normalized using the limma package in R. Arrays were first loess normalized using NormalizeWithinArrays, and then all arrays were quantile normalized according to the reference channel using NormalizeBetweenArrays. Probes were clustered by Pearson correlation according to the ratiometric expression data at different developmental stages.
Analysis of genomic sequence data sets
Sequence alignments of Illumina sequence data were done using Bowtie (Langmead et al. 2009). For the analysis of DNA copy number, Illumina raw sequence data of 100 read length was trimmed to the first 35 bases to permit mapping to the 60mer array probes, and we counted the number of reads matching each probe (allowing a maximum of one mismatch). The raw data from Chung et al. (2008) and modENCODE Sequence Read Archive were downloaded and used for analysis of small RNA expression and chromatin modifications, respectively.
Data access
Microarray data have been submitted to the NCBI Gene Expression Omnibus (GEO) (http://www.ncbi.nlm.nih.gov/geo/) under the following accession numbers: GSE36260: Array CGH of Drosophila compound chromosomes on heterochromatin custom array. GSE36261: Array CGH of Drosophila translocations on heterochromatin custom array-eu_het boundary. GSE36262: Array CGH of Drosophila ChrX deficiencies_duplications on heterochromatin custom array. GSE36263: Array CGH of Drosophila translocations on heterochromatin custom array-2Rhet. GSE36264: Array CGH of Drosophila polytene chromosomes on heterochromatin custom array. GSE36265: Gene expression analysis for Oregon R embryos at different developmental stages. Sequence reads from genomic libraries prepared from 2L- and 2R-embryos, FASTA sequences of assembled potential heterochromatic contigs and probes can be accessed via the following URL: http://genomics-pubs.princeton.edu/Mapping_Drosophila_Heterochromatin/.
Acknowledgments
We thank John Matese (PUMA microarray database), Donna Storton, and Jessica Buckles (microarray facility) for technical support. We thank all members of the Wieschaus lab and Schupbach lab for helpful discussions. We thank the Kyoto Drosophila Genetic Resource Center for maintaining the translocations stock essential for these experiments and the Bloomington Drosophila Stock Center for providing additional fly stocks. This work was supported by the Howard Hughes Medical Institute and the National Institutes of Health. B.H. is supported by the NJ Commission on Cancer Research Fellowship. PUMAdb is funded by the National Institute of General Medical Sciences (NIGMS) (NIH grant P50 GM071508). E.W. is supported by funds from the Howard Hughes Medical Institute and Grant 4R37 HD 15587 from the National Institutes of Health.
Footnotes
[Supplemental material is available for this article.]
Article published online before print. Article, supplemental material, and publication date are at http://www.genome.org/cgi/doi/10.1101/gr.137406.112.
Freely available online through the Genome Research Open Access option.
References
- Abad JP, Carmena M, Baars S, Saunders RD, Glover DM, Ludena P, Sentis C, Tyler-Smith C, Villasante A 1992. Dodeca satellite: A conserved G+C-rich satellite from the centromeric heterochromatin of Drosophila melanogaster. Proc Natl Acad Sci 89: 4663–4667 [DOI] [PMC free article] [PubMed] [Google Scholar]
- Adams MD, Celniker SE, Holt RA, Evans CA, Gocayne JD, Amanatides PG, Scherer SE, Li PW, Hoskins RA, Galle RF, et al. 2000. The genome sequence of Drosophila melanogaster. Science 287: 2185–2195 [DOI] [PubMed] [Google Scholar]
- Allshire RC, Nimmo ER, Ekwall K, Javerzat JP, Cranston G 1995. Mutations derepressing silent centromeric domains in fission yeast disrupt chromosome segregation. Genes Dev 9: 218–233 [DOI] [PubMed] [Google Scholar]
- Begun DJ, Aquadro CF 1993. African and North American populations of Drosophila melanogaster are very different at the DNA level. Nature 365: 548–550 [DOI] [PubMed] [Google Scholar]
- Brennecke J, Aravin AA, Stark A, Dus M, Kellis M, Sachidanandam R, Hannon GJ 2007. Discrete small RNA-generating loci as master regulators of transposon activity in Drosophila. Cell 128: 1089–1103 [DOI] [PubMed] [Google Scholar]
- Brittnacher JG, Ganetzky B 1989. On the components of segregation distortion in Drosophila melanogaster. IV. Construction and analysis of free duplications for the Responder locus. Genetics 121: 739–750 [DOI] [PMC free article] [PubMed] [Google Scholar]
- Chen ES, Zhang K, Nicolas E, Cam HP, Zofall M, Grewal SI 2008. Cell cycle control of centromeric repeat transcription and heterochromatin assembly. Nature 451: 734–737 [DOI] [PubMed] [Google Scholar]
- Chung WJ, Okamura K, Martin R, Lai EC 2008. Endogenous RNA interference provides a somatic defense against Drosophila transposons. Curr Biol 18: 795–802 [DOI] [PMC free article] [PubMed] [Google Scholar]
- Csink AK, Henikoff S 1996. Genetic modification of heterochromatic association and nuclear organization in Drosophila. Nature 381: 529–531 [DOI] [PubMed] [Google Scholar]
- Dernburg AF, Broman KW, Fung JC, Marshall WF, Philips J, Agard DA, Sedat JW 1996. Perturbation of nuclear architecture by long-distance chromosome interactions. Cell 85: 745–759 [DOI] [PubMed] [Google Scholar]
- Dimitri P 1991. Cytogenetic analysis of the second chromosome heterochromatin of Drosophila melanogaster. Genetics 127: 553–564 [DOI] [PMC free article] [PubMed] [Google Scholar]
- Dimitri P, Corradini N, Rossi F, Verni F 2005. The paradox of functional heterochromatin. Bioessays 27: 29–41 [DOI] [PubMed] [Google Scholar]
- Dimitri P, Caizzi R, Giordano E, Carmela Accardo M, Lattanzi G, Biamonti G 2009. Constitutive heterochromatin: A surprising variety of expressed sequences. Chromosoma 118: 419–435 [DOI] [PubMed] [Google Scholar]
- Ferree PM, Barbash DA 2009. Species-specific heterochromatin prevents mitotic chromosome segregation to cause hybrid lethality in Drosophila. PLoS Biol 7: e1000234 doi: 10.1371/journal.pbio.1000234 [DOI] [PMC free article] [PubMed] [Google Scholar]
- Filion GJ, van Bemmel JG, Braunschweig U, Talhout W, Kind J, Ward LD, Brugman W, de Castro IJ, Kerkhoven RM, Bussemaker HJ, et al. 2010. Systematic protein location mapping reveals five principal chromatin types in Drosophila cells. Cell 143: 212–224 [DOI] [PMC free article] [PubMed] [Google Scholar]
- Gatti M, Pimpinelli S 1992. Functional elements in Drosophila melanogaster heterochromatin. Annu Rev Genet 26: 239–275 [DOI] [PubMed] [Google Scholar]
- Gatti M, Bonaccorsi S, Pimpinelli S 1994. Looking at Drosophila mitotic chromosomes. Methods Cell Biol 44: 371–391 [DOI] [PubMed] [Google Scholar]
- Ghildiyal M, Seitz H, Horwich MD, Li C, Du T, Lee S, Xu J, Kittler EL, Zapp ML, Weng Z, et al. 2008. Endogenous siRNAs derived from transposons and mRNAs in Drosophila somatic cells. Science 320: 1077–1081 [DOI] [PMC free article] [PubMed] [Google Scholar]
- Graveley BR, Brooks AN, Carlson JW, Duff MO, Landolin JM, Yang L, Artieri CG, van Baren MJ, Boley N, Booth BW, et al. 2011. The developmental transcriptome of Drosophila melanogaster. Nature 471: 473–479 [DOI] [PMC free article] [PubMed] [Google Scholar]
- Grewal SI, Jia S 2007. Heterochromatin revisited. Nat Rev Genet 8: 35–46 [DOI] [PubMed] [Google Scholar]
- Halfer C 1981. Interstrain heterochromatin polymorphisms in Drosophila melanogaster. Chromosoma 84: 195–206 [DOI] [PubMed] [Google Scholar]
- Heitz E 1934. Uber alpha-Heterochromatin sowie Konstanz und Bau der Chromomeren bei Drosophila. Biol Zentralbl 45: 588–609 [Google Scholar]
- Hoskins RA, Carlson JW, Kennedy C, Acevedo D, Evans-Holm M, Frise E, Wan KH, Park S, Mendez-Lago M, Rossi F, et al. 2007. Sequence finishing and mapping of Drosophila melanogaster heterochromatin. Science 316: 1625–1628 [DOI] [PMC free article] [PubMed] [Google Scholar]
- Huber W, von Heydebreck A, Sultmann H, Poustka A, Vingron M 2002. Variance stabilization applied to microarray data calibration and to the quantification of differential expression. Bioinformatics 18: S96–S104 [DOI] [PubMed] [Google Scholar]
- Huisinga KL, Elgin SC 2009. Small RNA-directed heterochromatin formation in the context of development: What flies might learn from fission yeast. Biochim Biophys Acta 1789: 3–16 [DOI] [PMC free article] [PubMed] [Google Scholar]
- Jakubczak JL, Xiong Y, Eickbush TH 1990. Type I (R1) and type II (R2) ribosomal DNA insertions of Drosophila melanogaster are retrotransposable elements closely related to those of Bombyx mori. J Mol Biol 212: 37–52 [DOI] [PubMed] [Google Scholar]
- Joachims T. 1999 Making large-scale SVM learning practical. In Advances in kernel methods-support vector learning (ed. B Schölkopf et al.). MIT Press, Cambridge, MA. [Google Scholar]
- Kaminker JS, Bergman CM, Kronmiller B, Carlson J, Svirskas R, Patel S, Frise E, Wheeler DA, Lewis SE, Rubin GM, et al. 2002. The transposable elements of the Drosophila melanogaster euchromatin: A genomics perspective. Genome Biol 3: RESEARCH0084 doi: 10.1186/gb-2002-3-12-research0084 [DOI] [PMC free article] [PubMed] [Google Scholar]
- Kellum R, Alberts BM 1995. Heterochromatin protein 1 is required for correct chromosome segregation in Drosophila embryos. J Cell Sci 108: 1419–1431 [DOI] [PubMed] [Google Scholar]
- Kharchenko PV, Alekseyenko AA, Schwartz YB, Minoda A, Riddle NC, Ernst J, Sabo PJ, Larschan E, Gorchakov AA, Gu T, et al. 2011. Comprehensive analysis of the chromatin landscape in Drosophila melanogaster. Nature 471: 480–485 [DOI] [PMC free article] [PubMed] [Google Scholar]
- Koryakov DE, Zhimulev IF, Dimitri P 2002. Cytogenetic analysis of the third chromosome heterochromatin of Drosophila melanogaster. Genetics 160: 509–517 [DOI] [PMC free article] [PubMed] [Google Scholar]
- Langmead B, Trapnell C, Pop M, Salzberg SL 2009. Ultrafast and memory-efficient alignment of short DNA sequences to the human genome. Genome Biol 10: R25 doi: 10.1186/gb-2009-10-2-r25 [DOI] [PMC free article] [PubMed] [Google Scholar]
- Leach TJ, Chotkowski HL, Wotring MG, Dilwith RL, Glaser RL 2000. Replication of heterochromatin and structure of polytene chromosomes. Mol Cell Biol 20: 6308–6316 [DOI] [PMC free article] [PubMed] [Google Scholar]
- Lohe AR, Hilliker AJ, Roberts PA 1993. Mapping simple repeated DNA sequences in heterochromatin of Drosophila melanogaster. Genetics 134: 1149–1174 [DOI] [PMC free article] [PubMed] [Google Scholar]
- Long EO, Dawid IB 1979. Restriction analysis of spacers in ribosomal DNA of Drosophila melanogaster. Nucleic Acids Res 7: 205–215 [DOI] [PMC free article] [PubMed] [Google Scholar]
- Losada A, Villasante A 1996. Autosomal location of a new subtype of 1.688 satellite DNA of Drosophila melanogaster. Chromosome Res 4: 372–383 [DOI] [PubMed] [Google Scholar]
- Lu J, Gilbert DM 2007. Proliferation-dependent and cell cycle regulated transcription of mouse pericentric heterochromatin. J Cell Biol 179: 411–421 [DOI] [PMC free article] [PubMed] [Google Scholar]
- Malone CD, Hannon GJ 2009. Small RNAs as guardians of the genome. Cell 136: 656–668 [DOI] [PMC free article] [PubMed] [Google Scholar]
- Manning JE, Schmid CW, Davidson N 1975. Interspersion of repetitive and nonrepetitive DNA sequences in the Drosophila melanogaster genome. Cell 4: 141–155 [DOI] [PubMed] [Google Scholar]
- Merrill PT, Sweeton D, Wieschaus E 1988. Requirements for autosomal gene activity during precellular stages of Drosophila melanogaster. Development 104: 495–509 [DOI] [PubMed] [Google Scholar]
- Miklos GL, Cotsell JN 1990. Chromosome structure at interfaces between major chromatin types: alpha- and beta-heterochromatin. Bioessays 12: 1–6 [DOI] [PubMed] [Google Scholar]
- Moriyama EN, Powell JR 1996. Intraspecific nuclear DNA variation in Drosophila. Mol Biol Evol 13: 261–277 [DOI] [PubMed] [Google Scholar]
- Palumbo G, Bonaccorsi S, Robbins LG, Pimpinelli S 1994. Genetic analysis of Stellate elements of Drosophila melanogaster. Genetics 138: 1181–1197 [DOI] [PMC free article] [PubMed] [Google Scholar]
- Probst AV, Okamoto I, Casanova M, El Marjou F, Le Baccon P, Almouzni G 2010. A strand-specific burst in transcription of pericentric satellites is required for chromocenter formation and early mouse development. Dev Cell 19: 625–638 [DOI] [PubMed] [Google Scholar]
- Ramirez-Solis R, Liu P, Bradley A 1995. Chromosome engineering in mice. Nature 378: 720–724 [DOI] [PubMed] [Google Scholar]
- Rasmussen IE 1960. Attached 2R;2L. Drosoph Inf Serv 34: 53 [Google Scholar]
- Riddle NC, Minoda A, Kharchenko PV, Alekseyenko AA, Schwartz YB, Tolstorukov MY, Gorchakov AA, Jaffe JD, Kennedy C, Linder-Basso D, et al. 2011. Plasticity in patterns of histone modifications and chromosomal proteins in Drosophila heterochromatin. Genome Res 21: 147–163 [DOI] [PMC free article] [PubMed] [Google Scholar]
- Ritossa F 1973. Crossing-over between X and Y chromosomes during ribosomal DNA magnification in Drosophila melanogaster. Proc Natl Acad Sci 70: 1950–1954 [DOI] [PMC free article] [PubMed] [Google Scholar]
- Scriba ME 1967. Embryonale Entwicklungsstorungen bei Defizienz und Tetraploidie des 2. Chromosoms von Drosophila melanogaster. Wilhelm Roux' Arch EntwMech Org 159: 314–345 [DOI] [PubMed] [Google Scholar]
- Scriba ME 1969. [Embryonale hypogenesis at nullosomy and tetrasomy of Drosophila melanogaster third chromosome]. Dev Biol 19: 160–177 [DOI] [PubMed] [Google Scholar]
- Smith CD, Shu S, Mungall CJ, Karpen GH 2007. The Release 5.1 annotation of Drosophila melanogaster heterochromatin. Science 316: 1586–1591 [DOI] [PMC free article] [PubMed] [Google Scholar]
- Smyth GK, Speed T 2003. Normalization of cDNA microarray data. Methods 31: 265–273 [DOI] [PubMed] [Google Scholar]
- Wieschaus E, Sweeton D 1988. Requirements for X-linked zygotic gene activity during cellularization of early Drosophila embryos. Development 104: 483–493 [DOI] [PubMed] [Google Scholar]
- Yamamoto MT, Mitchelson A, Tudor M, O'Hare K, Davies JA, Miklos GL 1990. Molecular and cytogenetic analysis of the heterochromatin-euchromatin junction region of the Drosophila melanogaster X chromosome using cloned DNA sequences. Genetics 125: 821–832 [DOI] [PMC free article] [PubMed] [Google Scholar]