Abstract
The kidney and inner ear CLC-K chloride channels, which are involved in salt absorption and endolymph production, are regulated by extracellular Ca2+ in the millimolar concentration range. Recently, Gradogna et al. (2010. J. Gen. Physiol. http://dx.doi.org/10.1085/jgp.201010455) identified a pair of acidic residues (E261 and D278) located in the loop between helices I and J as forming a putative intersubunit Ca2+-binding site in hClC-Ka. In this study, we sought to explore the properties of the binding site in more detail. First, we verified that the site is conserved in hClC-Kb and rClC-K1. In addition, we could confer Ca2+ sensitivity to the Torpedo marmorata ClC-0 channel by exchanging its I–J loop with that from ClC-Ka, demonstrating a direct role of the loop in Ca2+ binding. Based on a structure of a bacterial CLC and a new sequence alignment, we built homology models of ClC-Ka. The models suggested additional amino acids involved in Ca2+ binding. Testing mutants of these residues, we could restrict the range of plausible models and positively identify two more residues (E259 and E281) involved in Ca2+ coordination. To investigate cation specificity, we applied extracellular Zn2+, Mg2+, Ba2+, Sr2+, and Mn2+. Zn2+ blocks ClC-Ka as well as its Ca2+-insensitive mutant, suggesting that Zn2+ binds to a different site. Mg2+ does not activate CLC-Ks, but the channels are activated by Ba2+, Sr2+, and Mn2+ with a rank order of potency of Ca2+ > Ba2+ > Sr2+ = Mn2+ for the human CLC-Ks. Dose–response analysis indicates that the less potent Ba2+ has a lower affinity rather than a lower efficacy. Interestingly, rClC-K1 shows an altered rank order (Ca2+ > Sr2+ >> Ba2+), but homology models suggest that residues outside the I–J loop are responsible for this difference. Our detailed characterization of the regulatory Ca2+-binding site provides a solid basis for the understanding of the physiological modulation of CLC-K channel function in the kidney and inner ear.
INTRODUCTION
ClC-K channels were identified in rat and human kidney by sequence homology to other members of the CLC protein family (Uchida et al., 1993; Kieferle et al., 1994). Human ClC-Ka and ClC-Kb share 90% identical residues, whereas they have 80% identity to rodent ClC-K1 and ClC-K2 (Kieferle et al., 1994). CLC-K channels are not only expressed in the kidney but also in the inner ear (Uchida et al., 1993; Kieferle et al., 1994), and in both tissues they coassemble with the β subunit barttin (Birkenhäger et al., 2001; Estévez et al., 2001). In the kidney, ClC-K1 (ClC-Ka) is found in the thin ascending limb of Henle’s loop of the nephron, whereas ClC-K2 (ClC-Kb) is expressed in the basolateral membrane in the thick ascending limb (TAL), in the connecting tubule, in the distal convoluted tubule, and in both α and β intercalated cells of the collecting duct (Estévez et al., 2001). In the TAL, the concerted action of transporters (Na-K-ATPase and NKCC2) and channels (ROMK and ClC-Kb) allows for efficient NaCl reabsorption. In particular, ClC-Kb/barttin channels release Cl− from the basolateral membrane (Jentsch, 2005). In the inner ear, both isoforms are expressed in basolateral membranes of marginal cells of the stria vascularis and in dark cells of the vestibular organ. There, CLC-K/barttin channels act in concert with transporters and channels to maintain the high K+ concentration and the positive potential of the endolymph (Estévez et al., 2001; Rickheit et al., 2008; Zdebik et al., 2009).
Mutations in ClC-Kb cause Bartter syndrome (type III), a renal disease characterized by renal salt wasting (Simon et al., 1997). Mutations in both human isoforms (ClC-Ka and ClC-Kb; Schlingmann et al., 2004) or in BSDN, the gene encoding barttin, cause Bartter syndrome (type IV) with additional deafness (Birkenhäger et al., 2001). To date, human diseases associated only with ClC-Ka mutations have not been found. However, Clcnk1 knockout mice develop nephrogenic diabetes insipidus (Matsumura et al., 1999).
ClC-K channels are strongly activated by extracellular Ca2+ and inhibited by extracellular protons (Uchida et al., 1995; Estévez et al., 2001; Waldegger et al., 2002; Gradogna et al., 2010). Ca2+ and pH regulation of CLC-K channels are probably of physiological relevance (Gradogna et al., 2010). In fact, the kidney is involved in Ca2+ reabsorption and in maintenance of the acid–base balance. In particular, the voltage gradient that allows the paracellular flux of Ca2+ in the TAL is maintained by the basolateral release of Cl− and the apical release of K+ (Jeck et al., 2005). Interestingly, regulation by extracellular Ca2+ is only found in CLC-K channels but not in other CLC proteins. Previously, two acidic amino acid residues, E261 and D278, were identified as essential for the modulation of the ClC-Ka channel by extracellular Ca2+ (Gradogna et al., 2010). Such negatively charged residues are usually required for Ca2+ coordination in proteins (Elinder and Arhem, 2003). Based on the atomic structure of the bacterial EcClC and an alignment of ClC-Ka with EcClC, Gradogna et al. (2010) tentatively assigned the residues corresponding to E261 and D278 as E235 and N250 of Ec-ClC. Interestingly, although these two residues are both in the loop connecting helix I to helix J in a given subunit, they are quite far from each other structurally because of the long length of the I–J loop, whereas E261 from one subunit and D278 from the neighboring subunit are potentially close to each other. Consequently, Gradogna et al. (2010) speculated that these residues form a Ca2+-binding site at the subunit interface of ClC-Ka. In addition, H497 from helix Q was identified as the amino acid residue that is responsible for the proton-induced block. This histidine is relatively close to the putative Ca2+-binding site formed by E261 and D278 because helix Q is adjacent to helix J in the structure. Therefore, these residues define a novel region involved in the regulation of the gating of a CLC channel (Gradogna et al., 2010).
Ca2+ coordination likely requires additional residues beyond E261 and D278. Moreover the I–J loop is poorly conserved between EcClC and CLC-Ks, and it is not resolved in the crystallized CmClC (Feng et al., 2010). Thus, to obtain a more detailed insight into the molecular details of the Ca2+ regulation, here we further investigate the conservation of the binding site among CLC-K homologues and its specificity regarding various divalent cations, and we refine the description of the site itself. In addition, we demonstrate the direct involvement of the I–J loop containing E261 and D278 in the Ca2+-binding site by conferring Ca2+ sensitivity onto ClC-0 in a chimeric construct. We present a molecular model of ClC-Ka including the cation-binding site that allowed us to identify two additional residues involved in the Ca2+ coordination. Finally, although the cation-binding site is overall conserved among all CLC-K homologues, we find that the relative Ca2+/Ba2+ specificity is strikingly different between CLC-Ka and CLC-K1.
MATERIALS AND METHODS
Molecular biology
Mutations were inserted by recombinant PCR as described previously (Accardi and Pusch, 2003). All PCR products were sequenced. cRNA of CLC-K and ClC-0 constructs was transcribed in vitro using the mMessage mMachine SP6 kit (Ambion) after linearization with MluI. CLC-K constructs were coexpressed with the barttin mutant Y98 (Estévez et al., 2001). The cRNA of the barttin construct was prepared by T7 RNA polymerase (Ambion) after linearization with NotI. All WT cDNA constructs were provided by T.J. Jentsch (Leibniz Institute for Molecular Pharmacology and Max Delbrück Center for Molecular Medicine, Berlin, Germany).
Electrophysiology
After cRNA injection (Gradogna et al., 2010), oocytes were incubated at 18°C in the maintaining solution containing (in mM): 90 NaCl, 2 KCl, 1 MgCl2, 1 CaCl2, and 10 HEPES at pH 7.5. Voltage clamp measurements were performed 1–5 d after the injection, using the custom acquisition program GePulse and a Turbo TEC-03X amplifier (npi electronics). The experiments on CLC-K channels and the ClC-0/ClC-Ka chimera were performed at room temperature, whereas the temperature was kept at 26°C for the measurements of WT ClC-0 and its mutant V262E. The standard bath solution for experiments on CLC-Ks contained (in mM): 92 NaCl, 10 CaCl2, and 10 HEPES at pH 7.3 (osmolarity: 200 mosm). To evaluate the effect of the various divalent cations (Ba2+, Sr2+, Mg2+, Mn2+, and Zn2+), CaCl2 was replaced by BaCl2, SrCl2, MgCl2, MnCl2, and ZnCl2, respectively. In all solutions the chloride concentration was kept at 112 mM by varying the NaCl concentration. The osmolarity of the solutions at high cation concentration (20 and 50 mM) was adjusted by adding sucrose. Because Zn and Mn tended to form precipitates, the highest concentrations tested were 5 mM ZnCl2 and 10 mM MnCl2. To evaluate the Ca2+ sensitivity of the ClC-0 constructs, we used the solution “0 Ca2+” (in mM): 102 NaCl, 5 MgCl2, and 10 HEPES at pH 7.3 (osmolarity: 210 mosm) and the solution “50 Ca2+” containing (in mM) 12 NaCl, 50 CaCl2, 40 sucrose, and 10 HEPES at pH 7.3 (osmolarity: 200 mosm). The membrane was kept at a holding potential between −40 and −20 mV corresponding to the resting membrane potential in our conditions. ClC-K currents were assayed using the following protocol of stimulation (“IV-pulse” protocol; Gradogna et al., 2010). A prepulse to −100 mV for 100 ms was followed by voltages ranging from −140 to 80 mV with 20-mV increments for 200 ms and a tail pulse to 60 mV for 100 ms. The effect of the divalent cations on CLC-Ks was evaluated by applying repetitive pulses to 60 mV for 200 ms with a stimulation interval of 1 s and calculating the ratio between the mean stationary current in the specific cation solution and that in the standard bath solution. The contribution of endogenous and leak currents was estimated by applying a solution containing (in mM) 100 NaI, 5 MgSO4, and 10 HEPES at pH 7.3 that specifically blocks CLC-K channels (Picollo et al., 2004), and leak currents were subtracted.
Measurements on the ClC-0 constructs were performed at 0 and 50 mM Ca2+. The activation of the slow gate of ClC-0 constructs was monitored using the following (“slow gate”) protocol (Pusch et al., 1997). After progressively hyperpolarizing potential steps ranging from 40 to −140 mV for 5 s, the potential was stepped to 40 mV for 1 s. The currents measured at 40 mV were plotted versus the activating hyperpolarizing potentials and fitted by the modified Boltzmann function:
| (1) |
where Imax is the (estimated) maximum current level, Imin/Imax is the relative offset, V1/2 is the voltage of half-maximal activation, and k is the slope factor. After full activation of the slow gate, the fast gate of ClC-0 constructs was assayed by the following (“fast gate”) protocol (Pusch et al., 1995). A prepulse to 60 mV for 50 ms was followed by pulses to voltages ranging from −160 to 80 mV with 20-mV increments for 100 ms. Pulses ended with a tail pulse to −100 mV for 100 ms. The tail currents at −100 mV were extrapolated to the start of the tail pulse and fitted by an equation similar to Eq. 1 (Ludewig et al., 1997a). The same protocol was used to estimate the current at −100 mV of ClC-0 constructs in the virtual absence of Ca2+ and in 50 mM Ca2+. To evaluate the deactivation of the slow gate of ClC-0 constructs, after maximal activation of the slow gate by hyperpolarizing voltage steps, currents were continuously recorded by repetitive 100-ms pulses to 40 mV at 0.5 Hz. The time constant (τ) of deactivation was determined by fitting a single exponential function to the decaying currents as described in Pusch et al. (1997).
Sequence alignments
A set of sequence homologues of human ClC-Ka were obtained by using three iterations of PSI-BLAST using the NCBI BLAST server (Johnson et al., 2008) against the nonredundant (nr) sequence database dated 25.8.2011, with an inclusion E value of 0.001, obtaining 231 homologues. These sequences were clustered to reduce their redundancy using CD-HIT (Li et al., 2001, 2002) such that pairs of sequences with 60% sequence identity or above were grouped in the same cluster. The set of representative sequences from each of the resultant 94 clusters was then further filtered by selecting only those belonging to the branch of the phylogenetic tree that included both the query (ClC-Ka) and template (EcClC) sequences. A multiple sequence alignment of these 31 sequences was then generated using T-coffee version 5.31 (Notredame et al., 2000).
The initial multiple sequence alignment was then refined by (a) removing gaps in the secondary structure elements, (b) ensuring that conserved residues face the core of the protein using the conservation score for each position calculated with the ConSurf server (Landau et al., 2005; Ashkenazy et al., 2010), and (c) considering also the pairwise alignment between ClC-Ka and EcClC generated using AlignMe 1.0 (Khafizov et al., 2010), using the VTML substitution matrix, hydrophobicity profiles, and PSIPRED secondary structure predictions of the sequences. For AlignMe, the following penalties were applied: 12.5 and 3.1 for opening gaps at positions below and above the hydrophobicity threshold (which was −0.5), respectively; 1.4 and 3.3 for extending gaps below and above the threshold, respectively; and 1.2 for adding gaps at the termini. To make the hydrophobicity profiles, the Hessa et al. (2007) scale was window-averaged using a 13-residue-long triangular window. The relative weights of the different inputs were 0.2 for VTML, 1.0 for the hydropathy profile, and 1.4 for the secondary structure prediction.
The specific adjustments to the T-coffee alignment were as follows. To improve the alignment of secondary structure elements consistent with the results of AlignMe, we adjusted three regions. First, residues Q12 to L26 of helix A in EcClC were shifted by four positions. Second, residues L319 to F328, including helix L of EcClC, were aligned to residues W388 to T397 of ClC-Ka. And third, residues G441 to L461 (helix R) in EcClC were shifted to match the secondary structure elements. In addition, residues P248 to N250 in EcClC were shifted by two positions to remove gaps at the beginning of helix J.
Homology modeling
Models of ClC-Ka were built using the 3.5-Å resolution x-ray crystal structure of EcClC (PDB accession no. 1KPK; Dutzler et al., 2002) as a template, which has 16% identical residues according to the alignment in Fig. 1. Note that three residues at the beginning of the I–J loop (residues N233 to E235 in EcClC) were excluded as part of the template, which improved the conformation of residues 254–257 of that loop in ClC-Ka such that their backbone dihedral angles moved from generously allowed or disallowed regions of the Ramachandran plot to the most favored regions of the plot. In addition, part of the loop between helices K and L was not modeled (residues 348–386 of ClC-Ka) because no equivalent region is present in the template.
Figure 1.
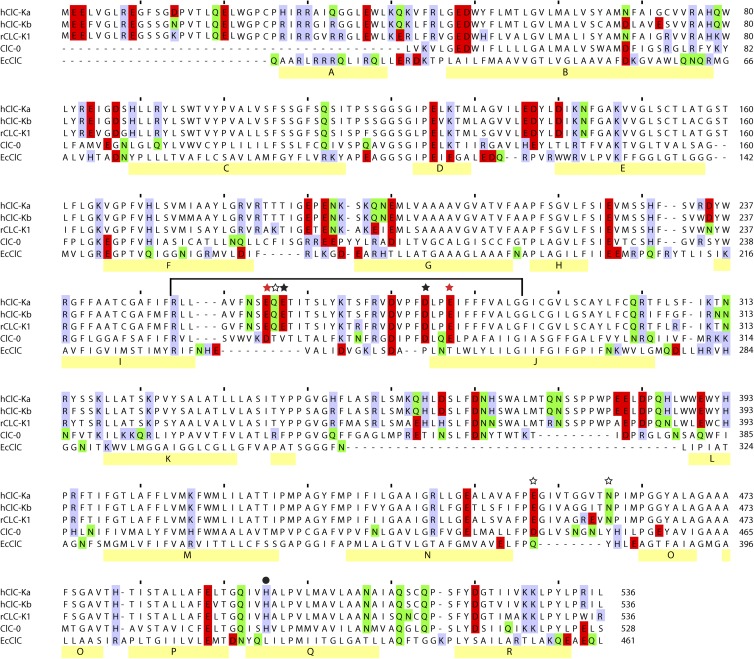
Sequence alignment of ClC-Ka, ClC-Kb, rClC-K1, ClC-0, and EcClC. Residues shown to be important for the Ca2+ response previously (black stars; Gradogna et al., 2010) or in the present study (red stars) are highlighted, as are those that are implicated by the models but that do not show any impact on the Ca2+ response (open stars). The histidine residue responsible for the proton activation of ClC-Ka is marked with a circle. The line indicates the fragment of ClC-0 replaced by the corresponding ClC-Ka sequence in the ClC-0/ClC-Ka chimera. The C-terminal 150 residues of the ClC-K channels are omitted for clarity, as are the terminal residues of ClC-0. Polar (N and Q; green), basic (K, H, and R; lavender), and acidic (E and D; red) residues are also highlighted. The α-helical segments of EcClC are indicated with yellow bars (helices A–R). This alignment is a revised version of a previously proposed alignment (Gradogna et al., 2010; see Materials and methods).
Based on this alignment, the 10 models with the best Modeller molpdf score were selected from an initial set of 1,000 models generated with Modeller 9v2 (Sali and Blundell, 1993). The distance between the Ca2+ ions and the oxygen atoms of residues E261 and D278, which are known to be involved in the Ca2+ coordination (Gradogna et al., 2010), was constrained to be around 3.3 Å. Ion to side chain distances were calculated for the 200 top-scoring models and subsequently clustered using a 4 × 4–grid Kohonen self-organizing map as implemented in Canvas version 1.5 (Schrödinger Inc.).
A final model, intended to be consistent with all earlier data as well as the work presented here, was then built. In this case, twofold symmetry was imposed on the two protomers, as was a distance of 2.7 Å between the Ca2+ ion and one side chain oxygen atom each from E259, E261, D278, and E281 (see Fig. 5 B), and a single model was selected as that with the lowest molpdf score out of 1,000 Modeller models. A model of ClC-K1 was also constructed in the same way using the alignment in Fig. 1.
Figure 5.
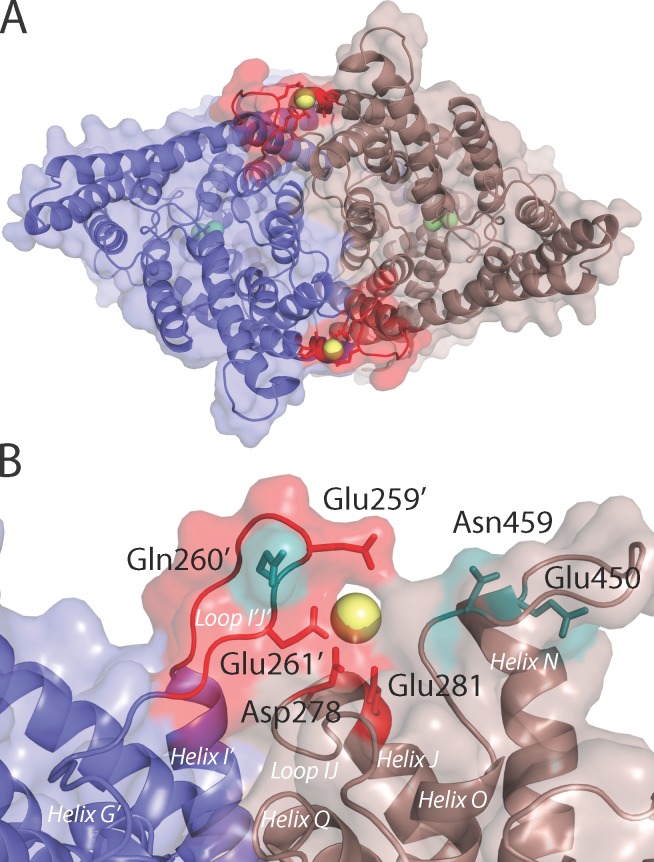
Model of the ClC-Ka dimer containing two bound Ca2+ ions. (A) The model of ClC-Ka viewed from the extracellular surface. The two protomers are represented by ribbons (lavender and brown), as well as the van der Waals surface. The Ca2+ and Cl− ions are shown as spheres (yellow and green, respectively). Part of the I–J loop (residues 254–263) is highlighted (red), and the side chains of residues E259, E261, D278, and E281, which are required for the Ca2+ response, are shown as sticks. (B) Close-up view of one of the Ca2+-binding sites in the experimentally validated model of ClC-Ka. The coloring is the same as in A, except that Q260, E450, and N459 are also shown (teal sticks) and specific residues and helices are labeled; those belonging to the lavender-colored protomer are marked with a prime (′).
Online supplemental material
Fig. S1 depicts typical current traces of ClC-Kb and its mutants at different [Ca2+]ext. Fig. S2 shows the deactivation of the slow gate of WT and V262E ClC-0 at 0 and 50 [Ca2+]ext. In Fig. S3 the gating parameters (see Eq. 1), V1/2 and Imin/Imax, of WT ClC-0, V262E ClC-0, and the chimera are plotted versus [Ca2+]. Fig. S4 represents the conservation pattern of the I–J loop in the ClC-Ka model based on the new alignment proposed in Fig. 1. Fig. S5 shows an alternative model of Ca2+ coordination that does not involve E281. Fig. S6 depicts the effect of the divalent cations on ClC-Kb currents. Fig. S7 compares the model of ClC-K1 with that of ClC-Ka. Fig. S8 illustrates the effect of Ca2+, Ba2+, and Sr2+ on the mutant S270R ClC-Ka. Fig. S9 shows that the currents of E261Q/D278N ClC-K1 are not affected by Ca2+, Ba2+, Sr2+, and Mg2+. Online supplemental material is available at http://www.jgp.org/cgi/content/full/jgp.201210878/DC1.
RESULTS
The Ca2+-binding site is conserved in CLC-K channels
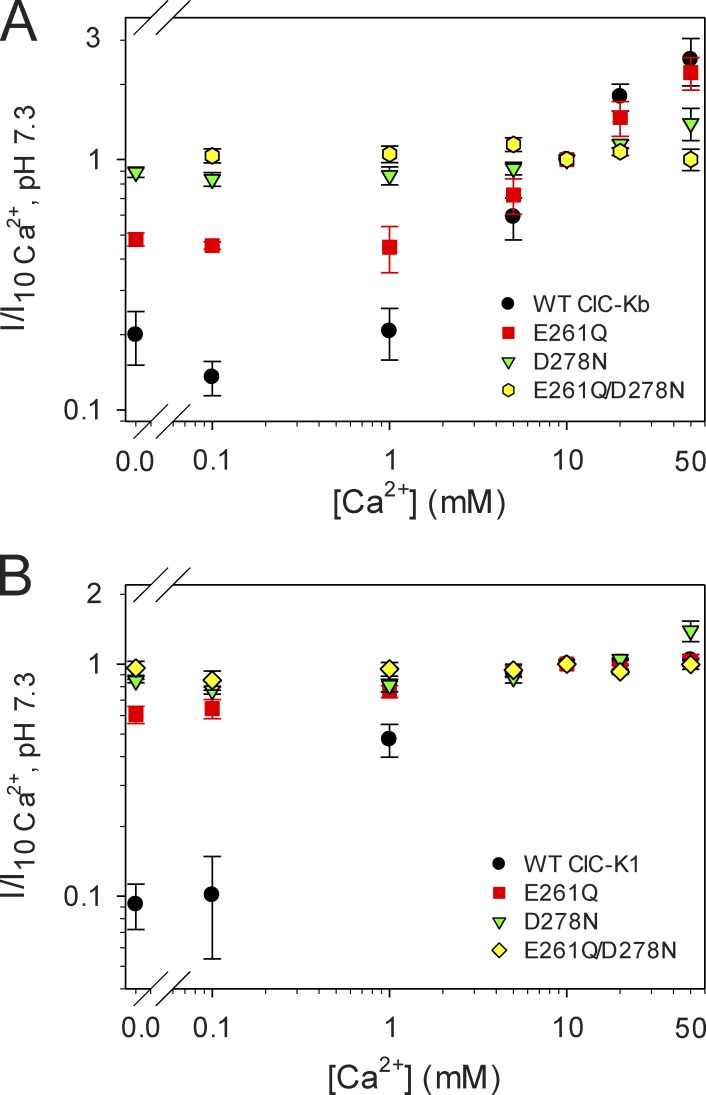
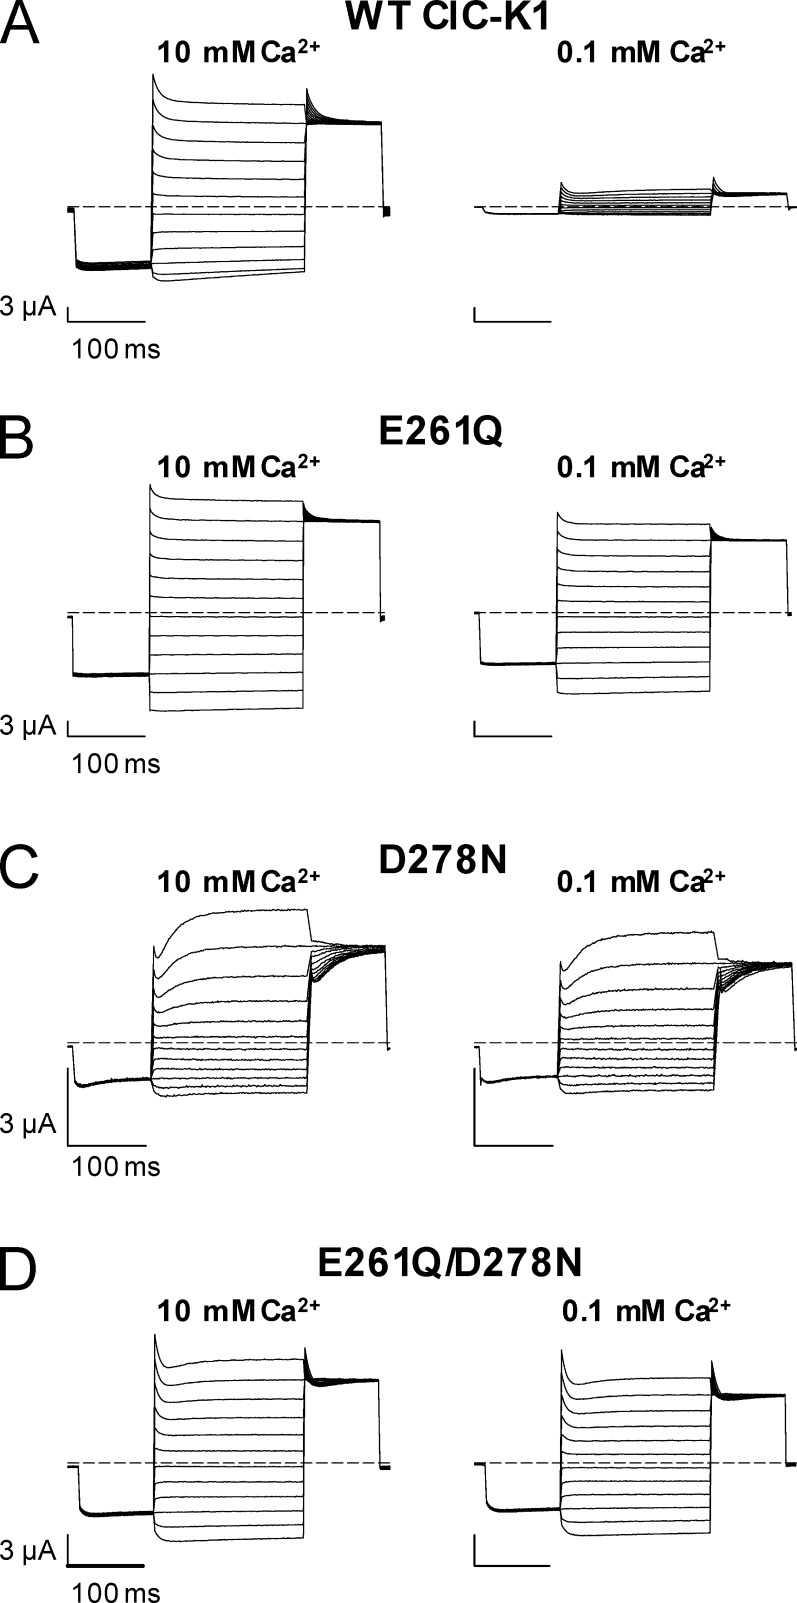
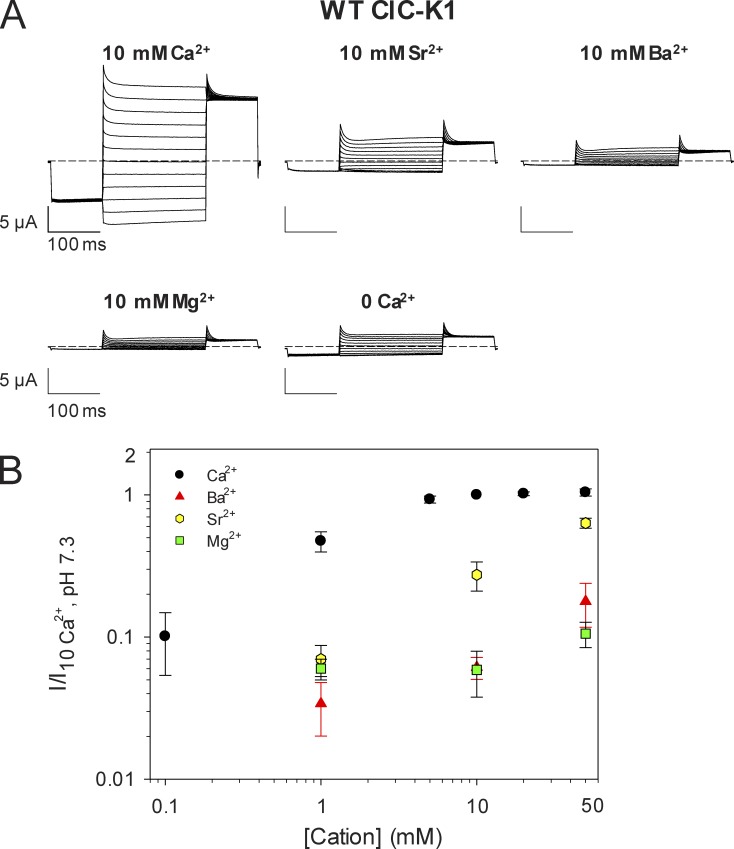
The loop between helices I and J, which includes the residues E261 and D278 that were previously identified as being important for Ca2+ modulation of CLC-Ka (Gradogna et al., 2010), is highly conserved in CLC-K channels (Fig. 1). ClC-Ka and ClC-Kb are 100% identical in that loop, whereas three substitutions are found in rat ClC-K1 compared with the human CLC-K channels (G254 instead of A254, I266 instead of L266, and R270 instead of S270; Fig. 1). As for ClC-Ka, the currents of ClC-Kb increase with increasing Ca2+ concentrations (Estévez et al., 2001; Waldegger et al., 2002), without saturation up to 50 mM (Fig. 2 A; Gradogna et al., 2010). Interestingly, the rat ClC-K1 channel is actually more Ca2+ sensitive than the human CLC-K channels (Waldegger et al., 2002). In fact, even at 1 mM Ca2+, ClC-K1 currents are ∼47% of the maximum level recorded at high Ca2+, and they reach saturation at ∼10 mM Ca2+ (Fig. 2 B), whereas human CLC-K channels at 1 mM Ca2+ yield currents that are less than ∼10% of the currents recorded at 50 mM Ca (Fig. 2 A; Gradogna et al., 2010). Similar to what was previously shown for ClC-Ka and ClC-Kb (Gradogna et al., 2010), Ca2+ is not strictly essential for ClC-K1 opening: currents measured at nominal 0 Ca2+ are ∼10% of the currents at 10 mM Ca2+ (Fig. 2 B). The high sequence identity and the conserved Ca2+ sensitivity suggest that the Ca2+-binding site is a characteristic shared by all CLC-K channels. To test this, we inserted the single E261Q and D278N mutations as well as the E261Q/D278N double mutation in ClC-Kb and ClC-K1. Current traces of ClC-Kb and ClC-K1 WT and the mutants are shown in Fig. S1 and Fig. 3, respectively. Distinct from what was found previously for ClC-Ka (see Fig. 6 C in Gradogna et al. [2010]), in ClC-K1, the mutant D278N displays altered rectification and kinetics compared with WT (Fig. 3 C). However, similar to ClC-Ka, the mutant abolished Ca2+ sensitivity to a large extent. Both ClC-Kb and ClC-K1 single mutants lost most of their Ca2+ sensitivity, whereas the double mutants E261Q/D278N were completely Ca2+ insensitive (Fig. 2, A and B). Thus, we can conclude that the regulatory Ca2+-binding site formed by E261 and D278 is conserved in CLC-K channels.
Figure 2.
Conservation of the Ca-binding site in CLC-K channels. (A) Effect of [Ca2+]ext on WT ClC-Kb (n ≥ 5, except 0.1 mM Ca2+ for which n = 2) and its mutants E261Q (n ≥ 3, except 0 mM Ca2+ for which n = 2), D278N (n ≥ 4, except 0 mM Ca2+ for which n = 2), and E261Q/D278N (n ≥ 3, except 5 and 20 mM Ca2+ for which n = 2). Mean currents at 60 mV measured in different Ca concentrations (0, 0.1, 1, 5, 10, 20, and 50 mM) were normalized to the value measured in standard bath solution (10 mM Ca2+) and plotted versus [Ca2+]ext. (B) Effect of [Ca2+]ext on WT ClC-K1 (n ≥ 5, except 5 mM Ca2+ for which n = 3) and its mutants E261Q (n = 3), D278N (n ≥ 3, except 0.1 mM Ca2+ for which n = 2), and E261Q/D278N (n ≥ 3). Error bars indicate SD.
Figure 3.
Effect of [Ca2+]ext on WT ClC-K1 and its mutants E261Q, D278N, and E261Q/D278N. (A–D) Typical current traces of WT ClC-K1 (A), E261Q (B), D278N (C), and E261Q/D278N (D) evoked by the standard IV-pulse protocol (see Materials and methods) at 10 and 0.1 mM Ca2+, pH 7.3.
Conferring Ca2+ sensitivity onto ClC-0
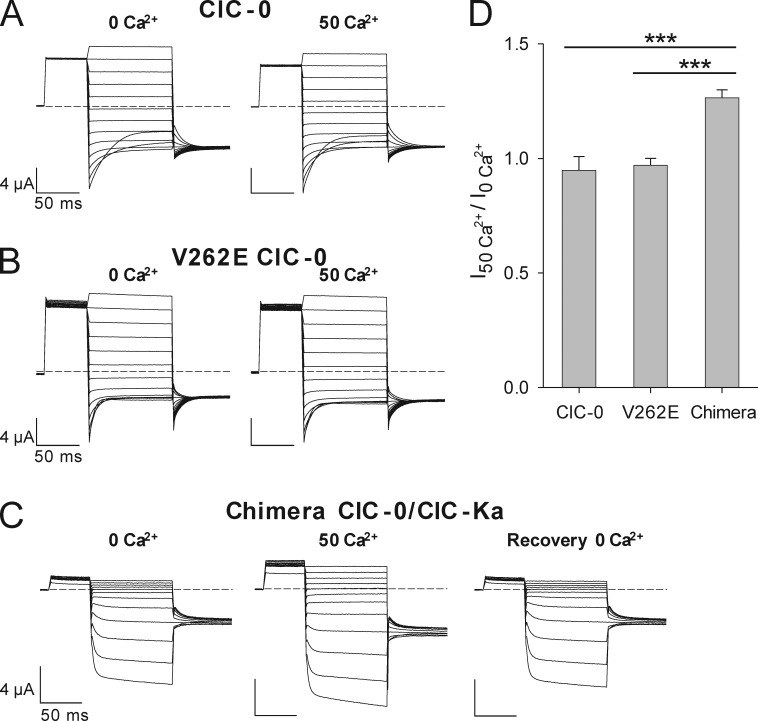
The Ca2+ sensitivity found in CLC-K channels has not been observed in other CLC proteins. Here, we tried to confer this property to a well characterized member of the CLC family: the ClC-0 channel from the Torpedo marmorata electric organ (Jentsch et al., 1990; Ludewig et al., 1996, 1997c; Pusch et al., 1997; Fong et al., 1998). We chose ClC-0 because it is ∼39% identical to CLC-K channels (Uchida et al., 1993) and because it shows a high level of expression. The alignment of CLC-Ks and ClC-0 shows that the residue D278 is conserved and corresponds to D279 in ClC-0, whereas the CLC-K residue E261 is substituted by V262 in ClC-0 (Fig. 1). Therefore, attempting to confer Ca2+ sensitivity to ClC-0, we mutated ClC-0–V262 to glutamate. The V262E mutant was functional and overall similar to WT ClC-0 (Fig. 4, A and B; and Fig. S2, A and B). Because ClC-0 exhibits two gating mechanisms, a fast protopore gate and a slow common gate that acts by opening and closing of both the pores of the channel (Ludewig et al., 1996), we tested whether the mutant specifically affects one of them. While the fast gate was indistinguishable from that of WT ClC-0 (Fig. S3 C), the mutant V262E showed an altered slow gate. In particular, the slow gate deactivated more quickly (Fig. S2, C–E) and to a larger extent at positive voltages (Fig. S2, C and D; and Fig. S3 B). Also, the voltage of half-maximal activation, V1/2, was slightly different in the mutant (Fig. S3 A). Most relevant to the current study, however, is the finding that none of these parameters were altered by changing the Ca2+ concentration from 0 to 50 mM (Fig. S2, C–E; and Fig. S3, A–C). In addition, the absolute current densities of WT ClC-0 and of the mutant V262E were not affected by 50 mM Ca2+ (Fig. 4 D). In summary, the mutation V262E modifies the slow gate but does not confer Ca2+ sensitivity onto ClC-0.
Figure 4.
Conferring Ca2+ dependence onto ClC-0. Typical currents of ClC-0 constructs evoked by the fast gate protocol (see Materials and methods) at nominal 0 and at 50 mM Ca2+. (A–C) Currents of WT ClC-0 (A) and its mutant V262E (B) are not affected by increasing external Ca2+, whereas currents of the ClC-0/ClC-Ka chimera (C) are potentiated. (D) Effect of 50 mM Ca2+ on the current magnitude of WT ClC-0 (n = 4), V262E ClC-0 (n = 5), and chimera ClC-0/ClC-Ka (n = 8). Currents acquired at −100 mV at 50 mM Ca2+ concentration were normalized to the values recorded at nominal 0 Ca2+. WT ClC-0 and mutant V262E currents were recorded after maximal activation of the slow gate by repetitive hyperpolarization. Potentiation of the chimera by Ca2+ is highly significant, as indicated by the asterisks (***, p-values of I50Ca2+/I0Ca2+ between chimera and WT ClC-0 or chimera and V262E are < 0.5 × 10⁻⁶, unpaired Student’s t test). Error bars indicate SD.
In a further attempt, we constructed a chimera in which the whole I–J loop of ClC-0 was replaced by the corresponding ClC-Ka fragment (from ClC-Ka-R251 to ClC-Ka-G289; Fig. 1). This construct exhibited functional characteristics different from those of WT ClC-0. In fact, whereas WT ClC-0 shows large currents at positive potentials and partially deactivates at negative potentials (Fig. 4 A), the chimera exhibits very small currents at positive voltages, whereas it is activated by hyperpolarizing potentials (Fig. 4 C). The voltage dependence of this activation resembles the common gate of ClC-0. However, because of the much faster kinetics, we cannot confidently assign the gating process of the chimera to either the protopore gate or the common gate of ClC-0. Because investigating this topic is beyond the scope of this study, we concentrated our attention on possible effects of extracellular Ca2+. For this purpose, we compared the currents recorded at −100 mV in the virtual absence of Ca2+ with those in 50 mM Ca2+. Currents of WT ClC-0 or its mutant V262E do not change upon varying the Ca2+ concentration (Fig. 4 D). Instead, the chimera shows a relatively small, but highly significant Ca2+ sensitivity (Fig. 4, C and D). In fact, at 50 mM Ca2+, the currents are ∼26% larger than the currents at nominal 0 Ca2+ (Fig. 4, C and D). This effect is completely reversible (Fig. 4 C) and present at all negative potentials tested (not depicted). Varying external Ca2+ concentration does not affect significantly the voltage of half-maximal activation, V1/2, or the ratio Imin/Imax of the chimera (Fig. S3, D and E). Thus, the precise mechanism underlying the induced Ca2+ regulation is not clear from this macroscopic analysis, which does not allow effects on the fast protopore gate and the common gate to be discriminated. Importantly, however, transplanting the extracellular I–J loop from ClC-Ka to ClC-0 is sufficient to confer Ca2+ sensitivity to ClC-0. This result further strengthens the hypothesis that the I–J loop, and in particular residues E261 and D278, directly contribute to the Ca2+-binding site, rather than allosterically mediating the effect of Ca2+ binding to a more remote site.
Molecular model of a CLC-K channel
Because of their relatively low homology to CLC-K channels, the structures of the CLC proteins that have been reported to date (Dutzler et al., 2002; Feng et al., 2010; Jayaram et al., 2011) cannot provide any direct insight into the molecular structure of the Ca2+-binding site of CLC-K channels. In particular, the I–J loop that contains two residues responsible for Ca2+ binding, E261 and D278, is poorly conserved (Fig. 1), and in the case of CmClC is not resolved (Feng et al., 2010). However, such structural information could help to identify additional residues that are expected to coordinate the Ca2+ ion and ultimately help determine the mechanism of activation. To this end, we built a homology model of one of the CLC-K channels, ClC-Ka, based primarily on the structure of EcClC but also taking into account the fact that E261 and D278 are known to contribute to the Ca2+-binding site (Gradogna et al., 2010).
The most critical factor affecting the accuracy of a homology model is the alignment between the sequences of the protein being modeled (ClC-Ka) and that of the template structure (EcClC; Forrest et al., 2006). Here, we improved upon the alignment proposed in the previous work (Gradogna et al., 2010) by including information from more homologous sequences and from secondary structure predictions (see Materials and methods; Fig. 1). In particular, the I–J loop now has a more reasonable conservation pattern, such that more evolutionarily variable residues face away from the protein in the corresponding model (Fig. S4). A quantitative measure of the extent to which conserved residues are buried, the ConQuass score (Kalman and Ben-Tal, 2010), has a value of 0.154 ± 0.005 for the top 10 models of ClC-Ka, which is a statistically significant improvement compared with models based on the previous alignment, whose scores were 0.146 ± 0.006 (P < 0.01 using the Student’s t test; the ConQuass score of the template EcCLC structure is 0.254).
After the adjustments to the alignment, residues E261 and D278 in the new models of ClC-Ka are positioned near the dimer interface (Fig. 5, A and B) rather than at the lipid–protein interface. These two residues were constrained to interact with the Ca2+ ion during the model building. Nevertheless, their altered local environment suggests putative interaction partners, which we identified as E259, Q260, E281, E450, and N459, in addition to E261 and D278. By clustering the ion-oxygen distances (see Materials and methods), two distinct Ca2+-binding modes (Fig. 5 B and Fig. S5) could be identified, which reflect differences in the orientations of the loops. In both binding modes, the side chain oxygen atoms of residues E259, Q260, E450, and N459 would be in close proximity to the Ca2+ ion. The main difference between the two possible binding modes is the involvement of E281, which participates in the Ca2+ coordination in one binding mode (Fig. 5 B) but not in the other (Fig. S5).
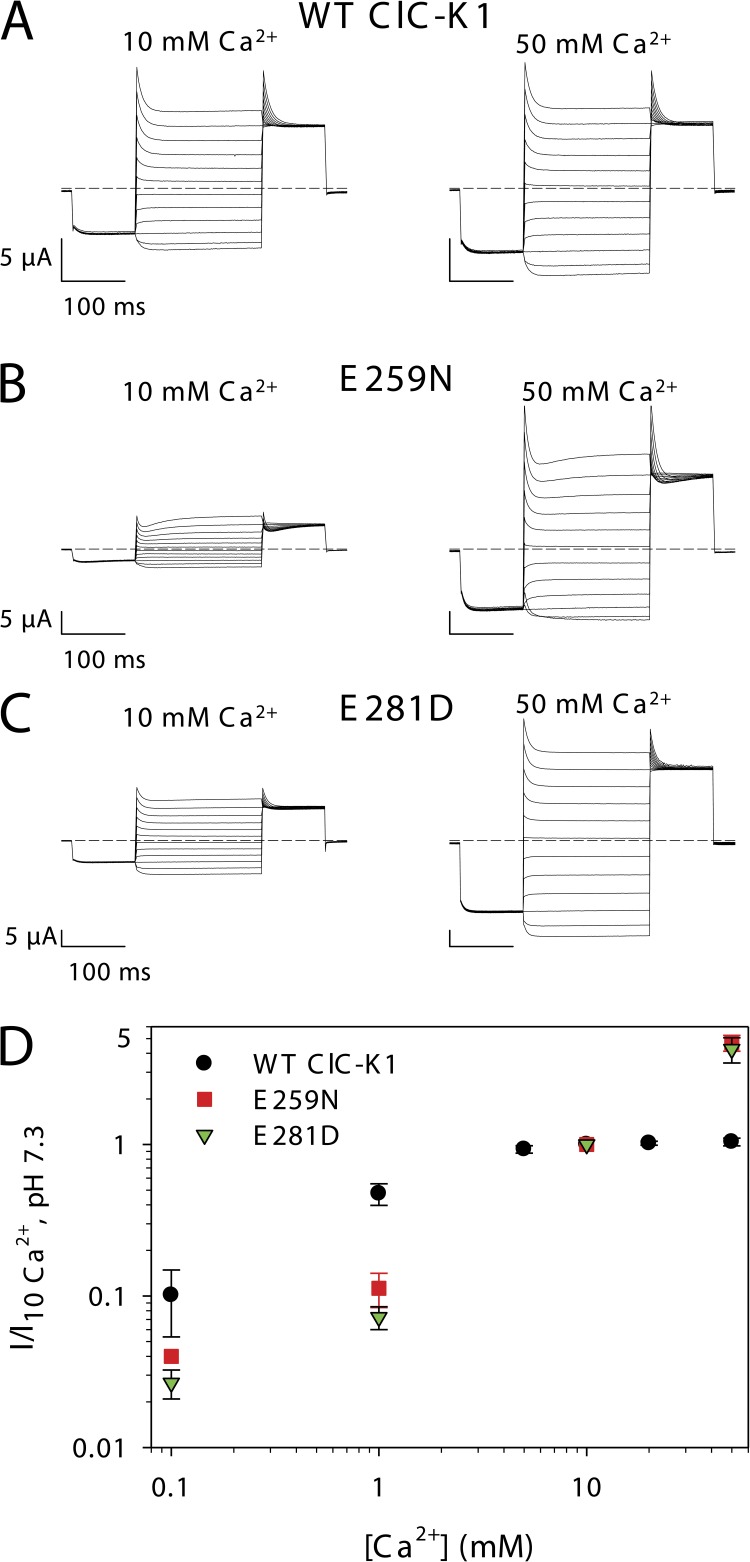
All of these residues, except for N459, were already previously mutated and tested for their involvement in Ca2+ sensitivity of ClC-Ka (Gradogna et al., 2010). We now carefully reexamined the results for each of the mutants in the light of the model. Q260 and E450 could safely be excluded from consideration because the respective mutants Q260A and E450Q showed normal functional expression and no significantly modified Ca2+ sensitivity compared with WT ClC-Ka (Gradogna et al., 2010). In addition, the newly constructed mutant N459A of ClC-Ka exhibited a behavior similar to WT ClC-Ka (not depicted). However, residues E281 and E259 warranted further investigation. Previously, E259 of ClC-Ka was mutated to several residues (E259A, E259C, E259D, E259N, and E259Q), but only E259D and E259N yielded very small currents that were barely above background (Gradogna et al., 2010). Similarly, E281D ClC-Ka showed very low functional expression, whereas no currents different from the background could be measured for the mutant E281Q (Gradogna et al., 2010). Because of the small currents exhibited by these ClC-Ka mutants, it is difficult to draw a firm conclusion regarding their Ca2+ dependence. Because rat ClC-K1 exhibits much larger currents than human ClC-Ka (Fig. 6 A), we decided to study mutants of E259 and E281 in the background of this channel. In this case, we could detect sizable currents for the charge-neutralizing mutant E259N and for the conservative mutant E281D. Unfortunately, the less conservative mutation of E281 (i.e., E281Q) did not yield functional expression. Interestingly, however, the two other mutants (E259N and E281D) display altered Ca2+ sensitivity compared with WT ClC-K1 (Fig. 6, A–C). In fact, as mentioned in the section The Ca2+-binding site is conserved in CLC-K channels, WT ClC-K1 is highly Ca2+ responsive with currents at 0.1 mM Ca2+ being about ∼10% of the current in 10 mM Ca2+ (Fig. 6 D), and currents are already saturated at 10 mM Ca2+ (Fig. 6, A and D). In contrast, the currents of E259N and E281D at 0.1 mM Ca2+ are only ∼4% and ∼3% of the current in 10 mM Ca2+, respectively (Fig. 6 D). Moreover, currents of both mutants increase more than fourfold between 10 and 50 mM Ca2+ (Fig. 6, B–D). This most likely reflects a reduced affinity for Ca2+ binding and is in agreement with an involvement of E259 and E281 in Ca2+ coordination. Thus, the model in which E281, in addition to E259, contributes to the binding site is consistent with all the available experimental data (Fig. 5, A and B).
Figure 6.
Involvement of other residues in CLC-K Ca2+ dependence. (A–C) Voltage clamp traces of oocytes expressing WT ClC-K1 (A), E259N ClC-K1 (B), or E281D ClC-K1 (C) in response to the IV-pulse protocol (see Materials and methods) at 10 and 50 mM Ca2+. (D) Currents of WT ClC-K1 and its mutants E259N and E281D recorded at 60 mV were normalized to the currents measured in standard bath solution (10 mM Ca2+) and plotted versus the Ca2+ concentration. Data for WT ClC-K1 are the same as in Figs. 2 B and 10 B (for E259N n = 4, except 0.1 mM Ca2+ for which n = 2; for E281D n = 4, except 0.1 mM Ca2+ for which n = 3). Error bars indicate SD.
Specificity of the Ca2+-binding site in ClC-Ka
To investigate the ion specificity of the Ca2+-binding site, we tested the effect of several divalent cations on WT ClC-Ka and its double mutant E261Q/D278N. In particular, we considered other members of the alkaline earth metal group: Mg2+, Sr2+, and Ba2+ that share the same external electron configuration and reactivity as Ca2+. These cations readily form complexes with ligands that have carboxyl and carbonyl groups (Elinder and Arhem, 2003). Additionally, we studied the effect of two other metals, Mn and Zn that are mainly in the doubly ionized form (Mn2+ and Zn2+) in physiological solutions (Elinder and Arhem, 2003). Both of these metals can be coordinated by the carboxylate group of glutamate and aspartate. Thus, all of these divalent ions can be considered mimetics of Ca2+ ions.
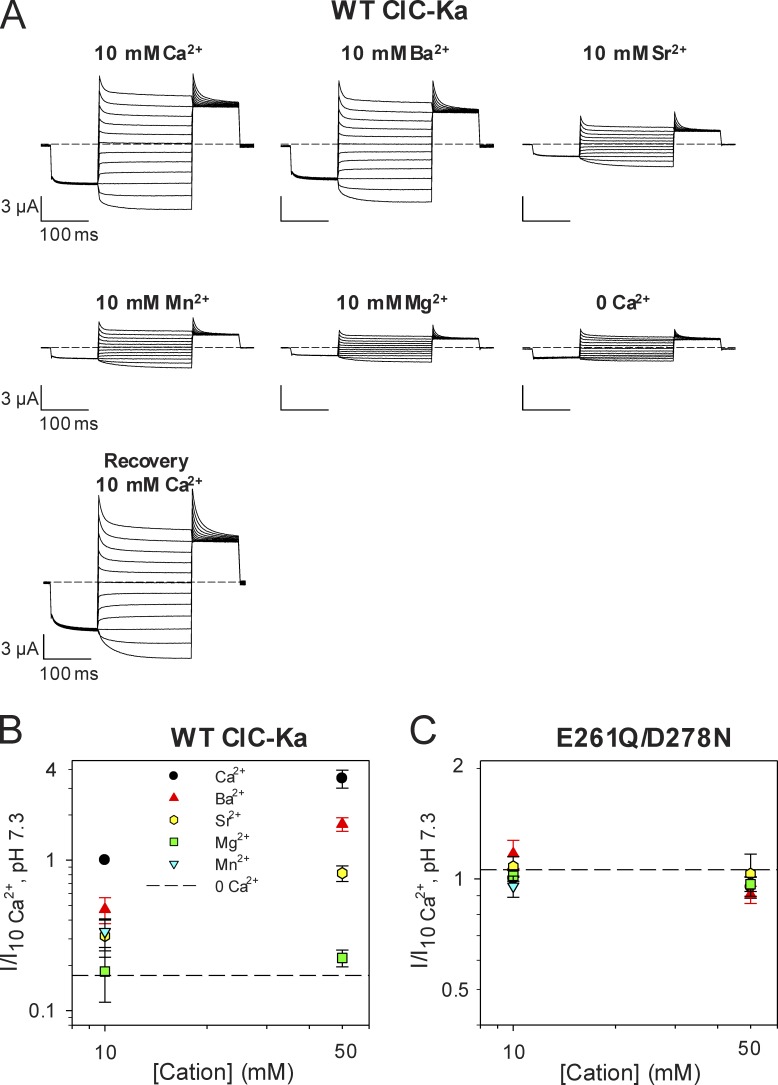
A typical experiment was performed in the following way: first, ClC-Ka currents were measured in the standard solution (i.e., 10 mM Ca2+ and pH 7.3); next, Ca2+ was completely replaced with another cation and currents were monitored with brief test pulses until steady-state was reached. Lastly, the IV-pulse protocol (see Materials and methods) was applied. This procedure was repeated for all tested cations at different concentrations. At the end of the experiments, the standard solution was applied to verify the stability of the currents. Fig. 7 A shows example recordings from one oocyte. Because ClC-Ka exhibits currents even in the absence of Ca2+, the current recorded at 0 Ca2+ is a good measure of the functional expression of the channel in the absence of any activating divalent cation. These measurements demonstrate that Mg2+ does not activate ClC-Ka at concentrations up to 50 mM, whereas the channel is activated by Ba2+, Sr2+, and Mn2+. The rank order of potency is Ca2+ > Ba2+ > Sr2+ = Mn2+ >> Mg2+ (Fig. 7, A and B). Interestingly, this selectivity sequence corresponds to sequence III of the seven sequences reported by Diamond and Wright (1969) for cation binding to zeolites. Moreover, we established that the Ca2+-insensitive double mutant E261Q/D278N is also Ba2+, Sr2+, and Mn2+ insensitive (Fig. 7 C). This demonstrates that Ca2+, Ba2+, Sr2+, and Mn2+ act through a common mechanism and interact with the same binding site (possibly formed by E259, E261, D278, and E281 at the subunit interface).
Figure 7.
Ion specificity of the Ca2+-binding site of ClC-Ka. (A) Voltage clamp traces of WT ClC-Ka in response to the IV- pulse protocol (see Materials and methods). The currents were measured from the same oocyte in different conditions (at 10 mM Ca2+, Ba2+, Sr2+, Mn2+, or Mg2+ concentration, pH 7.3) and compared with the currents recorded at nominal 0 Ca2+ and in the absence of divalent cations. (B and C) Effect of several divalent cations on WT ClC-Ka (B) and its mutant E261D/D278N (C). Currents acquired at 60 mV were normalized to the currents measured in standard solution (10 mM Ca2+, at pH 7.3) and plotted as a function of cation concentration. The dashed lines represent the mean current level in the nominal absence of divalents. The number of oocytes measured was n ≥ 11 for WT ClC-Ka (except 50 mM Mg2+ for which n = 5, and 10 mM Mn2+ for which n = 6); n ≥ 4 for E261D/D278N (except 10 mM Mg2+ for which n = 3, and 10 mM Mn2+ for which n = 2). Error bars indicate SD.
An outsider ion: Zn2+
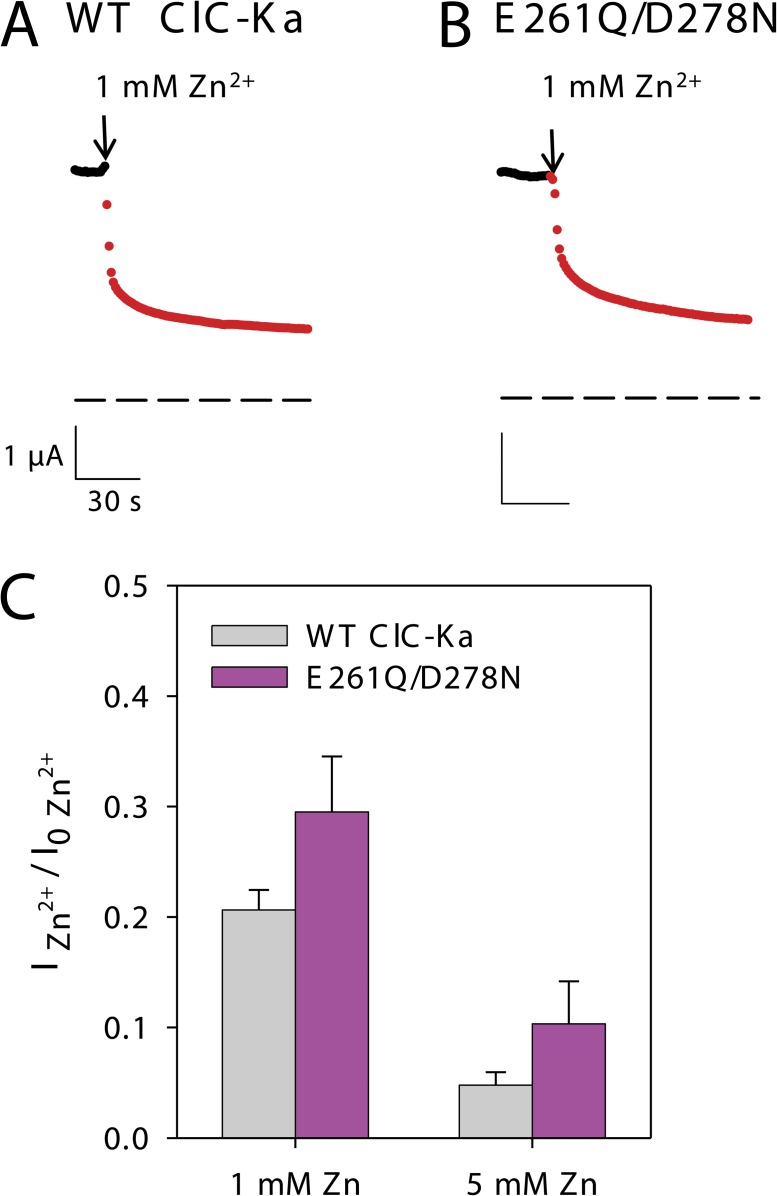
Modulation of CLC proteins by Zn2+ is very common. Extracellular Zn2+ was found to reversibly block ClC-0 (Chen, 1998) and ClC-2 (Clark et al., 1998), whereas it inhibits ClC-1 irreversibly (Kürz et al., 1997). In particular, Zn2+ inhibition of ClC-0 and ClC-1 seems to be related to the slow/common gating mechanism that acts by opening and closing both pores of these channels (Chen, 1998; Duffield et al., 2005). Indeed, the C212S mutation in ClC-0 and the equivalent C277S in ClC-1 that lock these channels in the open state also abolish Zn2+ inhibition (Lin et al., 1999; Duffield et al., 2005). In contrast, three consecutive extracellular histidines were proposed to be involved in Zn2+ inhibition of the Cl−/H+ antiporter ClC-4 (Osteen and Mindell, 2008). Here, we tested the effect of Zn2+ on CLC-K channels. In contrast to the activating effect of Ca2+ and of the other aforementioned divalent cations, ClC-Ka is reversibly inhibited by Zn2+ (Fig. 8, A and C). This effect is dose dependent. In fact, keeping [Ca2+] constant at 10 mM, ClC-Ka currents at 1 mM Zn2+ are 20 ± 6% (standard error) of those measured in the absence of Zn2+, whereas at 5 mM Zn2+ the currents are ∼5 ± 3% (standard error) of the control (Fig. 8 C). To investigate the hypothesis that Zn2+ could interact with the Ca2+-binding site, we tested the effect of Zn2+ on the double mutant E261Q/D278N of ClC-Ka. However, the currents of WT ClC-Ka (Fig. 8, A and C) and the double mutant E261Q/D278N (Fig. 8, B and C) were inhibited in a qualitatively similar way. This demonstrates that Zn2+ inhibition is mediated by a binding site different from the Ca2+-binding site formed by E259, E261, D278, and E281.
Figure 8.
Inhibitory effect of Zn2+ on WT CLC-Ka and its double mutant E261Q/D278N. (A and B) Currents of an oocyte expressing WT ClC-Ka (A) or mutant E261Q/D278N (B) recorded by brief pulses to 60 mV from a holding potential of approximately −30 mV plotted as a function of time. The colors represent the different solutions used: the standard bath solution (black) and the solution containing 1 mM Zn2+ (red). The arrows indicate the solution exchange. The dashed lines indicate zero current. (C) Currents of WT ClC-Ka and its double mutant E261Q/D278N acquired at 60 mV in the presence of 1 or 5 mM Zn2+ at 10 mM Ca2+ were normalized to the currents measured in the absence of Zn2+. The normalized currents are represented as bars (WT ClC-Ka: n ≥ 6; E261Q/D278N: n ≥ 3). Error bars indicate SEM.
Ca2+ and Ba2+: comparison of two cations
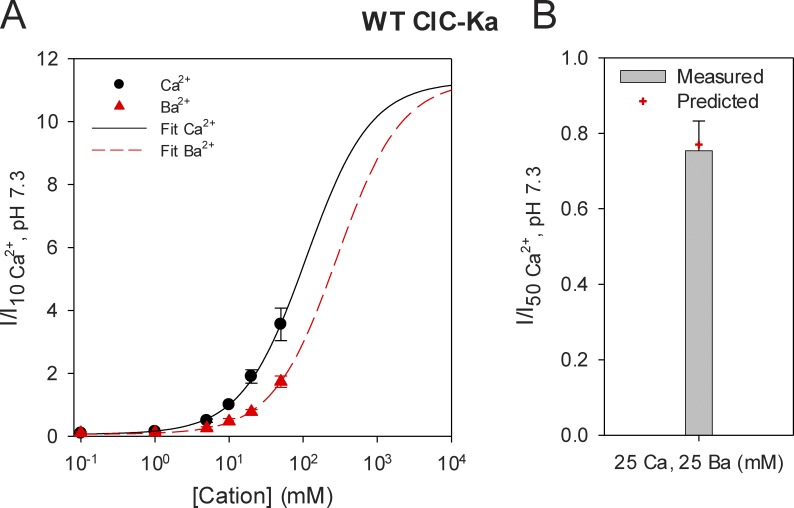
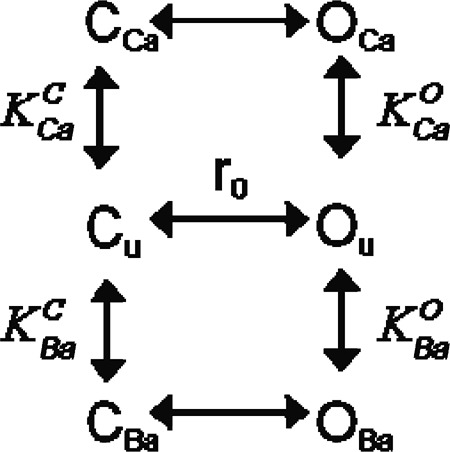
Among all the cations studied, we found that Ba2+ activates ClC-Ka in the most similar manner to Ca2+, even though it is less potent (Fig. 7, A and B). In fact, the current recorded in 10 mM Ba2+ is ∼47% of the current measured in 10 mM Ca2+ (Fig. 7 B). This reduced potency could reflect either a lower affinity of Ba2+ for the binding site or a lower efficacy of Ba2+ compared with Ca2+. To distinguish between these two hypotheses, we performed a dose–response analysis of Ca2+ and Ba2+ modulation. We measured ClC-Ka currents at 60 mV, varying the Ca2+ concentration in the absence of Ba2+ and varying the Ba2+ concentration in the absence of Ca2+. At all concentrations tested (0.1, 1, 5, 10, 20, and 50 mM), Ba2+ activates ClC-Ka less than Ca2+ (Fig. 9 A). Because both Ca2+- and Ba2+-activated currents do not reach saturation at 50 mM, we used a model to extrapolate currents at higher Ca2+ and Ba2+ concentrations. Previously, we proposed an allosteric model composed of four states for modeling Ca2+ modulation of ClC-Ka (Gradogna et al., 2010). Here, we hypothesized a similar allosteric model composed of six states as shown below:
 |
(SCHEME 1) |
Here, OU, OCa, and OBa indicate unbound, Ca2+-bound, and Ba2+-bound open states of the channel, respectively, and CU, CCa, and CBa represent unbound, Ca2+-bound, and Ba2+-bound closed states, respectively. Ca2+ and Ba2+ binding to the open state is governed by the dissociation constants and , respectively, whereas Ca2+ and Ba2+ binding to the closed state are described by the dissociation constants and , respectively. r0 is the ratio of the probabilities of being in states Ou and Cu (r0 = p(OU)/p(CU)) in the absence of divalents.
Figure 9.
Affinity difference causes the altered activation of WT ClC-Ka by Ca2+ versus Ba2+. (A) Currents at various Ca2+ or Ba2+ concentrations were normalized to the currents measured in standard conditions (10 mM Ca2+) and plotted as a function of the respective cation concentration (n ≥ 6). Error bars indicate SD. The solid black line and the dashed red line represent the joined best fit obtained by using Eq. 2 as described in Results. (B) The bar represents the current measured in a mixed solution formed by 25 mM Ca2+ and 25 mM Ba2+ normalized to the current recorded in 50 mM Ca2+ (n = 7). Error bar indicates SD. The red cross shows the value of the normalized current predicted by the allosteric model proposed in Results and represented by the fit lines in A.
At equilibrium, the open probability of the channel is given by the following equation:
| (2) |
In Fig. 9 A, the solid black line and the dashed red line represent the combined best fit of Eq. 2 for the Ca2+ and Ba2+ dependence, resulting in = 0.62 mM, = 142 mM, = 1.6 mM, = 371 mM, and r0 = 1.3 × 10⁻³. The theoretical prediction of this model nicely fits the experimental data. Moreover, it provides some useful indications: very high Ca2+ and Ba2+ concentrations are required for the currents to become saturated, and Ca2+- and Ba2+-activated currents reach the same maximum level. This would indicate that Ba has a lower affinity for the binding site than Ca but the same efficacy. However, because the experimental data cover only a restricted range of the fit curves, these results have to be considered cautiously. To validate the model, we used the fitted parameters to predict the currents under a mixed condition (25 mM Ca2+ and 25 mM Ba2+). The experimental mean value of the current in this mixed condition was 75% of the current at 50 mM Ca2+ (75 ± 8% standard error; Fig. 9 B, bar). The model predicts a value of 0.77 (Fig. 9 B, red cross) and is thus very similar to the experimental value, providing additional evidence that Ba2+ has a reduced affinity but the same efficacy as Ca2+.
Specificity of the Ca2+-binding site in ClC-Kb and ClC-K1
Next we tested the effects of Ba2+, Sr2+, and Mg2+ on WT ClC-Kb and on WT ClC-K1 and its double mutant E261Q/D278N. ClC-Kb shows a behavior similar to that of ClC-Ka. Specifically, Ba2+ and Sr2+ activate ClC-Kb WT, whereas Mg2+ does not activate this channel at concentrations up to 50 mM. Moreover, the rank order of potency is the same as that found for ClC-Ka, i.e., Ca2+ > Ba2+ > Sr2+ >> Mg2+ (Fig. S6, A and B). Because of the low functional expression of ClC-Kb E261Q/D278N, we could not investigate the effects of the cations on this mutant.
Next, we tested the effects of the same cations on ClC-K1. Similar to ClC-Ka and ClC-Kb, Mg2+ has no effect on ClC-K1 up to a concentration of 50 mM. Surprisingly, however, the rank order of potency was Ca2+ > Sr2+ >> Ba2+ > Mg2+ (Fig. 10, A and B), i.e., Ba2+ only weakly activated, whereas Sr2+ robustly activated ClC-K1, unlike the human CLC-K channels (Fig. 7, A and B; and Fig. S6, A and B). Comparing a model of rat ClC-K1 with that of the human ClC-Ka reveals only a few, typically conservative, substitutions within a distance of 20 Å from a given Ca2+-binding site (Fig. S7). The most dramatic of these is the inclusion of R270 instead of S270 (Fig. 1). A plausible hypothesis is that the drastic substitution R270S could underlie the difference of the specificity of the Ca2+-binding site of ClC-K1 and ClC-Ka. However, the mutant S270R of ClC-Ka had unchanged specificity compared with WT (Fig. S8), suggesting that the residues responsible for the change in rank order are located in insertions, such as the terminal domains, which do not have an equivalent region in our template EcClC. Finally, we tested the effects of Ba2+, Sr2+, and Mg2+ on the double mutant E261Q/D278N of ClC-K1. As expected, the Ca2+-insensitive E261Q/D278N was also Ba2+ and Sr2+ insensitive (Fig. S9). This demonstrates that Ca2+, Sr2+, and Ba2+ interact with the same binding site formed by E261 and D278 at the subunit interface also in ClC-K1.
Figure 10.
Peculiar specificity of the Ca-binding site of ClC-K1. (A) Current traces of an oocyte expressing WT ClC-K1 evoked by the IV-pulse protocol (see Materials and methods) at 10 mM Ca2+, Sr2+, Ba2+, and Mg2+. The last trace (0 Ca2+) was recorded in the absence of divalent cations. (B) Mean effect of extracellular cations on the activity of WT ClC-K1. The ratio of the currents measured in different cations, at different concentrations, and the currents in standard bath solution (10 mM Ca2+) were plotted versus the cation concentration (n ≥ 3). Error bars indicate SD.
DISCUSSION
In our previous work (Gradogna et al, 2010), we identified two acidic amino acids, E261 and D278, that are essential for mediating the activation of the human ClC-Ka channel by millimolar extracellular Ca2+. These residues are located in the loop between helices I and J, which connects the two repeats (helices A–I and helices J–R) of each of the protomers of the dimeric protein. The two halves (joined by the I–J loop) are related by inverted topology symmetry (Dutzler et al., 2002; Forrest et al., 2011). Based on the structure of the bacterial homologue, it was previously proposed that the residues E261 and D278 of ClC-Ka form two symmetrically related intersubunit binding sites (see Fig. 5 in Gradogna et al. [2010]).
In the present work, we investigated in more detail the properties of this hypothetical binding site. In particular, by studying the effects of mutations of E261 and D278, we first demonstrated that the binding site is shared by all three CLC-K channels studied, i.e., human ClC-Ka, ClC-Kb, and rat ClC-K1. This is not surprising as the I–J loop is highly conserved in these channels. Interestingly, however, rat ClC-K1 has a significantly higher Ca2+ affinity than the human homologues. Among the CLC proteins studied, Ca2+ modulation has been found only in CLC-K channels, but a possible Ca2+ dependence may have actually never been rigorously tested at high Ca2+ concentrations. Here, we challenged the T. marmorata ClC-0 channel by applying up to 50 mM Ca2+ to reveal possible effects of Ca2+ on the fast gate, the slow gate, and on the overall current amplitude. No effect of Ca2+ on these parameters could be detected, confirming the general assumption that only CLC-K channels are Ca2+ sensitive. As discussed previously (Gradogna et al., 2010), the Ca2+ dependence of CLC-K channels is likely of physiological relevance. CLC-K channels contribute to generate the transepithelial voltage gradient that drives the Ca2+ reabsorption in the kidney. Thus, from a physiological point of view, it would seem more reasonable if CLC-K currents were inhibited by [Ca2+]ext rather than enhanced. However, an interrelation between Ca2+ reabsorption and Ca2+ modulation of CLC-Ks cannot be ruled out because of the complicated homeostatic mechanisms in the kidney, which are still incompletely understood. Moreover, increased basolateral Cl− exit could help to balance increased accumulation of positive charges carried by the Ca2+ ions. This hypothesis may be tested for example by the generation of knockin mice introducing Ca2+-independent CLC-K channel variants.
Interestingly, of the two amino acids E261 and D278, D278 is conserved in ClC-0 and other CLC channels, whereas E261 is not. However, replacing the equivalent V262 of ClC-0 with glutamate was insufficient to render ClC-0 sensitive to Ca2+. It is interesting to note that the mutant significantly affected the kinetics of the slow gating mechanisms. This result, together with the fact that CLC-K channels are lacking the gating glutamate that is responsible for the fast gate of CLC channels such as ClC-0 and ClC-1 (Dutzler et al., 2002, 2003; Estévez et al., 2003; Traverso et al., 2003), suggests that the gating process that is affected by Ca2+ in the CLC-K channels is related to the common gating mechanism of ClC-0. The position of the Ca2+-binding site at the subunit interface further suggests that Ca2+ influences CLC-K currents by modulating the open probability of this common gate, and it suggests involvement of the I–J loop in the gating mechanism. In fact, such a common gate may be relevant for CLC proteins in general.
The low sequence conservation of the I–J loop in CLC proteins led us to replace the whole loop of ClC-0 with the corresponding ClC-Ka fragment. The gating characteristics of this chimera were drastically altered compared with WT ClC-0, being strongly inwardly rectifying, reminiscent of other mutations of the channel (Ludewig et al., 1997b; Maduke et al., 1998) and further supporting the idea that the I–J loop is involved in conformational changes associated with the slow gate. In the future, experiments investigating the properties of the chimera in the background of the E166V mutant of ClC-0 that lacks the fast gate may reveal further insights into the role of the I–J loop in the common gating mechanism. Importantly, the currents of the chimera are increased by raising extracellular Ca2+, demonstrating that this construct has acquired a small, but highly significant Ca2+ sensitivity. This result confirms our hypothesis that the I–J loop and, in particular, residues E261 and D278 interact directly with Ca2+ ions rather than allosterically mediating a Ca2+-binding event to another site.
Given the conservation of this effect and the clear importance of the I–J loop, we attempted to model the atomic structure of the Ca2+-binding site, based on its homology with the structure of EcClC, using a refined sequence alignment between the two proteins and introducing constraints between the ion and the known ligands, E261 and D278. Ca2+ coordination requires more than two residues, and the modeling allowed us to identify putative interaction partners with some confidence, namely E259, Q260, E281, E450, and N459. The mutants E259N ClC-K1 and E281D ClC-K1 exhibited modified Ca2+ sensitivity compared with WT ClC-K1, with both exhibiting an apparently reduced Ca2+ affinity (Fig. 6 D). Even though the mutations do not abolish Ca2+ modulation, the results demonstrate an involvement of these residues in this process. Because we observed a similar effect for both the quite drastic E259N and the conservative E281D mutations, we can hypothesize a more minor role for E259 compared with E281. In fact, it is reasonable to suppose that a less conservative mutation of E281 could have affected the Ca2+ sensitivity more drastically. Unfortunately, we could not test ClC-K1 E281Q because it did not express. Finally, it is worth noting that E259 and E281 also belong to the I–J loop, confirming the essential role of this region in binding of Ca2+ ions. Overall, these results provide strong support for the model of the binding site involving residues E259, E261, D278, and E281 from the two I–J loops at the interface between the protomers in the dimer of the CLC-K channels (Fig. 5).
We note that all available templates for homology modeling of ClC channels are in fact Cl−/H+ antiporters, and thus the models do not contain a continuous aqueous pore for the ions as might be expected. Though we cannot rule out that this feature could affect precision modeling of the Ca2+-binding site, our goal was a more general one, namely to identify Ca2+-binding residues in addition to E261 and D278, for which the two most critical factors are (1) the sequence alignment and (2) the relative positioning of helices I and J within the global architecture of the dimer. The fact that neither factor is likely to be affected by the arrangement in the pore region suggests that our predictions are robust to the use of a transporter as a template. Nevertheless, higher-resolution structural data or constraints, as well as structures of additional (open or closed) states of CLC channels, will be required to provide a molecular-level understanding of how Ca2+ binding actually modulates channel gating.
Another feature of the Ca2+-binding site that we investigated here was its specificity with respect to various divalent cations (Zn2+, Mg2+, Ba2+, Sr2+, and Mn2+). Extracellular Zn2+ inhibits both WT ClC-Ka and the double mutant E261Q/D278N, suggesting that Zn2+ affects the channel by interacting with a binding site different from the Ca2+-binding site. Residues that have been shown to be involved in the Zn2+ block of other CLC proteins (Kürz et al., 1997; Chen, 1998; Clark et al., 1998; Osteen and Mindell, 2008) are not conserved in CLC-Ks. Thus, an interesting future topic of study could be the mechanism of inhibition of CLC-K channels by Zn2+. Mg2+ does not activate CLC-K channels at concentrations up to 50 mM. In contrast, CLC-Ks are activated by Ba2+, Sr2+, and Mn2+ with a different rank order of potency for human CLC-Ks (Ca2+ > Ba2+ > Sr2+ = Mn2+) compared with the rat ClC-K1 (Ca2+ > Sr2+ >> Ba2+). In particular, we found that Ba2+ activates ClC-Ka in a very similar manner as Ca2+, even though it is less potent. Our quantitative comparison of the Ca2+ and Ba2+ dependence suggests that Ba2+ has a lower affinity compared with Ca2+ but a similar efficacy for opening ClC-Ka. However, because we cannot reach concentrations >50 mM for these cations, this conclusion is not definitive.
We attempted to identify the cause of the altered rank order of ClC-K1. The I–J loop contains three substitutions in the ClC-K1 sequence compared with the human CLC-K channels (Fig. 1), and only a few other, generally conservative, changes are found within a cutoff of 20 Å from the predicted Ca2+-binding site in a model of ClC-K1 (Fig. S7). The most drastic substitution, namely R270S in the I–J loop, however, could not account for the altered ion specificity of ClC-K1. Residues outside the modeled regions are therefore most likely determining the quantitative and qualitative differences between the human and the rat channels.
In summary, we provided a detailed description of the Ca2+-binding site of CLC-K channels. We demonstrated its conservation and specificity in the CLC-Ks, and we proposed a molecular model of its structure that is consistent with the available data on residues contributing to the Ca2+-binding site; strikingly, we were able to transplant the Ca2+-binding site and sensitivity into the Ca2+-insensitive ClC-0, merely by introducing the loop between helices I and J.
Acknowledgments
We thank Francesca Quartino for technical assistance.
The financial support by Telethon Italy (grants GGP08064 and GGP12008 to M. Pusch), the Italian Ministry of Education, Universities and Research (project PRIN to M. Pusch), and the Behrens-Weise-Stiftung (to L.R. Forrest and C. Fenollar-Ferrer) is gratefully acknowledged.
Christopher Miller served as editor.
Footnotes
Abbreviation used in this paper:
- TAL
- thick ascending limb
References
- Accardi A., Pusch M. 2003. Conformational changes in the pore of CLC-0. J. Gen. Physiol. 122:277–293 10.1085/jgp.200308834 [DOI] [PMC free article] [PubMed] [Google Scholar]
- Ashkenazy H., Erez E., Martz E., Pupko T., Ben-Tal N. 2010. ConSurf 2010: calculating evolutionary conservation in sequence and structure of proteins and nucleic acids. Nucleic Acids Res. 38:W529–W533 10.1093/nar/gkq399 [DOI] [PMC free article] [PubMed] [Google Scholar]
- Birkenhäger R., Otto E., Schürmann M.J., Vollmer M., Ruf E.M., Maier-Lutz I., Beekmann F., Fekete A., Omran H., Feldmann D., et al. 2001. Mutation of BSND causes Bartter syndrome with sensorineural deafness and kidney failure. Nat. Genet. 29:310–314 10.1038/ng752 [DOI] [PubMed] [Google Scholar]
- Chen T.Y. 1998. Extracellular zinc ion inhibits ClC-0 chloride channels by facilitating slow gating. J. Gen. Physiol. 112:715–726 10.1085/jgp.112.6.715 [DOI] [PMC free article] [PubMed] [Google Scholar]
- Clark S., Jordt S.E., Jentsch T.J., Mathie A. 1998. Characterization of the hyperpolarization-activated chloride current in dissociated rat sympathetic neurons. J. Physiol. 506:665–678 10.1111/j.1469-7793.1998.665bv.x [DOI] [PMC free article] [PubMed] [Google Scholar]
- Diamond J.M., Wright E.M. 1969. Biological membranes: the physical basis of ion and nonelectrolyte selectivity. Annu. Rev. Physiol. 31:581–646 10.1146/annurev.ph.31.030169.003053 [DOI] [PubMed] [Google Scholar]
- Duffield M.D., Rychkov G.Y., Bretag A.H., Roberts M.L. 2005. Zinc inhibits human ClC-1 muscle chloride channel by interacting with its common gating mechanism. J. Physiol. 568:5–12 10.1113/jphysiol.2005.091777 [DOI] [PMC free article] [PubMed] [Google Scholar]
- Dutzler R., Campbell E.B., Cadene M., Chait B.T., MacKinnon R. 2002. X-ray structure of a ClC chloride channel at 3.0 A reveals the molecular basis of anion selectivity. Nature. 415:287–294 10.1038/415287a [DOI] [PubMed] [Google Scholar]
- Dutzler R., Campbell E.B., MacKinnon R. 2003. Gating the selectivity filter in ClC chloride channels. Science. 300:108–112 10.1126/science.1082708 [DOI] [PubMed] [Google Scholar]
- Elinder F., Arhem P. 2003. Metal ion effects on ion channel gating. Q. Rev. Biophys. 36:373–427 10.1017/S0033583504003932 [DOI] [PubMed] [Google Scholar]
- Estévez R., Boettger T., Stein V., Birkenhäger R., Otto E., Hildebrandt F., Jentsch T.J. 2001. Barttin is a Cl- channel beta-subunit crucial for renal Cl- reabsorption and inner ear K+ secretion. Nature. 414:558–561 10.1038/35107099 [DOI] [PubMed] [Google Scholar]
- Estévez R., Schroeder B.C., Accardi A., Jentsch T.J., Pusch M. 2003. Conservation of chloride channel structure revealed by an inhibitor binding site in ClC-1. Neuron. 38:47–59 10.1016/S0896-6273(03)00168-5 [DOI] [PubMed] [Google Scholar]
- Feng L., Campbell E.B., Hsiung Y., MacKinnon R. 2010. Structure of a eukaryotic CLC transporter defines an intermediate state in the transport cycle. Science. 330:635–641 10.1126/science.1195230 [DOI] [PMC free article] [PubMed] [Google Scholar]
- Fong P., Rehfeldt A., Jentsch T.J. 1998. Determinants of slow gating in ClC-0, the voltage-gated chloride channel of Torpedo marmorata. Am. J. Physiol. 274:C966–C973 [DOI] [PubMed] [Google Scholar]
- Forrest L.R., Tang C.L., Honig B. 2006. On the accuracy of homology modeling and sequence alignment methods applied to membrane proteins. Biophys. J. 91:508–517 10.1529/biophysj.106.082313 [DOI] [PMC free article] [PubMed] [Google Scholar]
- Forrest L.R., Krämer R., Ziegler C. 2011. The structural basis of secondary active transport mechanisms. Biochim. Biophys. Acta. 1807:167–188 10.1016/j.bbabio.2010.10.014 [DOI] [PubMed] [Google Scholar]
- Gradogna A., Babini E., Picollo A., Pusch M. 2010. A regulatory calcium-binding site at the subunit interface of CLC-K kidney chloride channels. J. Gen. Physiol. 136:311–323 10.1085/jgp.201010455 [DOI] [PMC free article] [PubMed] [Google Scholar]
- Hessa T., Meindl-Beinker N.M., Bernsel A., Kim H., Sato Y., Lerch-Bader M., Nilsson I., White S.H., von Heijne G. 2007. Molecular code for transmembrane-helix recognition by the Sec61 translocon. Nature. 450:1026–1030 10.1038/nature06387 [DOI] [PubMed] [Google Scholar]
- Jayaram H., Robertson J.L., Wu F., Williams C., Miller C. 2011. Structure of a slow CLC Cl−/H+ antiporter from a cyanobacterium. Biochemistry. 50:788–794 10.1021/bi1019258 [DOI] [PMC free article] [PubMed] [Google Scholar]
- Jeck N., Schlingmann K.P., Reinalter S.C., Kömhoff M., Peters M., Waldegger S., Seyberth H.W. 2005. Salt handling in the distal nephron: lessons learned from inherited human disorders. Am. J. Physiol. Regul. Integr. Comp. Physiol. 288:R782–R795 10.1152/ajpregu.00600.2004 [DOI] [PubMed] [Google Scholar]
- Jentsch T.J. 2005. Chloride transport in the kidney: lessons from human disease and knockout mice. J. Am. Soc. Nephrol. 16:1549–1561 10.1681/ASN.2005020207 [DOI] [PubMed] [Google Scholar]
- Jentsch T.J., Steinmeyer K., Schwarz G. 1990. Primary structure of Torpedo marmorata chloride channel isolated by expression cloning in Xenopus oocytes. Nature. 348:510–514 10.1038/348510a0 [DOI] [PubMed] [Google Scholar]
- Johnson M., Zaretskaya I., Raytselis Y., Merezhuk Y., McGinnis S., Madden T.L. 2008. NCBI BLAST: a better web interface. Nucleic Acids Res. 36:W5–W9 10.1093/nar/gkn201 [DOI] [PMC free article] [PubMed] [Google Scholar]
- Kalman M., Ben-Tal N. 2010. Quality assessment of protein model-structures using evolutionary conservation. Bioinformatics. 26:1299–1307 10.1093/bioinformatics/btq114 [DOI] [PMC free article] [PubMed] [Google Scholar]
- Khafizov K., Staritzbichler R., Stamm M., Forrest L.R. 2010. A study of the evolution of inverted-topology repeats from LeuT-fold transporters using AlignMe. Biochemistry. 49:10702–10713 10.1021/bi101256x [DOI] [PubMed] [Google Scholar]
- Kieferle S., Fong P., Bens M., Vandewalle A., Jentsch T.J. 1994. Two highly homologous members of the ClC chloride channel family in both rat and human kidney. Proc. Natl. Acad. Sci. USA. 91:6943–6947 10.1073/pnas.91.15.6943 [DOI] [PMC free article] [PubMed] [Google Scholar]
- Kürz L., Wagner S., George A.L., Jr, Rüdel R. 1997. Probing the major skeletal muscle chloride channel with Zn2+ and other sulfhydryl-reactive compounds. Pflugers Arch. 433:357–363 [DOI] [PubMed] [Google Scholar]
- Landau M., Mayrose I., Rosenberg Y., Glaser F., Martz E., Pupko T., Ben-Tal N. 2005. ConSurf 2005: the projection of evolutionary conservation scores of residues on protein structures. Nucleic Acids Res. 33:W299–W302 10.1093/nar/gki370 [DOI] [PMC free article] [PubMed] [Google Scholar]
- Li W., Jaroszewski L., Godzik A. 2001. Clustering of highly homologous sequences to reduce the size of large protein databases. Bioinformatics. 17:282–283 10.1093/bioinformatics/17.3.282 [DOI] [PubMed] [Google Scholar]
- Li W., Jaroszewski L., Godzik A. 2002. Tolerating some redundancy significantly speeds up clustering of large protein databases. Bioinformatics. 18:77–82 10.1093/bioinformatics/18.1.77 [DOI] [PubMed] [Google Scholar]
- Lin Y.W., Lin C.W., Chen T.Y. 1999. Elimination of the slow gating of ClC-0 chloride channel by a point mutation. J. Gen. Physiol. 114:1–12 10.1085/jgp.114.1.1 [DOI] [PMC free article] [PubMed] [Google Scholar]
- Ludewig U., Pusch M., Jentsch T.J. 1996. Two physically distinct pores in the dimeric ClC-0 chloride channel. Nature. 383:340–343 10.1038/383340a0 [DOI] [PubMed] [Google Scholar]
- Ludewig U., Jentsch T.J., Pusch M. 1997a. Analysis of a protein region involved in permeation and gating of the voltage-gated Torpedo chloride channel ClC-0. J. Physiol. 498:691–702 [DOI] [PMC free article] [PubMed] [Google Scholar]
- Ludewig U., Jentsch T.J., Pusch M. 1997b. Inward rectification in ClC-0 chloride channels caused by mutations in several protein regions. J. Gen. Physiol. 110:165–171 10.1085/jgp.110.2.165 [DOI] [PMC free article] [PubMed] [Google Scholar]
- Ludewig U., Pusch M., Jentsch T.J. 1997c. Independent gating of single pores in CLC-0 chloride channels. Biophys. J. 73:789–797 10.1016/S0006-3495(97)78111-6 [DOI] [PMC free article] [PubMed] [Google Scholar]
- Maduke M., Williams C., Miller C. 1998. Formation of CLC-0 chloride channels from separated transmembrane and cytoplasmic domains. Biochemistry. 37:1315–1321 10.1021/bi972418o [DOI] [PubMed] [Google Scholar]
- Matsumura Y., Uchida S., Kondo Y., Miyazaki H., Ko S.B., Hayama A., Morimoto T., Liu W., Arisawa M., Sasaki S., Marumo F. 1999. Overt nephrogenic diabetes insipidus in mice lacking the CLC-K1 chloride channel. Nat. Genet. 21:95–98 10.1038/5036 [DOI] [PubMed] [Google Scholar]
- Notredame C., Higgins D.G., Heringa J. 2000. T-Coffee: A novel method for fast and accurate multiple sequence alignment. J. Mol. Biol. 302:205–217 10.1006/jmbi.2000.4042 [DOI] [PubMed] [Google Scholar]
- Osteen J.D., Mindell J.A. 2008. Insights into the ClC-4 transport mechanism from studies of Zn2+ inhibition. Biophys. J. 95:4668–4675 10.1529/biophysj.108.137158 [DOI] [PMC free article] [PubMed] [Google Scholar]
- Picollo A., Liantonio A., Didonna M.P., Elia L., Camerino D.C., Pusch M. 2004. Molecular determinants of differential pore blocking of kidney CLC-K chloride channels. EMBO Rep. 5:584–589 10.1038/sj.embor.7400169 [DOI] [PMC free article] [PubMed] [Google Scholar]
- Pusch M., Ludewig U., Rehfeldt A., Jentsch T.J. 1995. Gating of the voltage-dependent chloride channel CIC-0 by the permeant anion. Nature. 373:527–531 10.1038/373527a0 [DOI] [PubMed] [Google Scholar]
- Pusch M., Ludewig U., Jentsch T.J. 1997. Temperature dependence of fast and slow gating relaxations of ClC-0 chloride channels. J. Gen. Physiol. 109:105–116 10.1085/jgp.109.1.105 [DOI] [PMC free article] [PubMed] [Google Scholar]
- Rickheit G., Maier H., Strenzke N., Andreescu C.E., De Zeeuw C.I., Muenscher A., Zdebik A.A., Jentsch T.J. 2008. Endocochlear potential depends on Cl- channels: mechanism underlying deafness in Bartter syndrome IV. EMBO J. 27:2907–2917 10.1038/emboj.2008.203 [DOI] [PMC free article] [PubMed] [Google Scholar]
- Sali A., Blundell T.L. 1993. Comparative protein modelling by satisfaction of spatial restraints. J. Mol. Biol. 234:779–815 10.1006/jmbi.1993.1626 [DOI] [PubMed] [Google Scholar]
- Schlingmann K.P., Konrad M., Jeck N., Waldegger P., Reinalter S.C., Holder M., Seyberth H.W., Waldegger S. 2004. Salt wasting and deafness resulting from mutations in two chloride channels. N. Engl. J. Med. 350:1314–1319 10.1056/NEJMoa032843 [DOI] [PubMed] [Google Scholar]
- Simon D.B., Bindra R.S., Mansfield T.A., Nelson-Williams C., Mendonca E., Stone R., Schurman S., Nayir A., Alpay H., Bakkaloglu A., et al. 1997. Mutations in the chloride channel gene, CLCNKB, cause Bartter’s syndrome type III. Nat. Genet. 17:171–178 10.1038/ng1097-171 [DOI] [PubMed] [Google Scholar]
- Traverso S., Elia L., Pusch M. 2003. Gating competence of constitutively open CLC-0 mutants revealed by the interaction with a small organic Inhibitor. J. Gen. Physiol. 122:295–306 10.1085/jgp.200308784 [DOI] [PMC free article] [PubMed] [Google Scholar]
- Uchida S., Sasaki S., Furukawa T., Hiraoka M., Imai T., Hirata Y., Marumo F. 1993. Molecular cloning of a chloride channel that is regulated by dehydration and expressed predominantly in kidney medulla. J. Biol. Chem. 268:3821–3824 [PubMed] [Google Scholar]
- Uchida S., Sasaki S., Nitta K., Uchida K., Horita S., Nihei H., Marumo F. 1995. Localization and functional characterization of rat kidney-specific chloride channel, ClC-K1. J. Clin. Invest. 95:104–113 10.1172/JCI117626 [DOI] [PMC free article] [PubMed] [Google Scholar]
- Waldegger S., Jeck N., Barth P., Peters M., Vitzthum H., Wolf K., Kurtz A., Konrad M., Seyberth H.W. 2002. Barttin increases surface expression and changes current properties of ClC-K channels. Pflugers Arch. 444:411–418 10.1007/s00424-002-0819-8 [DOI] [PubMed] [Google Scholar]
- Zdebik A.A., Wangemann P., Jentsch T.J. 2009. Potassium ion movement in the inner ear: insights from genetic disease and mouse models. Physiology (Bethesda). 24:307–316 10.1152/physiol.00018.2009 [DOI] [PMC free article] [PubMed] [Google Scholar]


