

Abstract
KCNE1 associates with KCNQ1 to increase its current amplitude and slow the activation gating process, creating the slow delayed rectifier channel that functions as a “repolarization reserve” in human heart. The transmembrane domain (TMD) of KCNE1 plays a key role in modulating KCNQ1 pore conductance and gating kinetics, and the extracellular juxtamembrane (EJM) region plays a modulatory role by interacting with the extracellular surface of KCNQ1. KCNE2 is also expressed in human heart and can associate with KCNQ1 to suppress its current amplitude and slow the deactivation gating process. KCNE1 and KCNE2 share the transmembrane topology and a high degree of sequence homology in TMD and surrounding regions. The structural basis for their distinctly different effects on KCNQ1 is not clear. To address this question, we apply cysteine (Cys) scanning mutagenesis to TMDs and EJMs of KCNE1 and KCNE2. We analyze the patterns of functional perturbation to identify high impact positions, and probe disulfide formation between engineered Cys side chains on KCNE subunits and native Cys on KCNQ1. We also use methanethiosulfonate reagents to probe the relationship between EJMs of KCNE subunits and KCNQ1. Our data suggest that the TMDs of both KCNE subunits are at about the same location but interact differently with KCNQ1. In particular, the much closer contact of KCNE2 TMD with KCNQ1, relative to that of KCNE1, is expected to impact the allosteric modulation of KCNQ1 pore conductance and may explain their differential effects on the KCNQ1 current amplitude. KCNE1 and KCNE2 also differ in the relationship between their EJMs and KCNQ1. Although the EJM of KCNE1 makes intimate contacts with KCNQ1, there appears to be a crevice between KCNQ1 and KCNE2. This putative crevice may perturb the electrical field around the voltage-sensing domain of KCNQ1, contributing to the differential effects of KCNE2 versus KCNE1 on KCNQ1 gating kinetics.
INTRODUCTION
KCNQ1 (also known as Kv7.1 or KvLQT1) associates with KCNE1 (also known as minK or IsK) to form the slow delayed rectifier (IKs) channel (Fig. 1, A and B) (Sanguinetti et al., 1996), which functions as a “repolarization reserve” in human heart (Jost et al., 2005). The importance of IKs in maintaining the cardiac electrical stability is indicated by the linkage between loss-of-function mutations in KCNQ1 or KCNE1 and congenital long QT syndromes (LQT1 or LQT5) (Splawski et al., 2000). Gain-of-function mutations in KCNQ1 have been linked to short QT syndrome and familial atrial fibrillation (SQT2/fAF) (Chen et al., 2003; Hong et al., 2005; Abraham et al., 2010).
Figure 1.
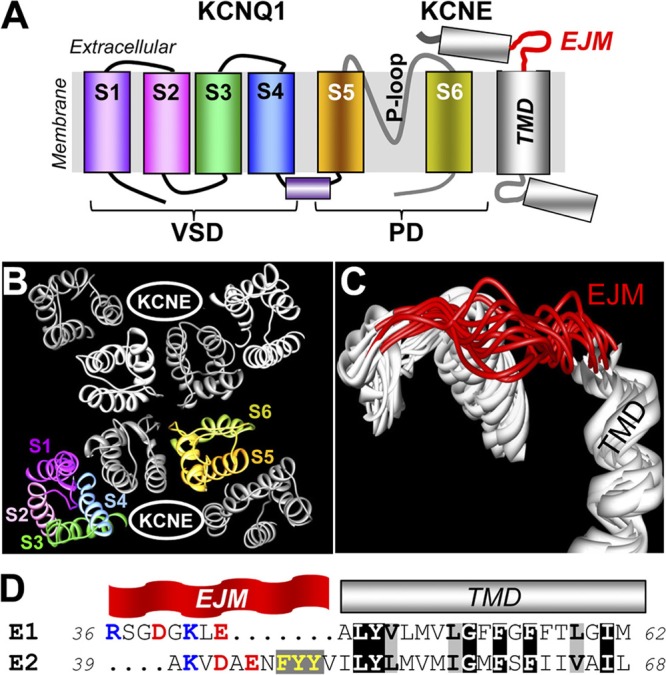
Regions of interest in KCNE1 and KCNE2 (TMD and EJM region) in terms of KCNQ1 modulation. (A) Transmembrane topology of KCNQ1 and KCNE subunits. Each KCNQ1 subunit has six transmembrane segments (S1–S6) with a reentrant P-loop and is functionally divided into voltage-sensing domain (VSD) and pore domain (PD). Based on the KCNE1 NMR structure (Protein Data Bank accession no. 2K21) (Kang et al., 2008), KCNE1 contains three major helical regions connected by flexible linkers. The TMD helix and EJM linker are highlighted. (B) Top view of KCNQ1 homology model (based on Kv1.2_Kv2.1 crystal structure; Protein Data Bank accession no. 2R9R; Long et al., 2007) shown as Cα-atom ribbons. One of the four KCNQ1 subunits is shown in rainbow colors, marking S1 to S6. The other three are shown as white, light gray, and dark gray ribbons. Two “KCNE-binding clefts” in diagonal spaces between KCNQ1 subunits are noted. (C) Ensemble of 10 KCNE1 NMR structures, with EJM and TMD marked. (D) Amino acid sequence alignment between KCNE1 and KCNE2 (“E1” and “E2”) in the regions of interest. Identical and similar residues in TMD are highlighted by black and gray shading, respectively. Positively and negatively charged residues in EJM are highlighted in blue and red. The three consecutive aromatic side chains in E2 EJM are highlighted in yellow.
KCNE2 is also expressed in human heart (Zhang et al., 2012). Genetic variations in KCNE2 have been linked to LQT6 and fAF (Splawski et al., 2000; Yang et al., 2004), suggesting that proper functioning of KCNE2 is necessary for cardiac electrical stability. Heterologous expression experiments have shown that KCNE2 can associate with several channels to modulate their current amplitudes and/or gating kinetics (Abbott et al., 1999; Tinel et al., 2000; Zhang et al., 2001). Among these KCNE2 “partners,” the one that responds most dramatically is KCNQ1. Mammalian cell experiments show that coexpression with KCNE2 turns KCNQ1 into a background-like K channel: time-independent with small amplitude (Tinel et al., 2000; Bendahhou et al., 2005). KCNE2 can also associate with the IKs channel to reduce its current amplitude (Wu et al., 2006). These observations lead to the proposal that KCNE2 can function as an IKs suppressor in the heart (Wu et al., 2006).
Much has been learned about how KCNE1 associates with KCNQ1 and modulates its function. The transmembrane domain (TMD) of KCNE1 (Fig. 1 A) plays a key role in mediating the physical association with KCNQ1 (Tapper and George, 2000), modulating KCNQ1 gating kinetics (Melman et al., 2001), and modulating KCNQ1 pore conductance (Wang et al., 1996; Tai and Goldstein, 1998). More recent data show that the extracellular juxtamembrane (EJM) region of KCNE1 (Fig. 1, A and C) also plays a modulatory role in the IKs gating function (Nakajo and Kubo, 2007; Xu et al., 2008; Chung et al., 2009; Wang et al., 2011; Chan et al., 2012). The structure of the full-length KCNE1 protein embedded in detergent micelles has been solved using the nuclear magnetic resonance (NMR) techniques (Kang et al., 2008) (Protein Data Bank accession no. 2K21). Fig. 1 C depicts the ensemble of KCNE1 structures in the junction between the extracellular and TMD. The dynamic nature of the EJM linker is immediately clear. This is consistent with experimental findings: this KCNE1 region can come close enough to the S1–S2 linker, S3–S4 linker, and P-S6 linker of KCNQ1 to allow disulfide formation when relevant positions are occupied by cysteine (Cys) residues (Nakajo and Kubo, 2007; Xu et al., 2008; Chung et al., 2009; Wang et al., 2011; Chan et al., 2012).
Relatively little is known about how KCNE2 associates with KCNQ1 to modulate its function. Fig. 1 D aligns the KCNE1 and KCNE2 sequences in the region of interest. The two are highly homologous in the TMD. There are also similarities in the EJM region. Previously, we used Cys scan to probe the KCNE2 TMD. Our data suggested that similar to KCNE1, this region of KCNE2 is a helix (Liu et al., 2007). How does the KCNE2 transmembrane helix dock to KCNQ1? What is the relationship between the EJM region of KCNE2 and KCNQ1? The current study is designed to address these questions. We choose to use the “Cys scan” approach for two reasons. First, the small Cys side chain is not expected to grossly perturb the peptide backbone or lipid conformations. Second, Cys substitution allows downstream analysis with disulfide trapping and MTS accessibility and related tests. We replace the native residues in the region of interest by Cys, one at a time, and analyze the patterns of perturbation of channel gating kinetics or pore conductance. This is followed by identifying disulfide formation partners between Cys side chains engineered into the KCNE TMDs and native Cys on KCNQ1. Finally, we use MTS accessibility and reaction rates to probe the relationship between the EJM regions of KCNE subunits and the KCNQ1 channel.
MATERIALS AND METHODS
Molecular biology
We used a short KCNQ1 isoform (581 amino acids [aa]) as the parent construct. However, to directly relate our results to those in the literature, the KCNQ1 position numbers in the text all refer to those in the 676-aa KCNQ1 isoform. The two KCNQ1 isoforms behave the same in oocytes and mammalian cells in terms of their channel function and modulation by KCNE1 and KCNE2. The 581-aa isoform is consistently expressed at a higher level than the 676-aa isoform. The current study aims to probe KCNQ1 interaction with KCNE subunits in the transmembrane and extracellular regions. The 581-aa isoform is appropriate because its amino acid sequence is identical to that of the 676-aa isoform in the region of interest. The following KCNQ1 variants were used: KCNQ1-C331A, KCNQ1* (all native Cys residues replaced by Ala) (Xu et al., 2008), KCNQ1*-331C (restoring the native Cys at position 331 in the otherwise Cys-less KCNQ1*), and KCNQ1*-AxxxC (Cys-substituted mutants in the KCNQ1* background, where “A” is one-letter code for the native amino acid and “xxx” is the position number). Cys-substituted KCNE1 mutants (positions 44–62) were constructed in a Cys-free KCNE1 background (C106A). Cys substitution at KCNE1 positions 36–43 was made using the C106 background. KCNE2 does not have native Cys, and Cys substitution was directly introduced into the WT background. The KCNQ1 variants were in pSP64 vector (Promega) for oocyte expression and in pcDNA3.1/V5-His-TOPO (Invitrogen) for COS-7 expression. In the latter case, V5 and His6 epitopes were appended in frame to the C terminus, which does not interfere with KCNQ1 function or modulation by KCNE subunits (Xu et al., 2008). Both KCNE1 and KCNE2 were in pAlterMax (Promega), suitable for both oocyte and COS-7 expression. All mutations were created using the QuickChange Mutagenesis kit (Invitrogen) and confirmed by direct DNA sequencing.
To transcribe cDNAs, plasmids were linearized and transcribed using an Ambion kit. The quality of cRNA products was confirmed, and their concentrations were quantified (based on known amount of RNA size markers loaded on the same gel), using denaturing RNA gels followed by densitometry.
Oocyte experiments
We used the oocyte expression system because it affords the important advantage of allowing more precise control of protein expression levels than the standard transient mammalian expression systems. This is critical for studying KCNQ1 modulation by KCNE subunits, where the relative expression levels can impact the quantitative or even qualitative nature of the outcome (Zhang et al., 2001; Wu et al., 2006). Oocyte endogenous KCNQ1 can associate with expressed KCNE1 to form IKs (Sanguinetti et al., 1996), and it potentially interferes with data interpretation. We have investigated this issue (Xu et al., 2008) and found that restricting the amounts of KCNQ1 and KCNE1 cRNAs injected to those listed below produced good current expression without interference from endogenous KCNQ1. The latter was confirmed by the very small time-dependent currents in oocytes injected with KCNE1 cRNA alone, which amounted to <5% of time-dependent currents seen in oocytes coinjected with KCNQ1 and KCNE1 cRNAs under the same experimental conditions.
Stage V oocytes were used for channel expression, as described previously (Xu et al., 2008). In the majority of experiments reported here, each oocyte was injected with 5 ng cRNA for KCNQ1 variant and 4.5 ng cRNA for KCNE1 variant, reaching a cRNA molar ratio (KCNQ1/KCNE1) of 1:3. In experiments testing the effects of KCNE2 variants on KCNQ1, we adjusted the KCNQ1 and KCNE2 cRNAs to 10 and 9.9 ng per oocyte and delayed the KCNE2 cRNA injection by 1–2 d to allow sufficient KCNQ1 expression (Liu et al., 2007). After cRNA injection, oocytes were cultured for 1–3 d before voltage-clamp recording.
Two-electrode voltage clamp.
Whole oocyte membrane currents were recorded using the “two-cushion pipette” voltage-clamp method (Schreibmayer et al., 1994). Both current-passing and voltage-recording pipettes had a tip resistance of 0.2–0.6 MΩ. During recordings, the oocyte was continuously superfused with a low [Cl] ND96 solution (composition given below) to reduce interference from endogenous Cl channels. Voltage clamp was done at room temperature (24–26°C) with OC-725C (Warner Instruments) or GeneClamp 500 (Molecular Devices). Voltage-clamp protocol generation and data acquisition were controlled by pClamp 10 via DigiData 1440A (Molecular Devices). Current data were low-pass filtered at 1 kHz (Frequency Devices) and stored on disks for offline analysis. The voltage-clamp protocols and methods of data analysis are described in figure and table legends. The following software was used for data analysis: pClamp 10, Excel (Microsoft), SigmaPlot, SigmaStat, and PeakFit (SPSS). When calculating the difference and standard error (SE) values from two groups of data, each with meani ± SEi, where i = 1 or 2, the difference of means was “mean1 − mean2,” and the SE value was (ΣSEi2)0.5.
Solutions and reagents.
The ND96 solution used in oocyte isolation had the following composition (mM): 96 NaCl, 2 KCl, 1.8 CaCl2, 1 MgCl2, 5 HEPES, and 2.5 Na-pyruvate, pH 7.5. The oocyte culture medium was made by supplementing the ND96 solution with 4% horse serum and penicillin/streptomycin. During voltage-clamp recording, the oocytes were superfused with a low [Cl] solution that had Cl− ions replaced by equimolar methanesulfonate. To record K+- or Rb+-carried tail currents, the oocytes were superfused with solutions that had Na+ replaced by K+ (98 mM [K]) or both Na+ and K+ replaced by Rb+ (98 mM [Rb]). Dithiothreitol (DTT) was dissolved in deionized water as 0.5-M stock solution and frozen in 1-ml aliquots. DTT was thawed right before use and added to bath solution at 1–10 mM. H2O2 stock solution (30%, in water) was diluted with bath solution to 0.01 or 0.1% right before application to the oocyte. 2-Trimethylaminoethyl MTS (MTSET) and 2-sulfonatoethyl MTS (MTSES) were aliquoted in a small quantity (20–30 mg) of powder and stored at −20°C. Stock solution of 100 mM MTSET in deionized water was made fresh, stored on ice, and used within 2 h by dilution with bath solution to 1 mM right before application to oocytes. MTSES power was directly added to bath solution to reach a 5- or 10-mM final concentration right before application to oocytes.
COS-7 expression and immunoblot experiments to probe disulfide bond formation
COS-7 cells were maintained in Dulbecco’s modified Eagle’s medium (Gibco) supplemented with 10% fetal calf serum (Hyclone) and penicillin/streptomycin, in a moist 5% CO2 chamber at 36°C. Cells were transfected with cDNA(s) for KCNQ1 variants, alone or with KCNE1 or KCNE2 variants at a molar ratio of 1:1. 24–48 h after transfection, COS-7 cells were used for immunoblot experiments.
To probe disulfide bond formation in the extracellular compartment, we used the same procedure as described previously for detecting similarly situated disulfide (Xu et al., 2008; Wang et al., 2011). In brief, cells expressing KCNQ1/KCNE variants were scraped off Petri dishes and incubated in 20 mM N-ethylmaleimide (NEM) on ice for 10 min to react with free thiol groups. Cells were pelleted and resuspended in TE buffer (0.2 M NaCl, 20 mM Tris-HCl, and 1 mM EDTA, pH 7.5) supplemented with 1% Triton X-100 and protease inhibitor cocktail (Sigma-Aldrich). After incubation on ice for 1 h, solubilized cell suspension was centrifuged at 104 g for 10 min. The supernatant was collected as whole cell lysate for immunoblotting. To probe disulfide bond formation in the transmembrane compartment, we used a procedure modified from that of Lvov et al. (2010). In brief, cells expressing KCNQ1/KCNE variants were treated with 10 mM DTT (room temperature) to reduce all preformed disulfide bonds. Cells were lysed in hypotonic solution (mM: 10 KCl, 1.5 MgCl2, and 10 HEPES, pH 8.0). Membrane pellets were collected, resuspended in hypotonic solution, and oxidized with 0.01% H2O2 for 10 min at room temperature. Pellets were incubated in NEM to protect free thiol side chains before solubilization.
Protein samples were loaded onto 4–20% gradient nonreducing SDS polyacrylamide gels. After fractionation, the proteins were blotted onto PVDF membranes (GE Healthcare) and probed for KCNQ1 (V5 mAb from Invitrogen), KCNE1, or KCNE2 pAb (Alomone). Immunoreactivity was visualized using an ECL detection kit (GE Healthcare), and band intensities were quantified by densitometry (ChemiImager model 4400; Alpha Innotech).
Online supplemental material
The purpose and content of the online supplemental material are described in the Results. Figs. S1–S6 and Tables S1–S4 are available at http://www.jgp.org/cgi/content/full/jgp.201210847/DC1.
RESULTS
Comparison of KCNQ1 modulation by KCNE1 and KCNE2 reveals two major differences between the two KCNE subunits
Fig. 2 compares the key features of KCNQ1 modulation by the two KCNE subunits. KCNE1 association with KCNQ1 increases the current amplitude, induces a prominent sigmoidal delay in activation (Fig. 2 A, blue arrow), markedly right-shifts the voltage dependence of activation (Fig. 2 B), modestly slows deactivation (Fig. 2 C), and suppresses the hooked-phase of KCNQ1 tail current (Fig. 2 A, gray shading, reflecting a suppression of KCNQ1 inactivation) (Tristani-Firouzi and Sanguinetti, 1998). KCNE2 association with KCNQ1 reduces the current amplitude, suppresses the hooked-phase of KCNQ1 tail current, and modestly right-shifts the voltage dependence of activation (Fig. 2, A and B). The most dramatic effect of KCNE2 on KCNQ1 gating is a slowing of deactivation. Fig. 2 C shows that KCNE2 not only slows down the time-dependent component of the tail current but also induces a nondeactivating component. The degree of this effect depends on the KCNE2 expression level (Wu et al., 2006). Increasing the amount of KCNE2 cRNA injected eventually results in the failure of deactivation, producing a constitutively active phenotype (Wu et al., 2006), similar to those reported previously in mammalian cell expression (Tinel et al., 2000; Bendahhou et al., 2005).
Figure 2.

Comparison between KCNE1 and KCNE2 in terms of their modulation of KCNQ1 gating kinetics and pore conductance. In all panels, data for “Q1 alone,” “Q1+E1,” and “Q1+E2” are color-coded black, blue, and red. (A) Superimposed current traces from oocytes expressing Q1 alone, Q1+E1, and Q1+E2. (Inset) Voltage-clamp protocol. Blue arrow points to the marked sigmoidal delay in Q1+E1 activation. Red arrow points to the slowing in Q1+E2 deactivation, relative to that of Q1 alone. Gray shading highlights the “hooked phase” of tail current seen in Q1 alone but not in Q1+E1 or Q1+E2. (B) 2-s isochronal activation curves of Q1 alone, Q1+E1, and Q1+E2. Tail currents (Itail) elicited by voltage-clamp protocols similar to that diagrammed in A with different test pulse voltages (Vt) are measured. For each oocyte, the relationship between Itail and Vt is fit with a simple Boltzmann function, Itail = Imax/(1 + exp[(V0.5 − Vt)F/(zgRT)]), to estimate the maximal Itail (Imax), half-maximum activation voltage (V0.5), and equivalent gating charge (zg); F, R, and T are Faraday constant, gas constant, and absolute temperature in °K. Itail is normalized by Imax to estimate “fraction activated,” and the mean values with SE bars are plotted against Vt. (C) Comparing rates of deactivation at −60 mV. (Top) Superimposed tail currents (shown as dots) of Q1 alone, Q1+E1, and Q1+E2, with peak amplitudes matched and zero current level marked. The superimposed curves are best-fit single-exponential functions: Itail,t = Itail,peak*exp(−t/τ) + Itail,ss, where Itail,t, Itail,peak, and Itail,ss are tail current amplitude at time “t,” initial peak, and steady-state (nondeactivating) component, and “τ” is time constant of deactivation. Red arrow points to a prominent nondeactivating component of Q1+E2. (Bottom) Summary of rates of deactivation (1/τ). (D) Comparing ratios of Rb conductance to K conductance (GRb/GK) for Q1 alone, Q1+E1, and Q1+E2. (Top) Tail currents elicited by the protocol shown in the inset recorded in 98 mM [K] and then 98 mM [Rb]. Under these conditions, the inward tail currents are carried by extracellular K+ and Rb+ ions, respectively. The K or Rb conductance is calculated by dividing the peak or plateau amplitude of K+- or Rb+-carried tail currents by the driving force (difference between –80 mV, at which the tail currents are measured, and the equilibrium potential for K+ or Rb+ ions measured in the same oocyte). (Bottom) Summary of GRb/GK values.
Therefore, there are two fundamental differences between KCNE1 and KCNE2 in terms of how they modulate the KCNQ1 channel function. The first difference is the modulation of KCNQ1 gating kinetics. KCNE1 slows the closed-to-open transitions, creating the prominent sigmoidal delay in activation and the marked positive shift in the 2-s isochronal activation curve. On the other hand, KCNE2 slows the open-to-closed transitions and can eventually prevent channel deactivation, creating the constitutively active phenotype. The second difference is the modulation of current amplitude through the KCNQ1 channel pore: increased by KCNE1 but decreased by KCNE2.
The ratio of Rb conductance to K conductance, GRb/GK, is a relatively easy but sensitive way to probe the conformation and function of the selectivity filter in K channels (Liu and Joho, 1998). KCNQ1 expressed alone has an unusually large GRb/GK value of 2.89 ± 0.14. KCNE1 and KCNE2 association reduces the GRb/GK value to 0.91 ± 0.03 and 0.95 ± 0.09, respectively (Fig. 2 D).
In the following experiments, we study how Cys substitution in the TMD of KCNE1 and KCNE2 affects their modulation of KCNQ1 function, using the voltage-clamp protocols and methods of data analysis outlined in Fig. 2. We use two versions of KCNQ1, the native one and a Cys-free one (all eight native Cys replaced by Ala, KCNQ1*). KCNQ1* is similar to KCNQ1 in terms of channel function and modulation by the two KCNE subunits, although there are quantitative differences between the two, as noted previously (Xu et al., 2008; Lvov et al., 2010). Relative to KCNQ1, KCNQ1* is less susceptible to the “gating-modifying” effect, but more susceptible to the “GRb/GK-modifying” effect, of KCNE1. The reverse is true for KCNE2 (see Figs. 4, 6, and 8). The pattern of perturbation using KCNQ1* helps us identify “high impact” positions, where Cys substitution of the native residues perturbs how KCNE1 or KCNE2 modulates the KCNQ1* function. This is interpreted as positions situated in the protein–protein interface, as opposed to positions facing a membrane lipid or aqueous environment that are indifferent to Cys substitution. Differences in the pattern of perturbation between KCNQ1 and KCNQ1* provide a hint for possible disulfide bond formation between Cys side chains engineered into the KCNE subunits and native Cys side chains on KCNQ1. Because there are only eight native Cys residues on KCNQ1, and the list of candidates can be further shortened based on the location of the potential disulfide bond, this is a good strategy to search for contact points between KCNE and KCNQ1. If confirmed, the data will be useful in building three-dimensional models for these channel complexes.
Figure 4.

Pattern of V0.5 perturbation by Cys substitution in KCNE1 TMD when coexpressed with KCNQ1* (A) or KCNQ1 (B), and the difference between these two patterns (C). Shown are V0.5 values determined from 2-s isochronal activation curves as described for Fig. 2 B, for KCNQ1* or KCNQ1, expressed alone or with KCNE1 variants listed along the abscissa. Dotted lines denote the V0.5 values for Q1*/E1-WT and Q1/E1-WT. (C) Comparison between KCNQ1 and KCNQ1* in terms of patterns of V0.5 perturbation by Cys substitution in KCNE1 TMD. ΔV0.5 = V0.5,MUT − V0.5,WT, where V0.5,MUT and V0.5,WT are V0.5 values of KCNE1 mutant and WT, respectively. Dotted line denotes zero ΔV0.5. Gray shading highlights position 54, which is the focus of search for interaction with native Cys on KCNQ1.
Figure 6.

Pattern of V0.5 perturbation by Cys substitution in KCNE2 TMD when coexpressed with KCNQ1* (A) or KCNQ1 (B), and the difference between these two patterns (C). The format is the same as that of Fig. 4. nd, no V0.5 data for KCNQ1/KCNE2-L53C (currents too small) and KCNQ1/KCNE2-A66C (totally constitutive phenotype). Gray shading highlights position 59, which is the focus of search for disulfide formation with native Cys on KCNQ1.
Figure 8.

Pattern of GRb/GK perturbation by Cys substitution in KCNE1 and KCNE2 TMDs. (A) GRb/GK values (estimated as described for Fig. 2 D) for KCNQ1 and KCNQ1* (top and bottom, respectively) when expressed alone or with KCNE1 variants listed along the abscissa. Dotted lines denote the values for KCNE1-WT. (B) Same format as A for KCNE2 variants. Gray shading highlights positions where Cys substitution increases GRb/GK to values significantly higher than those of WT variants.
Cys scan of KCNE1 and KCNE2 TMDs reveals distinct patterns of high gating–impact positions and identifies state-dependent contacts with native Cys on KCNQ1
Effects of Cys substitution in KCNE1 TMD on the voltage dependence of activation.
Fig. 3 A depicts five families of current traces recorded from oocytes expressing KCNQ1 alone or with specified KCNE1 variants. Fig. 3 C shows 2-s isochronal activation curves for KCNQ1 alone, with KCNE1-WT, and with all the Cys-substituted KCNE1 constructs. Although the activation curves of most of the channels can be well described by a simple Boltzmann function (Fig. 3 C, b), this is not the case for three Cys-substituted KCNE1 mutants, Y46C, T58C, and I61C (Fig. 3 C, a). KCNQ1/KCNE1-T58C shows a prominent negative component and a minor positive component. KCNQ1/KCNE1-Y46C and KCNQ1/KCNE1-I61C exhibit a very gradual phase of activation, beginning in a voltage range more negative than the threshold for KCNQ1/KCNE1-WT activation. However, their major component of activation occurs only in an extremely positive voltage range. The very gradual activation phase in KCNQ1/KCNE1-Y46C and KCNQ1/KCNE1-I61C precludes the use of ΔGo value (zgV0.5F) as a measure of the voltage dependence of channel activation. Therefore, we use the V0.5 value of Boltzmann fit to analyze the effects of Cys substitution in the TMDs on KCNE modulation of KCNQ1 gating.
Figure 3.

Examples of perturbing KCNE1 modulation of KCNQ1 gating function and pore conductance by Cys substitution in the TMD. (A) Original current traces of selected channels elicited by the voltage-clamp protocol diagrammed on the left. The beginning and end Vt values are marked close to each family of current traces. In all cases, the tail currents are recorded at −60 mV, except Q1/E1-I61C (−20 mV, to amplify the tail current amplitudes). Current traces elicited by Vt to +60 mV are shown in red to highlight the differences in the voltage range of channel activation. (B) Tail currents of the same channel types recorded in 98 mM [K]o and then 98 mM [Rb]o (black and blue traces, respectively). The tail currents are elicited by 2-s pulses to +60 mV and are recorded at −80 mV. Horizontal line denotes zero current level. (C) 2-s isochronal activation curves of Q1 alone, with E1-WT and with Cys-substituted E1 variants (in the TMD region). (a) E1-Y46C, E1-T58C, and E1-I61C show markedly shifted activation curves relative to E1-WT. (b) The other Cys-substituted mutants induce much less, or no, V0.5 shift relative to E1-WT.
The V0.5 values for KCNQ1* and KCNQ1 expressed alone, with KCNE1-WT, or with Cys-substituted KCNE1 mutants are graphed in Fig. 4 (A and B). Numerical datasets are summarized in Table S1. Based on the pattern using KCNQ1* (Fig. 4 A), there are four positions in the KCNE1 TMD where Cys substitution induces a shift in V0.5 substantially different from that by KCNE1-WT (*, P < 0.001): 54, 55, 61, and 62. These are the “high gating–impact” positions in KCNE1 TMD.
To compare the pattern of V0.5 perturbation using KCNQ1 versus that using KCNQ1*, we calculate ΔV0.5 values (ΔV0.5 = V0.5,MUT − V0.5,WT) for both KCNQ1 and KCNQ1* datasets (Fig. 4 C). If the effects of Cys substitution on the V0.5 value depend on whether KCNQ1 or KCNQ1* is used, the ΔV0.5 values should vary. Five positions show markedly different ΔV0.5 values between KCNQ1 and KCNQ1*: 46, 51, 54, 55, and 58. We focus on position 54 to test whether Cys engineered into this position can interact with native Cys on KCNQ1.
Probing the interaction between Cys engineered into KCNE1 position 54 and KCNQ1 native 331C.
When KCNE1-F54C is coexpressed with KCNQ1* (without the possibility of disulfide formation between KCNE1 and KCNQ1), the V0.5 value is much more positive than that of KCNQ1*/KCNE1-WT. However, when KCNE1-F54C is coexpressed with KCNQ1, the V0.5 value is not different from that of KCNQ1/KCNE1-WT (Fig. 5 A). We hypothesize that substituting KCNE1 F54 with Cys per se destabilizes the open state of the channel, but F54C can form a disulfide bond with a native Cys on KCNQ1. This disulfide formation occurs in the open state and stabilizes the channel in this state. It has been shown that KCNE1-F54C is close to native Cys 331 on the S6 of KCNQ1 to allow Cd-bridge formation (Tapper and George, 2001). Our hypothesis generates four testable predictions. First, replacing C331 with Ala while preserving all the other native Cys on KCNQ1 should produce a phenotype similar to that of KCNQ1*; i.e., KCNQ1-C331A/KCNE1-F54C should exhibit a more positive V0.5 value relative to that of KCNQ1-C331A/KCNE1-WT. Data shown in Fig. 5 A, right two lanes, support this prediction. Second, DTT treatment of KCNQ1/KCNE1-F54C should produce a positive shift in the V0.5 value (by reducing the disulfide bond between KCNQ1 C331 and KCNE1 54C, and destabilizing the open state). Fig. 5 B shows that although DTT causes a modest negative shift in the V0.5 values of KCNQ1 alone and KCNQ1/KCNE1-WT, it causes a prominent positive shift in the V0.5 value of KCNQ1/KCNE1-F54C, supporting the second prediction. Third, DTT should have little or no effect on the V0.5 value of KCNQ1*/KCNE1-F54C or KCNQ1-C331A/KCNE1-F54C, in which KCNE1 54C is missing the disulfide formation partner in KCNQ1. Data shown in Fig. 5 B, right two lanes, support the third prediction.
Figure 5.

Probing interaction between Cys engineered into KCNE1 position 54 and KCNQ1 native C331. Four KCNQ1 constructs are used in experiments reported here: Q1 (the parent construct for the other three, with all eight native Cys present), Q1* (all native Cys replaced by Ala), Q1-C331A (C331 replaced by Ala, the other seven native Cys retained), and Q1*-331C (C331 retained, the other seven native Cys replaced by Ala). (A) Shift in V0.5 of activation induced by E1-WT or E1-F54C when coexpressed with Q1, Q1*, or Q1-C331A. (B) Shift in V0.5 of activation induced by a reducing agent, DTT (5 mM), in channel constructs listed along the abscissa. (C) An oxidizing agent, H2O2 (0.1%), induces a constitutive component in Q1*-331C/E1-F54C that is “channel activation” dependent but reversible upon H2O2 washout; the reversal is accelerated by DTT. (a and b) Average time courses of changes in the Q1*-331C/E1-F54C current amplitude measured at 5 ms upon depolarization to +60 mV (defined as the “constitutive component”) before, during, and after H2O2 exposure (duration marked by the gray shading). H2O2 washout is done without or with 5 mM DTT. Channels are activated by constant pulsing from Vh −100 to +60 mV for 2 s once every 30 s throughout. (c) Pulsing is discontinued while holding the membrane at −100 mV during H2O2 application for 10 min before resuming pulsing. Data are normalized by the H2O2-induced increase in constitutive component and fit with single-exponential functions to estimate the time constants (τs) of development of the constitutive component upon H2O2 wash-in and its reversal upon H2O2 washout. The data are summarized in (d). Data points during H2O2 wash-in (a and c) and H2O2 washout (b) are superimposed on curves calculated based on the single-exponential functions. (Insets in a and c) Representative current traces recorded during H2O2 exposure tested by the two protocols. Open arrows point to the time of current measurements. (D) Although Q1*-331C/E1-F54C develops a prominent constitutive component after pulsing in H2O2, neither Q1-C331A/E1-F54C nor Q1*-331C/E1-WT manifests such a constitutive component when tested under the same conditions. The ratios of constitutive component after pulsing in H2O2 to that under the control conditions are plotted against channel constructs. (n), number of oocytes tested. *, P < 0.05 for the specified pairs in A and C (d) or different from the other groups after multiple group comparison using one-way ANOVA followed by pairwise tests in B and D.
The fourth prediction is that disulfide formation between KCNQ1 C331 and KCNE1 54C requires channel activation. This prediction is tested using KCNQ1*-331C/KCNE1-F54C. KCNQ1*-331C has all the native Cys replaced by Ala except Cys at position 331. In the presence of an oxidizing agent (0.1% H2O2) and with constant pulsing (from Vh −100 mV, 2-s pulses to +60 mV once every 30 s), KCNQ1*-331C/KCNE1-F54C gradually develops a constitutive component (Fig. 5 C, a). Under the same conditions, H2O2 cannot induce such a constitutive component in KCNQ1-C331A/KCNE1-F54C or KCNQ1*-331C/KCNE1-WT, where only one of the Cys side chains in the putative disulfide-forming pair is present (Fig. 5 D). Although the constitutive component of KCNQ1*-331C/KCNE1-F54C is reversible after H2O2 washout, the reversal is accelerated by a reducing agent, DTT (Fig. 5 C, b), supporting the involvement of disulfide formation. These data suggest that H2O2 facilitates disulfide formation between KCNQ1 331C and KCNE1 54C, allowing us to test the fourth prediction. Applying 0.1% H2O2 to KCNQ1*-331C/KCNE1-F54C for 10 min while holding the channels in the closed state (at Vh −100 mV; Fig. 5 C, c) fails to induce a constitutive component. Once the pulsing is resumed, a prominent constitutive component develops rapidly. The population data depicted in Fig. 5 C (d) support the reproducibility of the above findings and thus the fourth prediction.
Removing other native Cys from KCNQ1 appears to weaken the ability of disulfide formation between KCNQ1 331C and KCNE1 54C. This is based on the following three observations. First, unlike KCNQ1/KCNE1-F54C, whose V0.5 value is dramatically shifted in the depolarizing direction by DTT treatment (Fig. 5 B), the V0.5 value of KCNQ1*-331C/KCNE1-F54C is not shifted by DTT (−1.5 ± 2.3 mV; n = 7). This indicates that there is very little or no spontaneous disulfide formation in KCNQ1*-331C/KCNE1-F54C to stabilize the channel in the activated state. Second, the constitutive component of KCNQ1*-331C/KCNE1-F54C is reversible after H2O2 removal (Fig. 5 C). Third, when we seek direct evidence for disulfide formation in KCNQ1*-331C/KCNE1-F54C using the nonreducing immunoblot method, we can only detect a very faint 90-kD band above the 60-kD KCNQ1 monomer band in 50% of the attempts. One such example is shown in Fig. S1. The faint 90-kD band in the KCNQ1*-331C/KCNE1-F54C lane is abolished by DTT treatment, supporting its disulfide-linked status.
We conclude that KCNQ1 position 331 and KCNE1 position 54 can make transient contact in the open state. When both positions are occupied by Cys residues, they can form a disulfide bond to stabilize the channel in the open state. This is manifested as a less positive V0.5 value of KCNQ1/KCNE1-F54C relative to KCNQ1*/KCNE1-F54C or KCNQ1-C331A/KCNE1-F54C (Fig. 5 A), and as the constitutive component of KCNQ1*-331C/KCNE1-F54C developed in the presence of H2O2 with pulsing (Fig. 5 C).
Effects of Cys substitution in KCNE2 TMD on the voltage dependence of activation.
The patterns of V0.5 perturbation by Cys substitution in KCNE2 TMD are depicted in Fig. 6 A (coexpressed with KCNQ1*) and Fig. 6 B (coexpressed with KCNQ1). Numerical datasets are summarized in Table S2. Based on the KCNQ1* dataset, five high gating–impact positions are identified in KCNE2 TMD: 51, 60, 61, 62, and 63. The distribution pattern clearly differs from that of KCNE1 (Fig. 4 A).
Fig. 6 C compares the pattern of V0.5 perturbation seen with KCNQ1 versus that with KCNQ1* (ΔV0.5 = V0.5,MUT − V0.5,WT, plotted against Cys-substituted KCNE2 mutants). The ΔV0.5 values are widely different at the following KCNE2 positions: 59, 61, 63, and 67, hinting at the possibility of disulfide formation with native Cys on KCNQ1. We focus on position 59.
Probing the interaction between Cys engineered into KCNE2 position 59 and KCNQ1 native 331C.
KCNE2-M59C induces a much larger positive V0.5 shift than KCNE2-WT when coexpressed with KCNQ1, but the V0.5 values are similar when they are coexpressed with KCNQ1* (Fig. 7 A). Previously, we have shown that replacing native C331 on KCNQ1 by Ala abolishes this difference (Liu et al., 2007). This is confirmed in Fig. 7 A (right two lanes). We hypothesize that although substituting M59 with Cys per se has little effect on KCNE2 modulation of KCNQ1 gating, M59C can form a disulfide with C331 on KCNQ1. This occurs in the closed state and stabilizes the channel in the closed state. This hypothesis produces the following testable predictions: (a) DTT treatment of KCNQ1/KCNE2-M59C should produce a negative shift in V0.5 (by reducing the disulfide bond and destabilizing the closed state); (b) DTT should induce a similar negative shift in the V0.5 value of KCNQ1*-331C/KCNE2-M59C, which preserves the possibility of disulfide formation between KCNQ1 331C and KCNE2 59C while removing all other native Cys on KCNQ1; and (c) removing C331 while preserving all the other native Cys side chains (KCNQ1-C331A/KCNE2-M59C) should prevent this negative V0.5 shift by DTT. Data presented in Fig. 7 B support these predictions.
Figure 7.

Probing disulfide formation between Cys engineered into KCNE2 position 59 and KCNQ1 native C331. (A) Shift in V0.5 of activation induced by KCNE2-WT or KCNE2-M59C when coexpressed with KCNQ1, KCNQ1*, or KCNQ1-C331A. (B) Shift in V0.5 of activation induced by DTT in channel constructs listed along the abscissa. (n), number of oocytes tested. *, P < 0.05 for the specified pair in A or different from the other groups after multiple group comparison using one-way ANOVA followed by pairwise tests in B. (C) Composite KCNQ1 immunoblot images of whole cell lysates from COS-7 cells expressing cDNAs listed on top, without or with DTT treatment. Red asterisk, disulfide-linked KCNQ1*-Q147C/KCNE1-G40C band; red rectangle, putative disulfide-linked KCNQ1*-331C/KCNE2-M59C band. The size marker bands (in kD) are noted on the left, and the molecular species corresponding to the various bands are noted on the right: Q1, KCNQ1 monomer; Q1/E1, KCNQ1 monomer disulfide-linked to KCNE1; (Q1)2/(E2)x, KCNQ1 dimer disulfide linked to one or more KCNE2. White line indicates that intervening lane has been spliced out.
We proceed to directly test disulfide formation between KCNE2-59C and KCNQ1*-331C. KCNQ1*-Q147C/KCNE1-G40C serves as a positive control for the nonreducing conditions, and DTT is used to test the putative disulfide-linked status. Fig. 7 C confirms a clear band in the KCNQ1*-331C/KCNE2-M59C lane that is abolished by DTT treatment. The same observations are obtained in two additional experiments. In all three cases, instead of the expected 75–90-kD band size (KCNQ1 monomer disulfide linked to KCNE2), the disulfide-linked KCNQ1*-331C/KCNE2-M59C migrates as an ∼150-kD band. This is consistent with KCNQ1 dimer linked to one or more KCNE2, (Q1)2/(E2)x. Similar observations were reported previously for disulfide formation between Cys engineered into KCNE1 positions in the cytoplasmic juxtamembrane region and KCNQ1 positions in the S4–S5 linker and the C terminus of S6 (Lvov et al., 2010). Furthermore, in rare occasions (2 out of 40 immunoblot experiments) we have seen disulfide-linked KCNQ1*-147C/KCNE1-40C migrates as ≥150-kD bands in addition to the 80-kD band (Fig. S2). These observations suggest that disulfide formation between certain positions on KCNQ1 and KCNE subunits is favored by the KCNQ1 dimer conformation.
Cys scan of KCNE1 and KCNE2 TMDs reveals distinct patterns of perturbation of KCNQ1 pore conductance
We test the effects of Cys substitution in KCNE1 and KCNE2 TMDs on the GRb/GK value when coexpressed with KCNQ1 or KCNQ1*. KCNQ1* alone has a large GRb/GK value of 3.94 ± 0.07. Association with KCNE1 and KCNE2 reduces the GRb/GK value to 0.74 ± 0.02 and 2.39 ± 0.10, respectively (Tables S1 and S2). Thus, removing native Cys residues from KCNQ1 accentuates its unique property of a large GRb/GK value and the modulation by KCNE1. However, the effect of KCNE2 on GRb/GK is reduced. Fig. 3 B depicts representative tail current traces recorded from specified channel types that are carried by K+ or Rb+ ions. The calculation of GRb/GK is as described for Fig. 2 D.
Fig. 8 A shows that among the 17 KCNE1 TMD positions tested (45–61), Cys substitution at two positions significantly perturbs the effect of KCNE1 on GRb/GK: 46 and 61. The patterns are the same with KCNQ1 and KCNQ1*. At both positions, Cys substitution of the bulky native residues (Try and Ile) significantly increases the GRb/GK values toward (and even beyond) those of KCNQ1 variants expressed alone. The two “high GRb/GK–impact” positions in KCNE1 TMD are highlighted by gray shading.
Fig. 8 B (top) shows the pattern of GRb/GK perturbation by Cys substitution in KCNE2 TMD when coexpressed with KCNQ1. Among the 17 positions tested (51–67), 5 positions show significantly different GRb/GK values than that of KCNE2-WT: 52, 56, 60, 63, and 67. In all five cases, replacing the bulky native residues (Tyr, Met, Phe, and Ile) with the small Cys side chain increases the GRb/GK value toward that of KCNQ1 alone. The pattern of GRb/GK perturbation seen with KCNQ1* is qualitatively similar, although the degrees of change are smaller than those seen with KCNQ1 (Fig. 8 B, bottom). The five high GRb/GK–impact positions in KCNE2 TMD are highlighted by gray shading.
Comparison between KCNE1 and KCNE2 in the distribution of high GRb/GK–impact positions suggests that their TMDs make different contacts with KCNQ1 to allosterically affect the conformation of the selectivity filter and thus the GRb/GK value. Removing native Cys residues from KCNQ1 does not alter the patterns of high GRb/GK–impact positions. That is, although KCNE1-F54C and KCNE2-M59C each form disulfide with KCNQ1 C331 to affect the V0.5 value, neither disulfide linkage impacts the selectivity filter or the GRb/GK value. This indicates a distinct compartmentalization of KCNQ1 domains involved in KCNE modulation of gating (V0.5 perturbation) versus pore conductance (GRb/GK perturbation).
Probing the relationship of the EJM regions of KCNE1 and KCNE2 with KCNQ1
Cys substitution in the EJM region of KCNE1 (positions 36–44) does not perturb KCNE1 modulation of KCNQ1*. On the other hand, Cys substitution in the corresponding region of KCNE2 (positions 39–50) modestly perturbs the effects of KCNE2 on KCNQ1* gating and/or pore conductance (Fig. S3 and Table S3). These observations suggest that the EJM regions of KCNE1 and KCNE2 differ in their relationships with KCNQ1.
Previously, we used the disulfide trapping approach to detect contacts between the EJM region of KCNE1 and the S1–S2 linker of KCNQ1* (Xu et al., 2008; Wang et al., 2011). These two regions make gating state-dependent contacts, and the disulfide linkage between them stabilizes the channel in the state when the disulfide bond is formed (Xu et al., 2008; Wang et al., 2011). Exemplar immunoblot images are shown in Fig. 9 C. We test whether Cys engineered into the EJM region of KCNE2 can also form disulfide bonds with Cys engineered into the KCNQ1* S1–S2 linker. The experimental procedures are the same as those described previously (Fig. 9 C) (Xu et al., 2008; Wang et al., 2011). In all experiments, we simultaneously run the positive control of KCNQ1*-Q147C/KCNE1-G40C (Fig. 9, A and C, red asterisks) to ensure the nonreducing conditions and to gauge the strength of disulfide bond between KCNQ1* and KCNE2 variants, if detected. To further guard against false negative conclusions, we run KCNE2 immunoblots (Fig. 9 B) to confirm KCNE2 protein expression. We also confirm that the Cys-substituted KCNE2 constructs can associate with Cys-substituted KCNQ1* and modulate its function (Fig. 9 D).
Figure 9.

Probing disulfide formation between Cys engineered into the EJM region of KCNE2 and Cys engineered into KCNQ1* S1-S2 linker. (A) Nonreducing immunoblot images of KCNQ1* variants (listed on left) paired with Cys-substituted KCNE2 variants listed along the abscissa. The left-most lane in each panel is the positive control (KCNQ1*-Q147C/KCNE1-G40C; red asterisks denote the 80-kD disulfide-linked Q1/E1 band). Each panel is a composite of two immunoblots in the 50–100-kD range. The original immunoblot images of the whole range (from <50 to >250 kD) are shown in Fig. S4. (B) KCNE2 immunoblot to confirm protein expression of Cys-substituted KCNE2 variants. Multiple bands reflect core- and complex-glycosylated forms (Jiang et al., 2004). (C) Nonreducing immunoblot images of KCNQ1*-T144C, KCNQ1*-I145C, and KCNQ1*-Q147C paired with Cys-substituted KCNE1 variants, showing the prominent 80-kD disulfide-linked Q1/E1 bands in some of the KCNQ1*/KCNE1 pairs. White lines in A–C indicate that intervening lanes have been spliced out. (D) Current traces and 2-s isochronal activation curves of KCNQ1*-I145C expressed alone (gray current traces and activation curves of gray symbols), coexpressed with KCNE2-WT (black traces and black symbols), or Cys-substituted KCNE2 variants (each similarly color-coded for current traces and activation curve/symbols).
We cannot detect disulfide bond formation in most of these KCNQ1*/KCNE2 pairs in the 75–90-kD range expected for disulfide-linked KCNQ1*/KCNE2 monomer (Fig. 9 A; immunoblot images in the 50–100-kD range), or in the 150–190-kD range expected for KCNQ1* dimer disulfide linked to KCNE2 (Fig. S4; the full range, <50 to >250 kD, immunoblot images). In a few cases, we can detect faint bands in the 75–90-kD size range whose disulfide-linked status is confirmed by their abolishment by DTT treatment (Fig. S5). Importantly, these putative disulfide-linked KCNQ1*/KCNE2 bands are much weaker than the positive control, KCNQ1*-Q147C/KCNE1-G40C, run on the same gel. We conclude that although the EJM region of KCNE1 can make frequent contacts with the S1–S2 linker of KCNQ1*, this does not occur or only very transiently occurs in KCNQ1*/KCNE2.
Probing the water–membrane boundaries in the EJM regions of KCNE1 and KCNE2
We use membrane-impermeable thiol-modifying reagents, MSTET and MTSES, to further probe the EJM regions of the two KCNE subunits. Two types of analysis are performed: (1) patterns of functional perturbation by exposure to extracellular MTS reagents and, for those positions where Cys modification produces sizable functional perturbation, (2) the MTSET reaction rates in the open and closed states. We use these data to differentiate among four types of positions in the EJM regions of KCNE subunits: (1) Exposed but indifferent: the position is accessible to extracellular MTS, but Cys modification produces no functional perturbation. (2) Exposed and influential: the position is readily accessible to extracellular MTS, and Cys modification produces functional perturbation. (3) Transitional and influential: the position is in a transitional zone between exposed and buried positions. Thus, it is less accessible to extracellular MTS, and the accessibility is sensitive to local environmental changes. Cys modification produces functional perturbation. (4) Buried and inaccessible: the position is not accessible to extracellular MTS, and thus MTS exposure does not produce functional perturbation.
MTSET and MTSES each attach a bulky group to an exposed thiol side chain with a positive or negative charge, respectively. We test both MTSET and MTSES for two reasons. First, local electrical potential may limit the access of MTS with a like charge. Testing the two oppositely charged MTS reagents can guard against false negative conclusions. Second, comparing the effects of MTSET and MTSES may provide insights into the mechanism(s) by which Cys modification perturbs the channel function. If the functional perturbation is caused by an increase in side-chain volume and/or an increase in side-chain hydrophilicity, MTSET and MTSES should produce similar effects. On the other hand, if the functional perturbation is caused by a disruption or an addition of electrostatic interaction, MTSET and MTSES should produce different or opposite effects. KCNQ1* is used in these experiments so that the only relevant Cys available for MTS reaction is the one engineered to the EJM region of the KCNE subunit. Pilot experiments show that the major effect of MTS modification of Cys side chains engineered into KCNE EJM positions, when detected, is a shift in the V0.5 value. There is little or no effect on the estimated maximal current amplitudes. Therefore, the functional perturbation is monitored by the shift in V0.5 of activation: ΔV0.5 = V0.5,MTS − V0.5,control, where V0.5,control and V0.5,MTS are V0.5 values before and after MTS exposure. The insets of Fig. 10 illustrate two examples: exposure to MTSET produces a positive V0.5 shift in KCNQ1*/KCNE1-A44C but a negative V0.5 shift in KCNQ1*/KCNE2-I50C.
Figure 10.

Patterns of V0.5 perturbation by MTSET and MTSES modification of Cys side chains engineered into the EJM and initial TMD regions of KCNE1 and KCNE2. In all experiments, KCNQ1* is used to avoid interference from native Cys, and oocytes are DTT treated before recording. (A and B) Summary of ΔV0.5 values plotted against KCNE1 or KCNE2 variants. ΔV0.5 = V0.5,MTS − V0.5,control, where V0.5,control and V0.5, MTS are V0.5 values before MTS application and after MTS washout. Shading along the abscissa signifies the position status: light gray, exposed/indifferent; green, exposed/influential; dark gray, transitional/influential; black, embedded/inaccessible. See Results for more details about how these are determined. (Insets) Examples of MTSET-induced shift in the voltage dependence of activation when applied to KCNQ1*/KCNE1-44C (positive V0.5 shift) or KCNQ1*/KCNE2-50C (negative V0.5 shift).
Fig. 10 A summarizes the effects of MTSET and MTSES exposure of Cys side chains engineered into KCNE1 positions 36–50. Positions 36–39 are exposed but indifferent to side-chain modification. At the other end, positions 47–50 are membrane buried and inaccessible to extracellular MTS. MTSET and/or MTSES application to Cys at KCNE1 positions 40–46 produces a marked shift in V0.5 values. For positions 40–44, the effects of the two MTS reagents are different; the shifts in V0.5 likely result from electrostatic perturbation. Indeed, K41 and E43 may engage in electrostatic interactions with the extracellular surface of KCNQ1 (Nakajo and Kubo, 2007; Wang et al., 2011). For positions 45 and 46, MTSET and MTSES produce the same effects, suggesting that the V0.5 shifts result from the change in side-chain volume and/or hydrophilicity.
Fig. 10 B summarizes the effects of MTSET and MTSES application to Cys side chains at KCNE2 positions 39–58. Positions 39–45 are exposed but largely indifferent to side-chain modification. Positions 53–58 are buried and inaccessible to extracellular MTS. MTS application to Cys at KCNE2 positions 46–52 produces significant negative shifts in V0.5. The similarity in MTSET and MTSES effects suggests that the V0.5 shifts likely result from an increase in side-chain volume and/or hydrophilicity.
Therefore, there are seven “influential” positions each in the EJM regions of KCNE1 and KCNE2. To further determine their status as being “exposed” versus “in the transitional zone,” we quantify the MTS reaction rates using the open-state, “O,” or closed-state, “C,” voltage-clamp protocols (Fig. 11 A, left column). The middle and right columns of Fig. 11 A illustrate four examples of time courses of MTSET reaction with Cys side chains at KCNE1 position 43 and KCNE2 position 48, monitored using the “O”-preferred or “C”-preferred voltage-clamp protocol. The changes in current amplitudes are monitored at a test pulse voltage close to the V0.5 value of channel activation. MESET decreases the KCNQ1*/KCNE1-E43C current amplitude because of a positive shift in V0.5 (Fig. 10 A), whereas it increases the KCNQ1*/KCNE2-Y48C current amplitude because of a negative shift in V0.5 (Fig. 10 B). The time courses of changes in current amplitude during MTSET exposure can be well described by a single-exponential function (shown by the superimposed curves). The time constants (τ, marked next to the superimposed curves) are used to calculate MTSET reaction rates (1/τ*[MTSET]).
Figure 11.

State dependence of MTSET reaction rates with Cys side chains engineered into selected positions in the EJM regions of KCNE1 and KCNE2. (A; left) Voltage-clamp protocols used to monitor the progression of MTSET modification that favors channels in the open or closed, “O” or “C,” states. Test pulses of 0.25-s duration to Vt (approximately V0.5 of activation for channel under investigation) are applied once every 3 or 30 s, which is equivalent to 8 or 0.8% of duty cycle favoring channel opening. (Middle and right) Time courses of changes in KCNQ1*/KCNE1-43C and KCNQ1*/KCNE2-48C current amplitudes before, during, and after MTSET exposure, monitored using the “O” (top) or “C” (bottom) state protocol. The duration of MTSET exposure and its concentration are marked. Data points during MTSET exposure are fit with a single-exponential function (superimposed curves), with time constant (τ) values marked. (B) Summary of MTSET reaction rates for Cys at KCNE1 positions 41–46 and KCNE2 positions 46–50, monitored using the “O” or “C” state protocol (open and closed histogram bars, respectively). The reaction rate is calculated as 1/(τ*[MTSET]). nd, no data for KCNQ1*/KCNE2-V49C (because the “O” state protocol produces a totally constitutive phenotype, precluding the quantification of MTSET effect on V0.5 of activation).
Fig. 11 B plots the reaction rates (in M−1s−1 on a logarithmic scale) against Cys-substituted KCNE1 and KCNE2 variants. The numerical data are summarized in Table S4. MTSET reactions with Cys side chains at KCNE1 positions 41 and 42 are fast and insensitive to the gating state and slow at KCNE1 positions 45 and 46. There is a sharp transition in the MTSET reaction rates from fast to slow at positions 43 and 44, with position 43 experiencing an approximately eightfold difference in the MTSET reaction rates between the open state (fast reacting) and the closed state (slower reacting). In conjunction with data presented in Fig. 10 A, we propose that KCNE1 positions 40–44 are exposed, influential, and sensitive to side-chain charge. Positions 45 and 46 are in the transitional zone, sensitive to side-chain volume and/or hydrophilicity.
We quantify the MTSET reactions rates at five of the seven influential positions in KCNE2. Reactions at positions 51 and 52 are very slow and not included. Relative to KCNE1 positions 41–43, all five KCNE2 positions have slow MTSET reaction rates. The reaction rates at positions 47 and 48 show a six- and fivefold reduction when changing from the “O”-preferred to the “C”-preferred protocol. We suggest that all seven KCNE2 positions are in the transitional zone between exposed (but indifferent) and buried (and inaccessible) positions. They are sensitive to changes in side-chain volume and/or hydrophilicity. Unlike KCNE1, there is no exposed but influential position in the EJM region of KCNE2. The structural implications of these experimental findings are shown in Fig. 12.
Figure 12.

Summary of major findings and proposed structural basis for differential KCNQ1 modulation by KCNE1 and KCNE2. (A) Helical wheel plots of KCNE1 and KCNE2 TMDs, with equivalent positions (based on sequence alignment shown in Fig. 1 D) occupying the same locations. Blue rim highlights positions where, when coexpressed with KCNQ1*, Cys substitution significantly shifts the V0.5 value relatively to that by WT (Figs. 4 and 6). Yellow shading highlights positions where Cys substitution markedly increases the GRb/GK value above that of KCNQ1/KCNE-WT (Fig. 8). KCNQ1 domains around the KCNE TMDs are signified by gray shading. KCNQ1 native C331 is close to KCNE1 position 54 in the open state and to KCNE2 position 59 in the closed state (Figs. 5 and 7). Assuming that the C331 position is stationary, we propose a clockwise rotation of the KCNE transmembrane helix by ∼120° (viewed from the extracellular compartment) when the KCNQ1–KCNE complex transitions from the open to closed states, and a reverse rotation accompanying the closed-to-open–state transition. (B) Cartoon highlighting how KCNE1 and KCNE2 differ in their interactions with KCNQ1 based on the current and previous findings. We propose that the KCNE1 transmembrane helix is flexible (containing three Gly hinges, signified by a wavy cylinder) and makes loose contacts with KCNQ1, whereas the KCNE2 transmembrane helix is less flexible (only one Gly hinge, straight cylinder) and makes intimate contacts with KCNQ1. The EJM region of KCNE1 makes frequent contacts with the external surface of KCNQ1, but the corresponding region of KCNE2 does not (Fig. 9). We further propose an extracellular aqueous crevice between KCNQ1 and KCNE2 (Figs. 10 and 11), allowing MTSET to react with Cys-side chains here although slowly. The four closely spaced aromatic side chains in the KCNE2 EJM region may interact with phospholipid head groups and distort the lipid bilayer, creating the crevice between KCNQ1 and KCNE2. (C) Summary of three regions of KCNQ1/KCNE interactions: (1) The KCNE TMD mediates stable association with KCNQ1 (Tapper and George, 2000), directly affects S6 movements around hinges, and indirectly affects the selectivity filter conformation. (2) The cytoplasmic end of transmembrane helix and cytoplasmic proximal region of KCNE can affect the packing of the S4–S5 linker and the C terminus of S6, S6C (Lvov et al., 2010). (3) The EJM region of KCNE can affect the packing of S4 with S1, S2, and the pore domain (Nakajo and Kubo, 2007; Xu et al., 2008; Chung et al., 2009; Wang et al., 2011; Chan et al., 2012).
DISCUSSION
Our new findings and their implications are summarized in Fig. 12 (A and B). Below, we incorporate these new data into the current knowledge of KCNQ1/KCNE1 interactions and provide suggestions for how KCNE2 may modulate KCNQ1 channel function (Fig. 12 C). This is followed by a discussion of technical considerations and a comparison with previous studies.
Activation gating
KCNE1 interaction with KCNQ1.
KCNE1 association with KCNQ1 causes a tremendous slowing of activation. KCNE1 appears to uncouple the S4 voltage sensor from the S6 gate (Osteen et al., 2010), similar to the behavior of Shaker ILT mutant (Gagnon and Bezanilla, 2010). Our Cys scan of KCNE1 TMD identifies four high gating–impact positions: 54, 55, 61, and 62. Position 54 is close to KCNQ1 C331 (Tapper and George, 2001). Interactions here may impact on the nearby “Ala” hinge or even more downstream “PAG” hinge (Seebohm et al., 2006). We propose that the midsection of KCNE1 transmembrane helix interacts with KCNQ1 S6 hinge(s), and the inner part of KCNE1 transmembrane helix interacts with the S4–S5 linker (Fig. 12 C, regions “1” and “2,” respectively). These interactions, in conjunction with the cytoplasmic proximal region of KCNE1 (Lvov et al., 2010), hinder the conformational changes around S6 hinge(s) and the packing of S4–S5 linker with the C terminus of S6 (S6C), thus uncoupling the S4 movement from S6 gate opening.
The EJM region of KCNE1 plays a modulatory role in this gating process. Previous data suggest that this region of KCNE1 can interact with the S1–S2 (Xu et al., 2008; Wang et al., 2011; Chan et al., 2012), S3–S4 (Nakajo and Kubo, 2007), and P-S6 (Chung et al., 2009) linkers of the KCNQ1 channel (Fig. 12 C, region “3”). These interactions may explain the observations that KCNE1 reshapes S4 packing with S1 (Shamgar et al., 2008) and S2 (Wu et al., 2010). Salt bridges between arginines on S4 and glutamates on S2 stabilize the channel in different gating states (Wu et al., 2010). S1 and S2 may also contribute to the formation of a narrow hydrophobic seal around S4, which serves to focus the transmembrane electrical field around S4 arginines and helps gating charge movement (Campos et al., 2007; Tao et al., 2010). Reshaping the packing of S4 with S1 and S2 by KCNE1 will impact the gating kinetics and gating state stability of the IKs channel.
KCNE2 interaction with KCNQ1.
KCNE2 association with KCNQ1 slows the open-to-closed transition. This may occur because of a hindrance to S4 downward or inward movement upon membrane repolarization (Rocheleau and Kobertz, 2008). We suggest that the transmembrane helices of KCNE1 and KCNE2 are at the same location in the membrane lipid bilayer, so that KCNE1 position 54 and KCNE2 position 59 (next to each other based on sequence alignment; Fig. 1 D) are both close to KCNQ1 C331. However, KCNE1 54C is close to KCNQ1 C331 in the open state, whereas KCNE2 59C is close to KCNQ1 C331 in the closed state. This leads us to propose that the KCNE transmembrane helices rotate during gating transitions (Fig. 12 A), and their midsections lean toward KCNQ1 in a state-dependent manner. The high gating–impact positions in KCNE2 TMD (51 and 60–63) distribute around the helix faces. This is different from KCNE1, whose high gating–impact positions (54, 55, 61, and 62) cluster to one face of the helix (Fig. 12 A). This suggests that, relative to KCNE1, the KCNE2 transmembrane helix makes closer contacts with KCNQ1 so that Cys substitution at four consecutive positions around a whole helical turn (60–63) can directly or allosterically perturb gating transitions.
The relationship between the EJM region of KCNE2 and KCNQ1 differs from that of KCNE1. Unlike the exposed but influential positions of KCNE1 (G40, K41, L42, E43, and A44), exposed positions of KCNE2 up to N45 are largely indifferent to side-chain modification by MTS reagents (Fig. 10). The following seven consecutive positions, 46–52, occupied by highly hydrophobic native resides, are accessible to extracellular MTSET, but the reaction rates are slow (Fig. 11). We propose that these residues face an aqueous crevice that is created by the four aromatic side chains here (F46/Y47/F48/Y52). These closely spaced aromatic rings create the crevice by interacting with phospholipid head groups and distorting the lipid bilayer (Fig. 12 B). Disulfide trapping experiments rule out the possibility that the EJM region of KCNE2 makes intimate and frequent contacts with the S1–S2 linker of KCNQ1 (Fig. 9). Experiments are in progress to probe other regions of KCNQ1 for disulfide formation with the EJM region of KCNE2. If the KCNE2-induced aqueous crevice is formed around the KCNQ1 S4, it will perturb the electrical field around the S4 and may explain how KCNE2 hinders the downward movement of KCNQ1 S4 upon membrane repolarization.
GRb/GK and current amplitude
KCNE1 increases, while KCNE2 decreases, current amplitudes through the KCNQ1 pore. Yet they similarly reduce the Rb to K conductance ratio (GRb/GK). GRb/GK has been commonly used to probe the conformation and function of the selectivity filter in K channels. Rb+ ion is slightly larger than K+ ion (Pauling ionic radii 1.48 and 1.33 Å, respectively). For most K channels, Rb+ can pass through the selectivity filter but with a smaller conductance than K+; thus, GRb/GK < 1. KCNQ1 expressed alone has an unusually large GRb/GK value (∼3). Coexpression with KCNE1 or KCNE2 reduces the GRb/GK value to <1. This has been explained by a suppression of KCNQ1 inactivation by Rb+ ions caused by its long residence time in the KCNQ1 pore (Seebohm et al., 2003). Alternatively, KCNQ1 may have a “floppy” selectivity filter that can better coordinate the larger Rb+ ions than K+ ions (Liu et al., 2007). In this scenario, KCNE1 or KCNE2 association restricts the conformational freedom of the KCNQ1 selectivity filter, thus reducing the GRb/GK value. The two formal explanations may reflect the same underlying structural features of the KCNQ1 selectivity filter and the allosteric mechanism of modulation by the KCNE transmembrane helices.
The KCNE1 TMD has only two high GRb/GK–impact positions, 46 and 61, situated at the two ends of the helix. The KCNE2 TMD has five high GRb/GK–impact positions distributed along the whole helix but tightly clustered to one face (Fig. 12 A). We suggest that the KCNE1 transmembrane helix is more loosely packed against the KCNQ1 pore domain than that of KCNE2. KCNE1 allosterically adjusts the conformation of the KCNQ1 selectivity filter, optimizing the conductance for K+ ions rather than for the larger Rb+ ions. On the other hand, KCNE2 imposes a high degree of restriction on the KCNQ1 selectivity filter, to the extent that the conductance for K+ ions is reduced.
Technical considerations
Is there a mismatch between the weak disulfide bonds detected in COS-7 immunoblots yet marked functional impact in oocyte voltage-clamp experiments?
The putative disulfide bond between KCNQ1 331C and KCNE1 54C or KCNE2 59C occurs in the transmembrane region. The local hydrophobic environment does not favor the formation of negatively charged thiolate intermediates necessary for disulfide bond formation. Therefore, disulfide bonds in the intramembrane region tend to be more fragile and more difficult to detect biochemically than disulfide bonds in the extramembrane regions (e.g., the positive control of KCNQ1*-Q147C/KCNE1-G40C). Furthermore, the strength/stability of disulfide bond based on immunoblot experiments and the degree of functional impact based on voltage-clamp experiments are detecting events on different time scales. Therefore, they may not be correlated in a simple manner. The strength/stability of disulfide bond depends on the proximity of two Cys side chains and, for protein domains with flexible backbones, the frequency of their encounter. In the case of KCNQ1/KCNE1, the latter is an important factor. Because we often detect disulfide bond formation between one KCNQ1 position with multiple KCNE1 positions and vice versa (Xu et al., 2008; Wang et al., 2011), we have to conclude that these positions transiently make contact with each other during conformational changes related to channel gating. These transient contacts will be trapped in a disulfide-bonded state when both positions are occupied by Cys and the local environment (local charges, pH, hydrophobicity) is amenable to disulfide bond formation during these contacts. On the other hand, the degree of functional impact depends on the location of a disulfide bond and how it may affect the backbone conformations. Therefore, a weak disulfide bond based on immunoblots can have a pronounced functional impact based on voltage-clamp experiments.
How valid is the deduction of state dependence of disulfide bond formation based on voltage-clamp experiments?
Quantifying DTT- or H2O2-induced changes in gating parameters (e.g., V0.5 shift or appearance of a constitutive component) is only the beginning of the investigation into the state dependence of disulfide bond formation between Cys-substituted KCNQ1/KCNE pairs. Much more is needed before a conclusion can be reached. We need to check the specificity of the Cys pairs. In the current study, we test the effects of replacing 331C with Ala while preserving all the other native Cys side chains (KCNQ1-C331A), or removing all other native Cys but preserving 331C (KCNQ1*-331C). We also need to check the effects of DTT or H2O2 on negative controls (one or the other Cys of a pair is present). This is important because DTT and H2O2 can have their own “pharmacological effects,” and the engineered Cys may form a disulfide bond with Cys on native proteins in its vicinity. A case in point is depicted in Fig. S6. KCNQ1*/KCNE1-F54C (a negative control for KCNQ1*-331C/KCNE1-F54C) can develop a constitutive component in the presence of H2O2, which gradually declines after H2O2 washout. However, the rate of development is much slower than that of KCNQ1*-331C/KCNE1-F54C. Importantly, the rate of reversal after H2O2 washout is not accelerated by DTT. The detailed comparison between KCNQ1*-331C/KCNE1-F54C and KCNQ1*/KCNE1-F54C allows us to conclude that a component of the constitutive component seen in the former is caused by disulfide bond formation between KCNQ1 331C and KCNE1 54C.
Comparison with previous studies
Previously, the KCNE1 TMD has been probed with tryptophan, asparagine, and arginine scans (Chen and Goldstein, 2007). The identified patterns of high gating–impact positions depend on the substituting amino acids and differ from the pattern we reported here using Cys scan. One possible explanation for the different patterns is that substitution with the bulky tryptophan, highly hydrophilic asparagine, or charged arginine may perturb peptide backbone conformations or lipid packing around the TMD.
Experiments reported in Figs. 5 and S1 lead us to propose that the contact between KCNQ1 position 331 and KCNE1 position 54 is transient, so that KCNQ1*-331C/KCNE1-F54C forms a very weak disulfide bond. This is consistent with a previous report using Cd-bridge formation to probe the interaction between KCNQ1-331C and KCNE1-54C (Tapper and George, 2001): a relatively high Cd concentration (0.5 mM) was required, and its effect was rapidly reversible upon Cd removal. This is different from the high affinity Cd-bridge formation between Cys side chains that can form stable disulfide bonds (Jiang et al., 2005): low Cd concentration (0.5 uM) is adequate, and the effect cannot be reversed by removing Cd ions but requires EDTA to chelate the Cd ions trapped between Cys side chains.
Acknowledgments
The authors would like to thank Dr. Changlin Tian (University of Science and Technology of China) for the discussion of the structure–function relationship of KCNE2.
This study was supported by National Heart, Lung and Blood Institute/National Institutes of Health (grants RO1 HL67840 and HL107294) and a Grant-in-Aid award (10GRNT3860005) from American Heart Association/Mid-Atlantic Affiliate (to G.-N. Tseng).
Kenton J. Swartz served as editor.
Footnotes
Abbreviations used in this paper:
- Cys
- cysteine
- DTT
- dithiothreitol
- EJM
- extracellular juxtamembrane
- IKs
- slow delayed rectifier
- MTSES
- 2-sulfonatoethyl MTS
- MTSET
- 2-trimethylaminoethyl MTS
- NMR
- nuclear magnetic resonance
- SE
- standard error
- TMD
- transmembrane domain
References
- Abbott G.W., Sesti F., Splawski I., Buck M.E., Lehmann M.H., Timothy K.W., Keating M.T., Goldstein S.A.N. 1999. MiRP1 forms IKr potassium channels with HERG and is associated with cardiac arrhythmia. Cell. 97:175–187 10.1016/S0092-8674(00)80728-X [DOI] [PubMed] [Google Scholar]
- Abraham R.L., Yang T., Blair M., Roden D.M., Darbar D. 2010. Augmented potassium current is a shared phenotype for two genetic defects associated with familial atrial fibrillation. J. Mol. Cell. Cardiol. 48:181–190 10.1016/j.yjmcc.2009.07.020 [DOI] [PMC free article] [PubMed] [Google Scholar]
- Bendahhou S., Marionneau C., Haurogne K., Larroque M.-M., Derand R., Szuts V., Escande D., Demolombe S., Barhanin J. 2005. In vitro molecular interactions and distribution of KCNE family with KCNQ1 in the human heart. Cardiovasc. Res. 67:529–538 10.1016/j.cardiores.2005.02.014 [DOI] [PubMed] [Google Scholar]
- Campos F.V., Chanda B., Roux B., Bezanilla F. 2007. Two atomic constraints unambiguously position the S4 segment relative to S1 and S2 segments in the closed state of Shaker K channel. Proc. Natl. Acad. Sci. USA. 104:7904–7909 10.1073/pnas.0702638104 [DOI] [PMC free article] [PubMed] [Google Scholar]
- Chan P.J., Osteen J.D., Xiong D., Bohnen M.S., Doshi D., Sampson K.J., Marx S.O., Karlin A., Kass R.S. 2012. Characterization of KCNQ1 atrial fibrillation mutations reveals distinct dependence on KCNE1. J. Gen. Physiol. 139:135–144 10.1085/jgp.201110672 [DOI] [PMC free article] [PubMed] [Google Scholar]
- Chen H., Goldstein S.A.N. 2007. Serial perturbation of MinK in IKs implies an α-helical transmembrane span traversing the channel corpus. Biophys. J. 93:2332–2340 10.1529/biophysj.107.109702 [DOI] [PMC free article] [PubMed] [Google Scholar]
- Chen Y.-H., Xu S.-J., Bendahhou S., Wang X.-L., Wang Y., Xu W.-Y., Jin H.-W., Sun H., Su X.-Y., Zhuang Q.-N., et al. 2003. KCNQ1 gain-of-function mutation in familial atrial fibrillation. Science. 299:251–254 10.1126/science.1077771 [DOI] [PubMed] [Google Scholar]
- Chung D.Y., Chan P.J., Bankston J.R., Yang L., Liu G., Marx S.O., Karlin A., Kass R.S. 2009. Location of KCNE1 relative to KCNQ1 in the I(KS) potassium channel by disulfide cross-linking of substituted cysteines. Proc. Natl. Acad. Sci. USA. 106:743–748 10.1073/pnas.0811897106 [DOI] [PMC free article] [PubMed] [Google Scholar]
- Gagnon D.G., Bezanilla F. 2010. The contribution of individual subunits to the coupling of the voltage sensor to pore opening in Shaker K channels: effect of ILT mutations in heterotetramers. J. Gen. Physiol. 136:555–568 10.1085/jgp.201010487 [DOI] [PMC free article] [PubMed] [Google Scholar]
- Hong K., Piper D.R., Diaz-Valdecantos A., Brugada J., Oliva A., Burashnikov E., Santos-de-Soto J., Grueso-Montero J., Diaz-Enfante E., Brugada P., et al. 2005. De novo KCNQ1 mutation responsible for atrial fibrillation and short QT syndrome in utero. Cardiovasc. Res. 68:433–440 10.1016/j.cardiores.2005.06.023 [DOI] [PubMed] [Google Scholar]
- Jiang M., Zhang M., Tang D.G., Clemo H.F., Liu J., Holwitt D., Kasirajan V., Pond A.L., Wettwer E., Tseng G.-N. 2004. KCNE2 protein is expressed in ventricles of different species, and changes in its expression contribute to electrical remodeling in diseased hearts. Circulation. 109:1783–1788 10.1161/01.CIR.0000124225.43852.50 [DOI] [PubMed] [Google Scholar]
- Jiang M., Zhang M., Maslennikov I.V., Liu J., Wu D.M., Korolkova Y.V., Arseniev A.S., Grishin E.V., Tseng G.-N. 2005. Dynamic conformational changes of extracellular S5-P linkers in the hERG channel. J. Physiol. 569:75–89 10.1113/jphysiol.2005.093682 [DOI] [PMC free article] [PubMed] [Google Scholar]
- Jost N., Virág L., Bitay M., Takács J., Lengyel C., Biliczki P., Nagy Z., Bogáts G., Lathrop D.A., Papp J.G., Varró A. 2005. Restricting excessive cardiac action potential and QT prolongation: a vital role for IKs in human ventricular muscle. Circulation. 112:1392–1399 10.1161/CIRCULATIONAHA.105.550111 [DOI] [PubMed] [Google Scholar]
- Kang C., Tian C., Sönnichsen F.D., Smith J.A., Meiler J., George A.L., Jr, Vanoye C.G., Kim H.J., Sanders C.R. 2008. Structure of KCNE1 and implications for how it modulates the KCNQ1 potassium channel. Biochemistry. 47:7999–8006 10.1021/bi800875q [DOI] [PMC free article] [PubMed] [Google Scholar]
- Liu Y., Joho R.H. 1998. A side chain in S6 influences both open-state stability and ion permeation in a voltage-gated K+ channel. Pflugers Arch. 435:654–661 10.1007/s004240050566 [DOI] [PubMed] [Google Scholar]
- Liu X.-S., Zhang M., Jiang M., Wu D.-M., Tseng G.-N. 2007. Probing the interaction between KCNE2 and KCNQ1 in their transmembrane regions. J. Membr. Biol. 216:117–127 10.1007/s00232-007-9047-7 [DOI] [PubMed] [Google Scholar]
- Long S.B., Tao X., Campbell E.B., MacKinnon R. 2007. Atomic structure of a voltage-dependent K+ channel in a lipid membrane-like environment. Nature. 450:376–382 10.1038/nature06265 [DOI] [PubMed] [Google Scholar]
- Lvov A., Gage S.D., Berrios V.M., Kobertz W.R. 2010. Identification of a protein-protein interaction between KCNE1 and the activation gate machinery of KCNQ1. J. Gen. Physiol. 135:607–618 10.1085/jgp.200910386 [DOI] [PMC free article] [PubMed] [Google Scholar]
- Melman Y.F., Domènech A., de la Luna S., McDonald T.V. 2001. Structural determinants of KvLQT1 control by the KCNE family of proteins. J. Biol. Chem. 276:6439–6444 10.1074/jbc.M010713200 [DOI] [PubMed] [Google Scholar]
- Nakajo K., Kubo Y. 2007. KCNE1 and KCNE3 stabilize and/or slow voltage sensing S4 segment of KCNQ1 channel. J. Gen. Physiol. 130:269–281 10.1085/jgp.200709805 [DOI] [PMC free article] [PubMed] [Google Scholar]
- Osteen J.D., Gonzalez C., Sampson K.J., Iyer V., Rebolledo S., Larsson H.P., Kass R.S. 2010. KCNE1 alters the voltage sensor movements necessary to open the KCNQ1 channel gate. Proc. Natl. Acad. Sci. USA. 107:22710–22715 10.1073/pnas.1016300108 [DOI] [PMC free article] [PubMed] [Google Scholar]
- Rocheleau J.M., Kobertz W.R. 2008. KCNE peptides differently affect voltage sensor equilibrium and equilibration rates in KCNQ1 K+ channels. J. Gen. Physiol. 131:59–68 10.1085/jgp.200709816 [DOI] [PMC free article] [PubMed] [Google Scholar]
- Sanguinetti M.C., Curran M.E., Zou A., Shen J., Spector P.S., Atkinson D.L., Keating M.T. 1996. Coassembly of K(V)LQT1 and minK (IsK) proteins to form cardiac I(Ks) potassium channel. Nature. 384:80–83 10.1038/384080a0 [DOI] [PubMed] [Google Scholar]
- Schreibmayer W., Lester H.A., Dascal N. 1994. Voltage clamping of Xenopus laevis oocytes utilizing agarose-cushion electrodes. Pflugers Arch. 426:453–458 10.1007/BF00388310 [DOI] [PubMed] [Google Scholar]
- Seebohm G., Sanguinetti M.C., Pusch M. 2003. Tight coupling of rubidium conductance and inactivation in human KCNQ1 potassium channels. J. Physiol. 552:369–378 10.1113/jphysiol.2003.046490 [DOI] [PMC free article] [PubMed] [Google Scholar]
- Seebohm G., Strutz-Seebohm N., Ureche O.N., Baltaev R., Lampert A., Kornichuk G., Kamiya K., Wuttke T.V., Lerche H., Sanguinetti M.C., Lang F. 2006. Differential roles of S6 domain hinges in the gating of KCNQ potassium channels. Biophys. J. 90:2235–2244 10.1529/biophysj.105.067165 [DOI] [PMC free article] [PubMed] [Google Scholar]
- Shamgar L., Haitin Y., Yisharel I., Malka E., Schottelndreier H., Peretz A., Paas Y., Attali B. 2008. KCNE1 constrains the voltage sensor of Kv7.1 K+ channels. PLoS One. 3:e1943. [DOI] [PMC free article] [PubMed] [Google Scholar]
- Splawski I., Shen J., Timothy K.W., Lehmann M.H., Priori S.G., Robinson J.L., Moss A.J., Schwartz P.J., Towbin J.A., Vincent G.M., Keating M.T. 2000. Spectrum of mutations in long-QT syndrome genes. KVLQT1, HERG, SCN5A, KCNE1, and KCNE2. Circulation. 102:1178–1185 10.1161/01.CIR.102.10.1178 [DOI] [PubMed] [Google Scholar]
- Tai K.K., Goldstein S.A.N. 1998. The conduction pore of a cardiac potassium channel. Nature. 391:605–608 10.1038/35416 [DOI] [PubMed] [Google Scholar]
- Tao X., Lee A., Limapichat W., Dougherty D.A., MacKinnon R. 2010. A gating charge transfer center in voltage sensors. Science. 328:67–73 10.1126/science.1185954 [DOI] [PMC free article] [PubMed] [Google Scholar]
- Tapper A.R., George A.L., Jr 2000. MinK subdomains that mediate modulation of and association with KvLQT1. J. Gen. Physiol. 116:379–390 10.1085/jgp.116.3.379 [DOI] [PMC free article] [PubMed] [Google Scholar]
- Tapper A.R., George A.L., Jr 2001. Location and orientation of minK within the IKs potassium channel complex. J. Biol. Chem. 276:38249–38254 [DOI] [PubMed] [Google Scholar]
- Tinel N., Diochot S., Borsotto M., Lazdunski M., Barhanin J. 2000. KCNE2 confers background current characteristics to the cardiac KCNQ1 potassium channel. EMBO J. 19:6326–6330 10.1093/emboj/19.23.6326 [DOI] [PMC free article] [PubMed] [Google Scholar]
- Tristani-Firouzi M., Sanguinetti M.C. 1998. Voltage-dependent inactivation of the human K+ channel KvLQT1 is eliminated by association with minimal K+ channel (minK) subunits. J. Physiol. 510:37–45 10.1111/j.1469-7793.1998.037bz.x [DOI] [PMC free article] [PubMed] [Google Scholar]
- Wang K.-W., Tai K.K., Goldstein S.A.N. 1996. MinK residues line a potassium channel pore. Neuron. 16:571–577 10.1016/S0896-6273(00)80076-8 [DOI] [PubMed] [Google Scholar]
- Wang Y.-H., Jiang M., Xu X.-L., Hsu K.-L., Zhang M., Tseng G.-N. 2011. Gating-related molecular motions in the extracellular domain of the IKs channel: implications for IKs channelopathy. J. Membr. Biol. 239:137–156 10.1007/s00232-010-9333-7 [DOI] [PMC free article] [PubMed] [Google Scholar]
- Wu D.-M., Jiang M., Zhang M., Liu X.-S., Korolkova Y.V., Tseng G.-N. 2006. KCNE2 is colocalized with KCNQ1 and KCNE1 in cardiac myocytes and may function as a negative modulator of IKs current amplitude in the heart. Heart Rhythm. 3:1469–1480 10.1016/j.hrthm.2006.08.019 [DOI] [PubMed] [Google Scholar]
- Wu D., Delaloye K., Zaydman M.A., Nekouzadeh A., Rudy Y., Cui J. 2010. State-dependent electrostatic interactions of S4 arginines with E1 in S2 during Kv7.1 activation. J. Gen. Physiol. 135:595–606 10.1085/jgp.201010408 [DOI] [PMC free article] [PubMed] [Google Scholar]
- Xu X.-L., Jiang M., Hsu K.-L., Zhang M., Tseng G.-N. 2008. KCNQ1 and KCNE1 in the IKs channel complex make state-dependent contacts in their extracellular domains. J. Gen. Physiol. 131:589–603 10.1085/jgp.200809976 [DOI] [PMC free article] [PubMed] [Google Scholar]
- Yang Y., Xia M., Jin Q., Bendahhou S., Shi J., Chen Y., Liang B., Lin J., Liu Y., Liu B., et al. 2004. Identification of a KCNE2 gain-of-function mutation in patients with familial atrial fibrillation. Am. J. Hum. Genet. 75:899–905 10.1086/425342 [DOI] [PMC free article] [PubMed] [Google Scholar]
- Zhang M., Jiang M., Tseng G.-N. 2001. minK-related peptide 1 associates with Kv4.2 and modulates its gating function: potential role as β subunit of cardiac transient outward channel? Circ. Res. 88:1012–1019 10.1161/hh1001.090839 [DOI] [PubMed] [Google Scholar]
- Zhang M., Wang Y.-H., Jiang M., Zankov D.P., Chowdhury S.R., Kasirajan V., Tseng G.-N. 2012. KCNE2 protein is more abundant in ventricles than in atria and can accelerate hERG protein degradation in a phosphorylation-dependent manner. Am. J. Physiol. Heart Circ. Physiol. 302:H910–H922 10.1152/ajpheart.00691.2011 [DOI] [PMC free article] [PubMed] [Google Scholar]