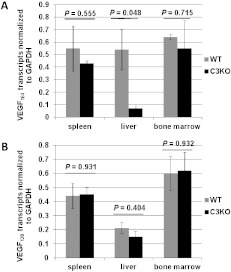
Figure 5.
Altered expression of VEGF164 isoform in complement-deficient mice. Densitometry analysis of expression of mouse VEFG164 (A) and VEFG120 (B) isoforms in WT versus C3KO spleens, livers, and bone marrows (as indicated). VEGF isoform values were normalized to those of GAPDH. Bars display mean ± standard error from three different mice per group.

