

Abstract
BACKGROUND AND PURPOSE
Disturbed cortical gamma band oscillations (30–80 Hz) have been observed in schizophrenia: positive symptoms of the disease correlate with an increase in gamma oscillation power, whereas negative symptoms are associated with a decrease.
EXPERIMENTAL APPROACH
Here we investigated the effects of first and second generation antipsychotics (FGAs and SGAs, respectively) on gamma oscillations. The FGAs haloperidol, flupenthixol, chlorpromazine, chlorprothixene and the SGAs clozapine, risperidone, ziprasidone, amisulpride were applied on gamma oscillations induced by acetylcholine and physostigmine in the CA3 region of rat hippocampal slices.
KEY RESULTS
Antipsychotics inhibited the power of gamma oscillations and increased the bandwidth of the gamma band. Haloperidol and clozapine had the highest inhibitory effects. To determine which receptor is responsible for the alterations in gamma oscillations, the effects of the antipsychotics were plotted against their pKi values for 19 receptors and analysed for correlation. Our results indicated that 5-HT3 receptors have an enhancing effect on gamma oscillations whereas dopamine D3 receptors inhibit them. To test this prediction, m-chlorophenylbiguanide, PD 128907 and CP 809101, selective agonists at 5-HT3, D3 and 5-HT2C receptors were applied and revealed that 5-HT3 receptors indeed enhanced the gamma power whereas D3 receptors reduced it. As predicted, 5-HT2C receptors had no effects on gamma oscillations.
CONCLUSION AND IMPLICATIONS
Our data suggest that antipsychotics alter hippocampal gamma oscillations by interacting with 5-HT3 and dopamine D3 receptors. Moreover, a correlation of receptor affinities with the biological effects can be used to predict targets for the pharmacological effects of multi-target drugs.
Keywords: antipsychotics, schizophrenia, gamma oscillations, 5-HT3 receptors, D3 receptors, acetylcholine
Introduction
Neural network oscillations in the gamma band (30–80 Hz) mediate the synchronization and functional coordination of distant cortical areas enabling information transfer (Womelsdorf et al., 2007; Fries, 2009; Gregoriou et al., 2009). They have been implicated in a range of higher-order brain functions such as sensory processing, working memory and attention (Jensen et al., 2007), and are supposed to be generated by the synchronous firing of perisomatic parvalbumin containing fast-spiking basket cells (Bartos et al., 2007; Gulyás et al., 2010).
An increasing number of studies demonstrate that gamma oscillations are disturbed in schizophrenia patients (Kissler et al., 2000; Minzenberg et al., 2010). Schizophrenia is characterized by dysfunctions in many of higher brain functions known to be linked to gamma oscillations. This has led to the concept that disturbances in gamma band network activity may be involved in the pathophysiology of the disease (Lee et al., 2003). It has been observed that negative symptoms such as social and emotional withdrawal correlate with a decrease in gamma oscillations, whereas positive symptoms, such as hallucinations, seem to be associated with an increase in the gamma power (Herrmann and Demiralp, 2005; Lee et al., 2010; Mulert et al., 2011). In schizophrenia patients, parvalbumin-containing interneurons in the prefrontal cortex have markedly reduced levels of the 67 kDa isoform of GAD67 (Hashimoto et al., 2003), which is essential for GABA synthesis in the cortex. Parvalbumin-positive fast-spiking cells thus seem to be functionally impaired in schizophrenia and may be critically involved in the disturbances of gamma network activity related to the typical symptoms of the disease (Gandal et al., 2012).
Both first and second generation antipsychotics (FGAs and SGAs, respectively) have a highly complex pharmacology with considerable affinity for a variety of receptors (e.g. 5-HT, dopamine and adrenoceptors) (Roth et al., 2004) found on principal cells and/or interneurons playing a crucial role in the generation of gamma oscillations. Therefore, the aim of the present study was to investigate the effects of FGAs and SGAs on gamma oscillations. The oscillations were induced in acute hippocampal slices by bath application of acetylcholine (ACh), mimicking cholinergic input from the septum (Fischer et al., 2002). These cholinergic oscillations share many characteristics with in vivo intrahippocampal gamma oscillations (Fisahn et al., 1998; Csicsvari et al., 2003) making them an appropriate in vitro model for this network activity (Traub et al., 2004; Hájos and Paulsen, 2009).
Methods
Animals
Female Wistar rats (Rattus norvegicus f. domestica), aged 5–7 weeks (150–180 g), were kept under 12 h light/dark conditions and given food and water ad libitum. All animal procedures were conducted in accordance with the guidelines of the European Communities Council and the institutional guidelines approved by the Berlin Animal Ethics Committee (Landesamt für Gesundheit und Soziales Berlin, T0096/02). All studies involving animals are reported in accordance with the ARRIVE guidelines (Kilkenny et al., 2010; McGrath et al., 2010).
Slice preparation
Preparation of acute brain slices and recordings were done as described previously (Schulz et al., 2012). In brief, rats were anaesthetized with 2% isoflurane added to a 70:30 mix of N2O and O2 and then decapitated. Their brains were rapidly removed and washed with ice-cold artificial (A) CSF containing (in mM): NaCl, 129; KCl, 3; NaH2PO4, 1.25; NaHCO3, 21; CaCl2, 1.6; MgSO4, 1.8; d-glucose, 10, saturated with carbogen (95% O2/5% CO2). The brain was cut into 400 µm thick horizontal hippocampal slices with a vibratome (DSK microslicer DTK-1000; Dosaka, Kyoto, Japan). Slices were immediately transferred to an interface-type recording chamber perfused with warm and carbogenated ACSF (36°C, flow rate 1.6–1.7 mL·min−1, pH 7.4). Slices were left for recovery for at least 2 h before the experiments were commenced. Several slices of each brain were used for experiments, but not more than one slice per hemisphere for each drug.
Extracellular recordings
Extracellular field potentials were recorded from stratum pyramidale of area CA3b with glass pipettes filled with ACSF (resistance < 3 MΩ) and placed 80–120 µm below the cut surface of the slice. Recordings were amplified by a custom-made amplifier, low-pass filtered at 1 kHz and sampled at 5 kHz by a CED 1401 interface (Cambridge Electronic Design, Cambridge, UK). Gamma oscillations were induced by bath perfusion of 10 µM ACh and 2 µM physostigmine (Physo) and stabilized after ∼90 min. Drugs were applied 100 min after the application of ACh/Physo for a period of 60 min. If the gamma oscillation did not stabilize (i.e. if the peak power varied more than 10% within minutes 90–100), the slice was excluded from analysis (34 of 145 slices).
Drugs
All drugs were purchased from Sigma-Aldrich, Taufkirchen, Germany (ACh, chlorpromazine, chlorprothixene, clozapine, haloperidol, risperidone) or Tocris, Bristol, UK [amisulpride, CP 809101, flupenthixol, m-chlorophenylbiguanide hydrochloride (mCPBG), PD 128907, Physo, ziprasidone] and dissolved in ACSF except amisulpride, clozapine, risperidone and ziprasidone, which were first dissolved in DMSO and then further diluted in ACSF with a final DMSO concentration of 0.2‰ (v v-1). Therapeutic plasma concentrations of antipsychotics were found to be in the nanomolar range (0.05–1 µM) (Dahl, 1986; Mauri et al., 2007). In the present study, higher concentrations (10–30 µM) were chosen depending on the therapeutic concentrations to assure the saturation of the receptors and to obtain faster tissue penetration.
Correlation of pKi values with effects on gamma oscillations
Ki (dissociation constant) values for each antipsychotic agent were generously provided by the National Institutes of Mental Health's Psychoactive Drug Screening Program (PDSP) Contract # HHSN-271-2008-00025-C (NIMH PDSP) (http://pdsp.med.unc.edu/). Rat Ki values from the database were converted in pKi (negative logarithm of Ki) and the mean pKi was used for the correlation analysis (i.e. the geometric mean of the Ki values). In the few cases where no rat data were available (e.g. most chlorprothixene pKi values, 5-HT1D and some muscarinic receptor data), Ki values for the human receptor were taken. H3 receptor Ki values were taken in two cases (ziprasidone and haloperidol) from guinea pig and the 5-HT3 receptor Ki value for flupenthixol from the mouse. The normalized effects of antipsychotics on power and bandwidth were plotted against the (averaged) pKi values and analysed for correlation using a simple linear regression analysis. The r2 values and the slope of the regression line were determined for each receptor. Positive slope of the regression line for a receptor indicates gamma-enhancing effects of the receptor (enhancement of peak gamma power, decrease of gamma bandwidth) whereas a negative slope for a receptor indicates gamma-inhibiting effects (inhibition of peak gamma power, increase of gamma bandwidth). For this analysis, it was assumed that antipsychotics are competitive antagonists at the receptors analysed.
Data analysis and statistics
Using a custom-made script for the Spike2 software (Cambridge Electronic Design), power spectra were calculated for 2 min periods throughout the recording, of which peak power, integral power (from 20 to 80 Hz), peak frequency and peak bandwidth (at 50% of maximum peak power) were determined. Because of the large variability in absolute power of the oscillations, it was normalized to a 10 min period before drug application or the corresponding time in control experiments, where slices received only ACh/Physo during the whole recording. The magnitude of absolute gamma power before drug application did not correlate with the normalized effects of drugs on gamma power in any measurements. Data are presented as mean ± SEM. Statistical comparisons between the drug-induced changes and the time-matched control experiments were made using one-way anova with Fisher's least significant difference post hoc test. In order to judge the significance of Pearson's correlation coefficients (r), Student's t-test was used after using the formula:
to transform the sampling distribution of r to Student's t distribution. N is the size of the sample on which r is based. To test whether the slope of the linear regression fit between the pKi values and the effects on gamma oscillation is significantly different from 0, we used an F-test of the overall fit, followed by Student's t-test of individual parameters. Significance level was set at P < 0.05.
Nomenclature
The nomenclature of all molecular targets (receptors, ion channels, etc.) cited in this work conforms to the British Journal of Pharmacology's Guide to Receptors and Channels (Alexander et al., 2011).
Results
Effects of high-potency FGAs on gamma oscillations
Gamma oscillations were induced in the hippocampus by bath application of ACh (10 µM) and Physo (2 µM). Measurement of field potentials in the stratum pyramidale of area CA3 revealed an average frequency and peak power of 32.4 ± 0.5 Hz and 2198 ± 385 µV2 respectively (n= 111). Peak and integrated power, bandwidth, and frequency of gamma oscillations were significantly altered by the drugs applied as confirmed by anova (peak power: F0.05(1),12,98= 7.127, P < 0.001; integrated power: F0.05(1),12,98= 7.447, P < 0.001; bandwidth: F0.05(1),12,98= 2.897, P= 0.002; peak frequency: F0.05(1),12,98= 2.55, P= 0.006).
Haloperidol (10 µM), the prototype high-potency FGA, inhibited the power of peak gamma oscillations to 56.7 ± 10.2% (n= 8, P < 0.05 compared with control, Figure 1A, E). The integrated gamma power and the peak frequency of the oscillations were also inhibited to 78.1 ± 12.5% and 96.2 ± 3.4%, respectively; P < 0.05; Figure 1A, F). We also investigated the change in the bandwidth of the oscillations. A narrow gamma band in the power spectrum indicates a high temporal coherence and regular oscillations, whereas a wide gamma band means low coherence and relatively irregular oscillations. Haloperidol increased the bandwidth to 174.2 ± 18.7% (P < 0.05, Figure 1A, G), indicating reduced temporal coherence. Thus, haloperidol not only reduced the power of the oscillations but also their regularity.
Figure 1.
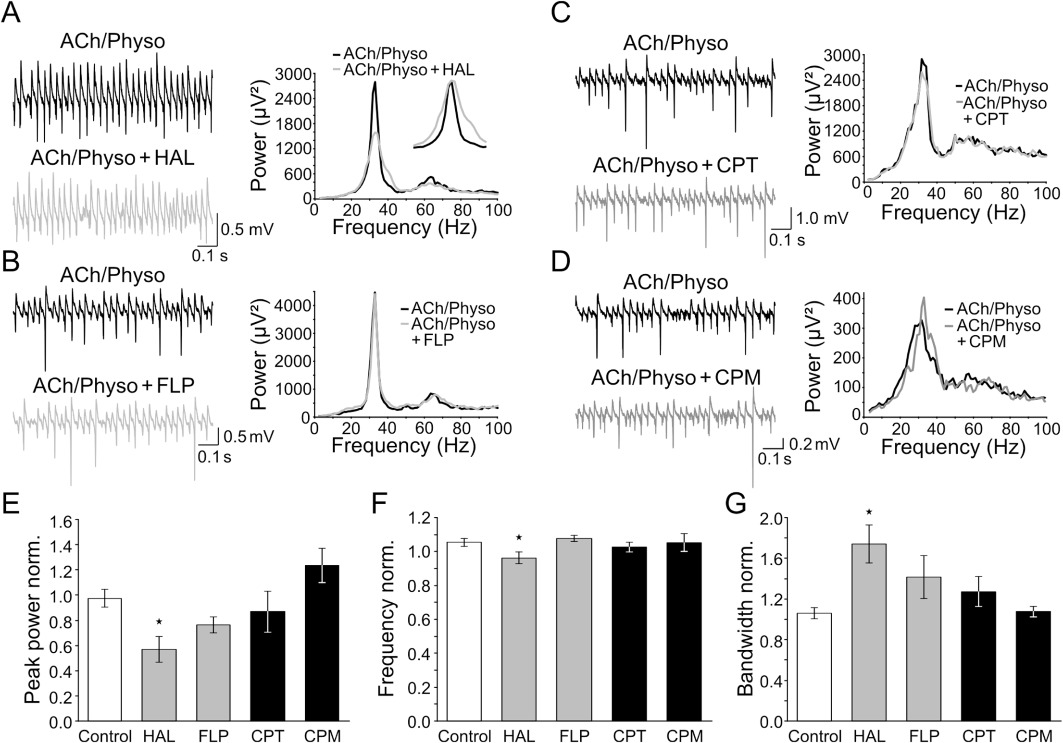
High- and low-potency first generation antipsychotics (FGAs) differentially alter ACh-induced gamma oscillations. (A–D) Left: field recordings of ACh-induced gamma oscillations before and during the application of the high-potency FGAs haloperidol (HAL, A) and flupenthixol (FLP, B), and the low-potency FGAs chlorprothixene (CPT, C) and chlorpromazine (CPM, D). Right: corresponding power spectra of the oscillations directly before (black) and 60 min after the application of the particular FGA (grey). Insets show the same power spectra rescaled for the peak to better illustrate the effects of HAL and FLP on bandwidth. (E–G) Quantification of the experiments shown in (A–D). Columns represent the change in the peak power (E), peak frequency (F) and peak bandwidth (G) of ACh-induced gamma oscillations normalized to the baseline directly before the wash-in of the high-potency (grey) and low-potency (black) FGAs (n= 7–8). *P < 0.05 compared with time-matched controls (white, n= 9) (anova with Fisher's least significant difference post hoc test).
Application of flupenthixol (30 µM), another high-potency FGA, did not significantly affect gamma oscillations (peak power: 76.4 ± 6.3% of control; integrated power: 108.7 ± 9.8%; bandwidth: 141.5 ± 21.2%; frequency: 107.7 ± 1.7%; n= 9, P > 0.05; Figure 1B–G).
Effects of low-potency FGAs on gamma oscillations
We next applied the low-potency FGA chlorprothixene (10 µM) and found that it also did not significantly change either the peak and integrated gamma power, the bandwidth or peak frequency of gamma oscillations (86.9 ± 16.2%, 86.0 ± 13.7%, 127.2 ± 14.7% and 102.6 ± 2.9% of control, respectively; n= 7, P > 0.05; Figure 1C, E–G).
Similarly, application of chlorpromazine (10 µM), another low-potency FGA, also did not significantly affect the parameters of gamma oscillations (peak power: 123.4 ± 13.7% of control; integrated power: 123.3 ± 13.3%; bandwidth: 107.6 ± 5.1%; peak frequency: 105.3 ± 5.2%; n= 9, P > 0.05, Figure 1D–G).
Effects of SGAs on gamma oscillations
Application of clozapine (30 µM) reduced the peak power and the integrated gamma power to 32.6 ± 8.0% and 40.3 ± 7.6%, respectively (n= 10, P < 0.05, Figure 2A, E), but did not change the peak frequency of gamma oscillations (112.9 ± 4.4%, P > 0.05, Figure 2A, F). Clozapine also increased the bandwidth of the oscillations to 176.8 ± 32.3% (P < 0.05, Figure 2A, G), indicating that it reduces both the power and the coherence of gamma oscillations.
Figure 2.
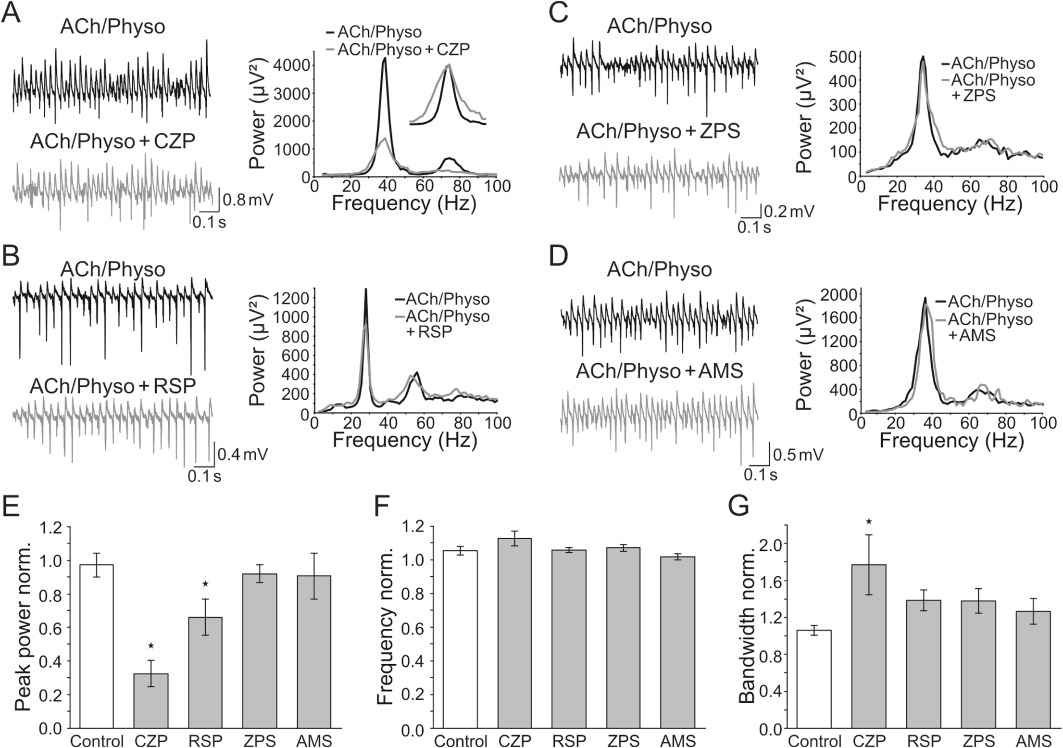
Second generation antipsychotics (SGAs) alter ACh-induced gamma oscillations with different efficacies. (A–D) Left: field recordings of ACh-induced gamma oscillations before and during the application of the SGAs clozapine (CZP, A), risperidone (RSP, B), ziprasidone (ZPS, C) and amisulpride (AMS, D). Right: corresponding power spectra of the oscillations directly before (black) and 60 min after the application of the particular SGA (grey). Inset in (A) shows the same power spectra rescaled for the peak to better illustrate the effects of CZP on bandwidth. (E–G) Quantification of the experiments shown in A–D. Bars represent the change of the peak power (E), peak frequency (F) and peak bandwidth (G) of ACh-induced gamma oscillations normalized to the baseline directly before the wash-in of the SGAs (grey, n= 7–10). *P < 0.05 compared with time-matched controls (white) (anova with Fisher's least significant difference post hoc test).
The SGA risperidone (10 µM) inhibited the peak power of gamma oscillations to 66.1 ± 10.8% (n= 9, P < 0.05, Figure 2B, E) whereas it did not significantly change the integrated gamma power, bandwidth and peak frequency of gamma oscillations (87.9 ± 10.5%, 138.4 ± 11.3% and 105.9 ± 1.4% of control, respectively, P > 0.05, Figure 2B, F, G), suggesting that it reduces the power of oscillations without affecting their coherence.
Ziprasidone (30 µM) and amisulpride (10 µM) did not significantly influence gamma oscillations (ziprasidone: peak power: 92.0 ± 5.3%; integrated power: 110.7 ± 8.5%; bandwidth: 137.9 ± 13.2%; peak frequency: 107.1 ± 2.0%; n= 11, P > 0.05; amisulpride: peak power: 90.7 ± 13.7%; integrated power: 96.1 ± 12.4%; bandwidth: 126.5 ± 14.0%; peak frequency: 101.9 ± 1.8%; n= 11, P > 0.05; Figure 2C–G).
Correlation between pKi values and changes in peak gamma power
To determine which receptors might be responsible for the modulation of gamma oscillations by the antipsychotics, we plotted the normalized changes in gamma peak power against the pKi values of the individual antipsychotics for 19 different receptors and analysed for correlation. The pKi values were from the NIMH PDSP Ki database as described in Methods. Figure 3C, D shows the r2 values and the slope of the regression for 19 receptors. A positive slope (e.g. for the 5-HT3 receptor), that is, a positive correlation between the pKi values and the normalized inhibition of peak power, indicates that drugs with high pKi values (high affinity) inhibited the power more effectively. This means that activation of the receptor may enhance power and blockade of the receptor may be responsible for the inhibitory effects on gamma oscillations. In contrast, a negative slope (e.g. for the D3 receptor) indicates that there was a negative correlation between the pKi values and the normalized inhibition of peak power values. The negative slope indicates that drugs with low pKi values (low affinity) inhibited the power more effectively, meaning that the receptor was endogenously activated during gamma oscillations and inhibited the power. The more effectively a drug inhibits the receptor, the less is the endogenous blockade of the power.
Figure 3.
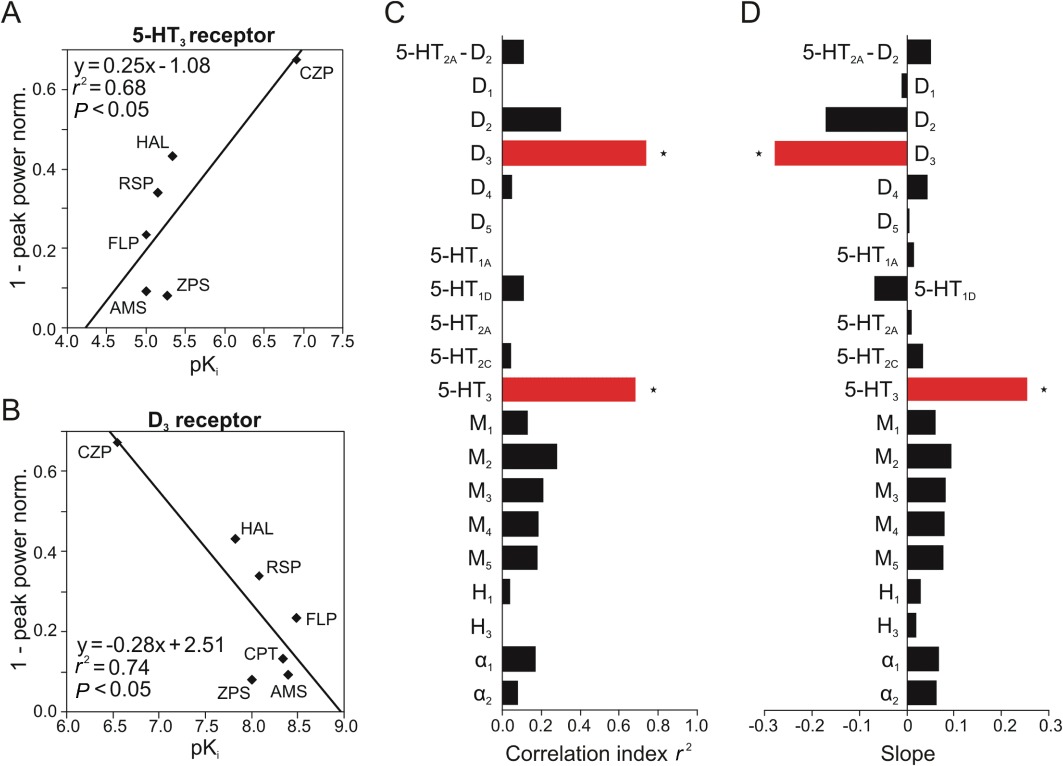
Correlations of the drug-induced inhibition of ACh-induced gamma power with the drug-receptor pKi values. The normalized inhibition of peak power (1 – peak power norm.) of ACh-induced gamma oscillations by the antipsychotics amisulpride (AMS), chlorprothixene (CPT), clozapine (CZP), flupenthixol (FLP), haloperidol (HAL), risperidone (RSP) and ziprasidone (ZPS) was plotted against the pKi values of these drugs for 19 receptors, among them the 5-HT3 (A) and the D3 receptor (B), and analysed for correlation. Chlorpromazine was excluded from the analysis because it was the only antipsychotic drug that enhanced the peak power. (C) The correlation index r2 is shown for each receptor. (D) The slope of the regression line is shown for each receptor. 5-HT2A-D2 indicates the difference in pKi values between the 5-HT2A and D2 receptors. Bars to the left indicate a negative correlation, bars to the right a positive correlation. *P < 0.05 (C, D).
As seen on Figure 3C, D, all five muscarinic receptors were found to positively correlate with the power, as expected, because the oscillations were induced by ACh. However, these correlations were found to be not significant (r2= 0.13–0.28, slope = 0.06–0.10; P > 0.05). A significant positive correlation was found for the 5-HT3 receptor (r2= 0.68, slope = 0.25; P < 0.05, Figure 3B–D), indicating that these receptors enhance gamma power. In contrast to this, the dopamine D3 receptor was found to negatively correlate with the gamma power (r2= 0.74, slope =−0.28; P < 0.05, Figure 3A, C, D), suggesting that these receptors reduce peak power. The D2 receptor also showed a negative correlation with the gamma power but without statistical significance (r2= 0.30, slope =−0.17; P > 0.05; Figure 3C, D).
Most SGAs are effective 5-HT2A receptor antagonists with much weaker D2 receptor blocking activity. The difference in pKi values between the 5-HT2A and D2 receptors (5-HT2A– D2) has been found to be higher in most SGAs than in FGAs, suggesting that a higher 5-HT2A receptor affinity over D2 receptors is characteristic of SGAs (Kuroki et al., 2008). Therefore, we also investigated whether the pKi difference 5-HT2A– D2 correlates with the effects on peak power and found that they were not significantly correlated (r2= 0.11, slope = 0.05; P > 0.05, Figure 3C, D), indicating that a difference in the affinities for 5-HT2A and D2 receptors is not responsible for the modulation of the power of gamma oscillations.
Correlation between pKi values and bandwidth
Next we plotted the normalized changes in gamma bandwidth induced by the individual antipsychotics against the pKi values and analysed for correlation. Analogous to the correlation with the reduction in peak power, the slope was negative when there was a negative correlation between the pKi value and the normalized increase of bandwidth [drugs with lower pKi values (lower affinity) increased the bandwidth more effectively], meaning that activation of the receptor potentially inhibits gamma oscillations by increasing the bandwidth. A positive slope indicates a positive correlation between the pKi value and the normalized increase of bandwidth (drugs with higher pKi values increased the bandwidth more effectively), meaning that the receptor may narrow the gamma band and thus increase the coherence of gamma oscillations.
Fewer receptors correlated with the changes in bandwidth than with the reduction in peak power (Figure 4C, D). The D3 receptor was the only one that significantly correlated with the gamma bandwidth (r2= 0.64, slope =−0.29; P < 0.05, Figure 4A, C, D), suggesting that activation of these receptors may worsen the coherence of gamma oscillations. There was also a negative relationship between the D2 receptor and the gamma bandwidth; however, it did not reach statistical significance (r2= 0.15, slope =−0.14; P > 0.05). All the other receptors showed no correlation with the bandwidth (e.g. the 5-HT3 receptor: r2= 0.15, slope = 0.14; P > 0.05, Figure 4B–D). In addition, the difference between the affinities for 5-HT2A and D2 receptors showed a negligible correlation with the bandwidth (r2= 0.01, slope = 0.02; P > 0.05, Figure 4C, D).
Figure 4.
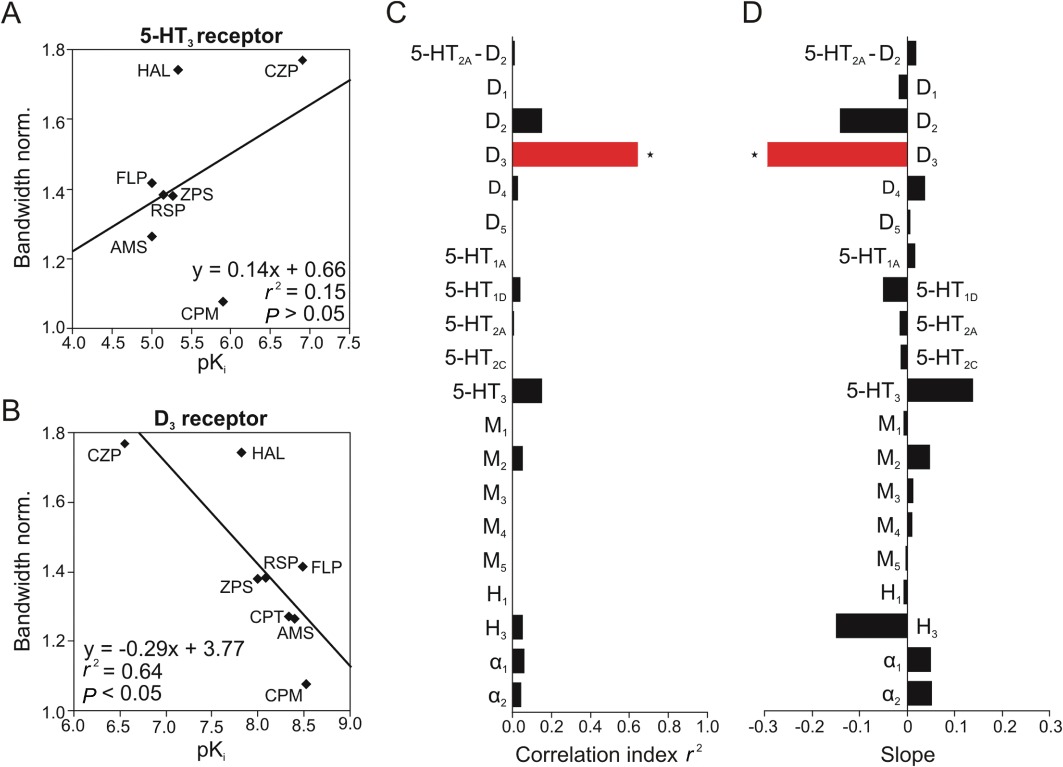
Correlations of the drug-induced increase in peak bandwidth of ACh-induced gamma oscillations with the drug-receptor pKi values. (A) The normalized increase of gamma bandwidth by the antipsychotics amisulpride (AMS), chlorpromazine (CPM), chlorprothixene (CPT), clozapine (CZP), flupenthixol (FLP), haloperidol (HAL), risperidone (RSP) and ziprasidone (ZPS) was plotted against the pKi values of these drugs for 19 receptors, among them the 5-HT3 (A) and the D3 receptor (B), and analysed for correlation. (C) The correlation index r2 is shown for each receptor. (D) The slope of the regression line is shown for each receptor. 5-HT2A-D2 indicates the difference in pKi values between the 5-HT2A and D2 receptors. Bars to the left indicate a negative correlation, bars to the right a positive correlation. *P < 0.05 (C, D).
Effects of selective agonists of 5-HT3, D3 and 5-HT2C receptors on gamma oscillations
To test the predictions of these calculations, we next applied selective agonists for 5-HT3 and D3 receptors to investigate their effects on the gamma oscillations, as these were the receptors with significant correlations. In addition, a 5-HT2C receptor agonist was used to test a receptor without any correlation (R2pos= 0.04 for pKi vs. power and R2pos= 0.005 for pKi vs. bandwidth, P > 0.05; Figures 3C and 4C). Application of the selective agonists significantly altered the peak and integrated power and bandwidth of gamma oscillations as confirmed by anova (peak power: F0.05(1),3,27= 7.524, P= 0.001; integrated power: F0.05(1),3,27= 11.868, P < 0.001; bandwidth: F0.05(1),3,27= 6.296, P= 0.002), whereas the peak frequency was not affected (F0.05(1),3,27= 2.64, P > 0.05).
The 5-HT3 receptor agonist mCPBG (30 µM) increased the peak and integrated gamma power to 149.2 ± 15.7% and 160.3 ± 17.7%, respectively (n= 7, P < 0.05; Figure 5A, D), whereas the peak frequency and the gamma bandwidth did not change (95.6 ± 2.3% and 108.9 ± 8.5% of control, respectively, P > 0.05, Figure 5A, E, F). Also the effect of the D3 receptor agonist was found to be in accordance with our prediction: the D3 agonist PD 128907 (10 µM) reduced the peak and integrated gamma power to 24.2 ± 8.4% and 36.1 ± 10.7%, respectively (n= 7, P < 0.05; Figure 5B, D), without affecting the peak gamma frequency (96.4 ± 5.4% of control, P > 0.05, Figure 5B, E). As predicted, PD 128907 also increased the bandwidth of the oscillations to 209.1 ± 33.2% of control (P < 0.05, Figure 5B, F).
Figure 5.
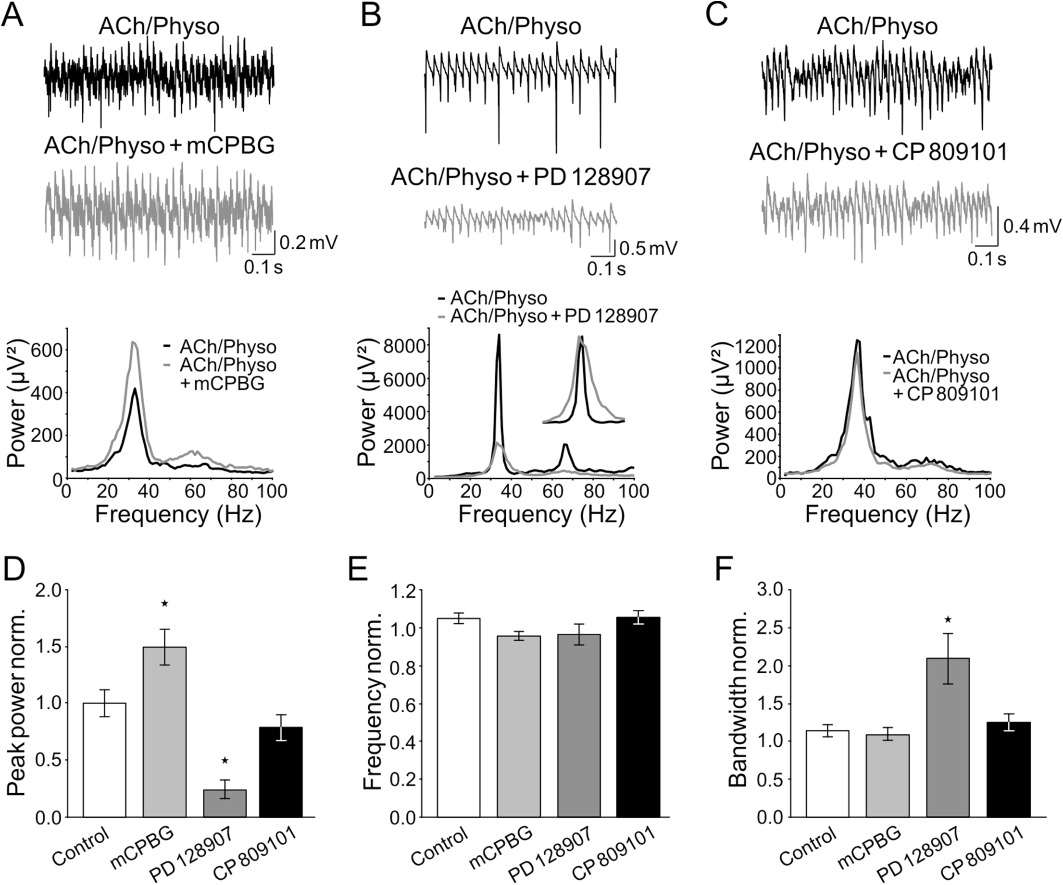
The 5-HT3 receptor agonist enhances, the dopamine D3 receptor agonist suppresses, and the 5-HT2C receptor agonist does not influence ACh-induced gamma oscillations. (A–C) Top: field recordings of ACh-induced gamma oscillations before and during the application of the 5-HT3 receptor agonist mCPBG (A), the D3 receptor agonist PD 128907 (B) and the 5-HT2C receptor agonist CP 809101 (C). Bottom: corresponding power spectra of the oscillations immediately before (black) and 60 min after the application of the particular agonist (grey). (D–F) Quantification of the experiments shown in (A–C). Columns represent the change of the peak power (D), peak frequency (E) and peak bandwidth (F) of ACh-induced gamma oscillations normalized to the baseline directly before the wash-in of mCPBG (light grey, n= 7), PD 128907 (dark grey, n= 7) and CP 809101 (black, n= 7) respectively. *P < 0.05 compared with time-matched controls (white) (anova with Fisher's least significant difference post hoc test).
To further test our correlation data, we next applied the selective 5-HT2C agonist CP 809101 (30 µM) and found that it did not change any of the peak and integrated gamma power, frequency or bandwidth of gamma oscillations (78.1 ± 11.4%, 100.0 ± 10.8%, 105.6 ± 3.4% and 124.7 ± 11.3% of control, respectively, n= 7, P > 0.05; Figure 5C–F). In conclusion, these data confirm the correlation analysis and the prediction for the receptor subtypes involved in the modulation of gamma oscillations and further verify that 5-HT3 and D3 receptors have opposing effects on hippocampal gamma oscillations.
Discussion and conclusions
We investigated the effect of antipsychotics on neural gamma oscillation power and coherence in the hippocampus. Haloperidol and clozapine inhibited gamma oscillations most effectively. FGAs with low efficacy did not reduce gamma oscillations whereas the SGAs clozapine and risperidone did so. The SGAs ziprasidone and amisulpride did not affect gamma network activity. Because the tested compounds are multi-target drugs, to find out which receptor may be responsible for the observed effects we correlated the normalized effects of antipsychotics on power and bandwidth with their receptor pKi values. Using this approach, we found that 5-HT3 receptors may have an enhancing effect on gamma oscillations whereas dopamine D3 receptors may inhibit them. To test our prediction, selective agonists were applied which revealed that selective stimulation of 5-HT3 receptors indeed increases the power of gamma oscillations and that activation of D3 receptors reduces it.
Gamma oscillations and schizophrenia
In schizophrenic patients, disturbed gamma oscillations have been observed. Whereas negative symptoms such as social and emotional withdrawal correlate with decreased gamma band activity, during positive symptoms, such as hallucinations, an increase in gamma power has been observed (Herrmann and Demiralp, 2005; Lee et al., 2010; Mulert et al., 2011). FGAs effectively reduce the positive symptoms without significantly affecting the negative ones. The introduction of SGAs in the 1990s was accompanied by promising reports, suggesting that they were able to improve the negative symptoms as well. In fact, it was found that SGAs were not more effective than FGAs, even for negative symptoms (Leucht et al., 2009). Thus, the recovery of patients with negative symptoms has still remained one of the unresolved problems of psychopharmacology (Erhart et al., 2006). We found that both FGAs and SGAs are able to reduce gamma oscillations, which is in accordance with the overall effectiveness of antipsychotics against positive symptoms. The findings that the high-potency FGA haloperidol and the SGA clozapine had the strongest inhibitory effects on gamma oscillations reflect their higher antipsychotic effectiveness in reducing the positive symptoms of schizophrenia (Essali et al., 2009; Asenjo Lobos et al., 2010).
The hypothesized relationship between schizophrenia and altered gamma oscillations is supported by a number of studies in rodents examining the effects of psychotomimetic drugs, such as MK-801 and ketamine, which have been shown to increase the gamma band power on in vivo EEGs (Pinault, 2008; Ehrlichman et al., 2009; Hong et al., 2010; Jones et al., 2011; Kocsis, 2012). Moreover, haloperidol and clozapine have been found to reduce EEG gamma power after acute s.c. administration (Jones et al., 2011) and clozapine was demonstrated to suppress synchronized pyramidal network activity in the prefrontal cortex (Gao, 2007). These findings are further supported by our results demonstrating an inhibition of in vitro gamma power by the same antipsychotic drugs. Thus, psychotic-like symptoms both in humans and rodent models are associated with an increase in gamma power and administration of high-potency antipsychotics such as clozapine and haloperidol is able to suppress this increase. However, it should be noted that these studies, similar to the present one, investigated the effect of antipsychotics on physiological gamma oscillations but not on pathologically altered gamma synchrony observed in schizophrenia.
Correlation of pKi values with the gamma-influencing effects
Antipsychotics are known to be drugs interacting with a number of receptors (Roth et al., 2004). To reveal which receptors are involved in the gamma-influencing effects of antipsychotics, we correlated these effects with their pKi values for different receptors and found that the blockade of 5-HT3 receptors by antipsychotics may be responsible for their inhibition of gamma oscillations. In contrast, the blockade of D3 receptors negatively correlated with their inhibition of gamma activity. This indicates that D3 receptor antagonism may counterbalance the inhibitory effect of antipsychotics via other receptors. Thus, our calculations suggest that activation of 5-HT3 receptors may have augmenting effects on the gamma power while activation of D3 receptors might reduce both the power and the coherence of the gamma oscillations. To test these predictions and to reveal the precise effects of these receptors on gamma oscillations, we applied selective 5-HT3, 5-HT2C and D3 receptor agonists. In accordance with the correlation data, the 5-HT3 agonist enhanced, the D3 agonist inhibited, and the 5-HT2C agonist did not affect the power of gamma oscillations. The bandwidth of the oscillations was only affected by the D3 agonist, as predicted from the calculations. These data indicate that the correlation of pKi values for different receptors with the effects of compounds interacting with multiple receptors may provide a valid approach to predict receptors involved in pharmacological effects.
Involvement of 5-HT3 and D3 receptors in the alteration of gamma oscillations
Gamma oscillations are driven by a precisely timed perisomatic feedback inhibition onto pyramidal cells (Hájos et al., 2004; Bartos et al., 2007; Gulyás et al., 2010). While parvalbumin-positive fast-spiking interneurons are the most likely generator of gamma oscillations (Gulyás et al., 2010), cholecystokinin (CCK)-containing regular spiking basket cells seem to have a modulatory role on the synchrony of neuronal populations, especially as they are able to excite parvalbumin positive cells by releasing CCK with subsequent postsynaptic activation of CCK2 receptors. This activation is target specific in that there is no significant depolarization of neighbouring pyramidal cells (Lee et al., 2011). Unlike parvalbumin-positive basket cells, CCK-containing interneurons express a number of neuromodulatory receptors such as 5-HT3, cannabinoid CB1 (Katona et al., 1999) and nicotinic α7 receptors (Morales et al., 2008) that enable the network to be modulated by extrinsic inputs and neuromodulatory signalling molecules (Freund, 2003). Indeed, activation of presynaptic CB1 receptors on CCK-containing cells has been shown to reduce gamma power, possibly due to the suppression of GABA release onto pyramidal neurons (Hájos et al., 2000).
Postsynaptic 5-HT3 receptors on these cells are also able to selectively modulate CCK-positive basket cells: they were shown to increase their excitability (McMahon and Kauer, 1997) and facilitate the spontaneous release of GABA onto the perisomatic region of pyramidal neurons (Katsurabayashi et al., 2003; Turner et al., 2004). Thus, 5-HT3 receptors are likely to increase the power of gamma oscillations by activation of the modulatory perisomatic CCK-positive basket cells. Our finding that antagonism at 5-HT3 receptors is primarily responsible for the gamma inhibitory effects of antipsychotics is indeed in line with previous findings showing that the 5-HT3 receptor antagonist ondansetron is an effective adjunctive agent to haloperidol in the therapy for chronic, treatment-resistant schizophrenia (Zhang et al., 2006).
Dopamine D3 receptor gene polymorphisms are known to be associated with schizophrenia (Jönsson et al., 2003; Talkowski et al., 2006), suggesting the involvement of this receptor in the pathophysiology of the disease. D3 receptors are expressed in the hippocampus and the mesolimbic system (Bouthenet et al., 1991; Richtand et al., 1995), structures that are involved in the aetiology of schizophrenia. In the CA1 area of the hippocampus, they have been shown to inhibit the amplitude of IPSCs evoked in stratum radiatum possibly by causing endocytosis of GABAA receptors in the apical dendrites of pyramidal cells (Hammad and Wagner, 2006; Swant et al., 2008). This inhibition of inhibitory inputs onto hippocampal pyramidal cells may represent a possible mechanism by which D3 receptors are able to suppress the power and coherence of hippocampal gamma oscillations. Our data suggest that D3 receptor agonists have an antipsychotic effect. However, because schizophrenia is characterized by disturbed (i.e. alternately enhanced and diminished) gamma oscillations, the aim of the pharmacotherapy should not be a reduction or increase of gamma oscillation power but a stabilization of the gamma activity under various circumstances (e.g. different extracellular dopamine levels). This could explain why D3 partial agonists/antagonists seem to have a better overall antipsychotic effect, including an improvement in the negative and cognitive symptoms, than selective antagonists (Joyce and Millan, 2005; Gyertyán et al., 2011; MacDonald and Bartolomé, 2010).
In conclusion, our data indicate that antipsychotics might inhibit neural gamma oscillations in the hippocampus by inhibiting 5-HT3 receptors on CCK-positive perisomatic interneurons. Moreover, selective activation of these receptors increases the power of oscillations. In contrast, D3 receptors on pyramidal cells seem to have negative modulatory effects on both the power and regularity of gamma oscillations. Our data also suggest that a correlation of receptor affinities with their biological effects can be used as a reliable approach to predict the targets responsible for the pharmacological effects of multi-target drugs.
Acknowledgments
This work was supported by the Deutsche Forschungsgemeinschaft (He 1173/17-1) and by the Hertie Foundation. S B S was a stipendiary of NeuroCure (DFG Exc 257) and Z.-J. K. was supported by the Graduiertenkolleg 1123 (Learning & Memory). The authors thank Jörg R. Geiger and Henrik Alle for their helpful comments.
Glossary
- ACh
acetylcholine
- CCK
cholecystokinin
- FGA
first generation antipsychotic
- mCPBG
m-chlorophenylbiguanide hydrochloride
- Physo
physostigmine
- SGA
second generation antipsychotic
Conflict of interest
None.
References
- Alexander SP, Mathie A, Peters JA. Guide to receptors and channels (GRAC), 5th edn. Br J Pharmacol. 2011;164(Suppl. 1):S1–S324. doi: 10.1111/j.1476-5381.2011.01649_1.x. [DOI] [PMC free article] [PubMed] [Google Scholar]
- Asenjo Lobos C, Komossa K, Rummel-Kluge C, Hunger H, Schmid F, Schwarz S, et al. Clozapine versus other atypical antipsychotics for schizophrenia. Cochrane Database Syst Rev. 2010;(11) doi: 10.1002/14651858.CD006633.pub2. CD006633. [DOI] [PMC free article] [PubMed] [Google Scholar]
- Bartos M, Vida I, Jonas P. Synaptic mechanisms of synchronized gamma oscillations in inhibitory interneuron networks. Nat Rev Neurosci. 2007;8:45–56. doi: 10.1038/nrn2044. [DOI] [PubMed] [Google Scholar]
- Bouthenet ML, Souil E, Martres MP, Sokoloff P, Giros B, Schwartz JC. Localization of dopamine D3 receptor mRNA in the rat brain using in situ hybridization histochemistry: comparison with dopamine D2 receptor mRNA. Brain Res. 1991;564:203–219. doi: 10.1016/0006-8993(91)91456-b. [DOI] [PubMed] [Google Scholar]
- Csicsvari J, Jamieson B, Wise KD, Buzsáki G. Mechanisms of gamma oscillations in the hippocampus of the behaving rat. Neuron. 2003;37:311–322. doi: 10.1016/s0896-6273(02)01169-8. [DOI] [PubMed] [Google Scholar]
- Dahl SG. Plasma level monitoring of antipsychotic drugs. Clinical utility. Clin Pharmacokinet. 1986;11:36–61. doi: 10.2165/00003088-198611010-00003. [DOI] [PubMed] [Google Scholar]
- Ehrlichman RS, Gandal MJ, Maxwell CR, Lazarewicz MT, Finkel LH, Contreras D, et al. N-methyl-D-aspartic acid receptor antagonist-induced frequency oscillations in mice recreate pattern of electrophysiological deficits in schizophrenia. Neuroscience. 2009;158:705–712. doi: 10.1016/j.neuroscience.2008.10.031. [DOI] [PubMed] [Google Scholar]
- Erhart SM, Marder SR, Carpenter WT. Treatment of schizophrenia negative symptoms: future prospects. Schizophr Bull. 2006;32:234–237. doi: 10.1093/schbul/sbj055. [DOI] [PMC free article] [PubMed] [Google Scholar]
- Essali A, Al-Haj Haasan N, Li C, Rathbone J. Clozapine versus typical neuroleptic medication for schizophrenia. Cochrane Database Syst Rev. 2009;(1) doi: 10.1002/14651858.CD000059.pub2. CD000059. [DOI] [PMC free article] [PubMed] [Google Scholar]
- Fisahn A, Pike FG, Buhl EH, Paulsen O. Cholinergic induction of network oscillations at 40 Hz in the hippocampus in vitro. Nature. 1998;394:186–189. doi: 10.1038/28179. [DOI] [PubMed] [Google Scholar]
- Fischer Y, Wittner L, Freund TF, Gahwiler BH. Simultaneous activation of gamma and theta network oscillations in rat hippocampal slice cultures. J Physiol. 2002;539:857–868. doi: 10.1113/jphysiol.2001.013050. [DOI] [PMC free article] [PubMed] [Google Scholar]
- Freund TF. Interneuron diversity series: rhythm and mood in perisomatic inhibition. Trends Neurosci. 2003;26:489–495. doi: 10.1016/S0166-2236(03)00227-3. [DOI] [PubMed] [Google Scholar]
- Fries P. Neuronal gamma-band synchronization as a fundamental process in cortical computation. Annu Rev Neurosci. 2009;32:209–224. doi: 10.1146/annurev.neuro.051508.135603. [DOI] [PubMed] [Google Scholar]
- Gandal MJ, Edgar JC, Klook K, Siegel SJ. Gamma synchrony: towards a translational biomarker for the treatment-resistant symptoms of schizophrenia. Neuropharmacology. 2012;62:1504–1518. doi: 10.1016/j.neuropharm.2011.02.007. [DOI] [PMC free article] [PubMed] [Google Scholar]
- Gao WJ. Acute clozapine suppresses synchronized pyramidal synaptic network activity by increasing inhibition in the ferret prefrontal cortex. J Neurophysiol. 2007;97:1196–1208. doi: 10.1152/jn.00400.2006. [DOI] [PubMed] [Google Scholar]
- Gregoriou GG, Gotts SJ, Zhou H, Desimone R. High-frequency, long-range coupling between prefrontal and visual cortex during attention. Science. 2009;324:1207–1210. doi: 10.1126/science.1171402. [DOI] [PMC free article] [PubMed] [Google Scholar]
- Gulyás AI, Szabó GG, Ulbert I, Holderith N, Monyer H, Erdélyi F, et al. Parvalbumin-containing fast-spiking basket cells generate the field potential oscillations induced by cholinergic receptor activation in the hippocampus. J Neurosci. 2010;30:15134–15145. doi: 10.1523/JNEUROSCI.4104-10.2010. [DOI] [PMC free article] [PubMed] [Google Scholar]
- Gyertyán I, Kiss B, Sághy K, Laszy J, Szabó G, Szabados T, et al. Cariprazine (RGH-188), a potent D3/D2 dopamine receptor partial agonist, binds to dopamine D3 receptors in vivo and shows antipsychotic-like and procognitive effects in rodents. Neurochem Int. 2011;59:925–935. doi: 10.1016/j.neuint.2011.07.002. [DOI] [PubMed] [Google Scholar]
- Hájos N, Paulsen O. Network mechanisms of gamma oscillations in the CA3 region of the hippocampus. Neural Netw. 2009;22:1113–1119. doi: 10.1016/j.neunet.2009.07.024. [DOI] [PubMed] [Google Scholar]
- Hájos N, Katona I, Naiem SS, MacKie K, Ledent C, Mody I, et al. Cannabinoids inhibit hippocampal GABAergic transmission and network oscillations. Eur J Neurosci. 2000;12:3239–3249. doi: 10.1046/j.1460-9568.2000.00217.x. [DOI] [PubMed] [Google Scholar]
- Hájos N, Pálhalmi J, Mann EO, Németh B, Paulsen O, Freund TF. Spike timing of distinct types of GABAergic interneuron during hippocampal gamma oscillations in vitro. J Neurosci. 2004;24:9127–9137. doi: 10.1523/JNEUROSCI.2113-04.2004. [DOI] [PMC free article] [PubMed] [Google Scholar]
- Hammad H, Wagner JJ. Dopamine-mediated disinhibition in the CA1 region of rat hippocampus via D3 receptor activation. J Pharmacol Exp Ther. 2006;316:113–120. doi: 10.1124/jpet.105.091579. [DOI] [PubMed] [Google Scholar]
- Hashimoto T, Volk DW, Eggan SM, Mirnics K, Pierri JN, Sun Z, et al. Gene expression deficits in a subclass of GABA neurons in the prefrontal cortex of subjects with schizophrenia. J Neurosci. 2003;23:6315–6326. doi: 10.1523/JNEUROSCI.23-15-06315.2003. [DOI] [PMC free article] [PubMed] [Google Scholar]
- Herrmann CS, Demiralp T. Human EEG gamma oscillations in neuropsychiatric disorders. Clin Neurophysiol. 2005;116:2719–2133. doi: 10.1016/j.clinph.2005.07.007. [DOI] [PubMed] [Google Scholar]
- Hong LE, Summerfelt A, Buchanan RW, O'Donnell P, Thaker GK, Weiler MA, et al. Gamma and delta neural oscillations and association with clinical symptoms under subanesthetic ketamine. Neuropsychopharmacology. 2010;35:632–640. doi: 10.1038/npp.2009.168. [DOI] [PMC free article] [PubMed] [Google Scholar]
- Jensen O, Kaiser J, Lachaux JP. Human gamma-frequency oscillations associated with attention and memory. Trends Neurosci. 2007;30:317–324. doi: 10.1016/j.tins.2007.05.001. [DOI] [PubMed] [Google Scholar]
- Jones NC, Reddy M, Anderson P, Salzberg MR, O'Brien TJ, Pinault D. Acute administration of typical and atypical antipsychotics reduces EEG gamma power, but only the preclinical compound LY379268 reduces the ketamine-induced rise in gamma power. Int J Neuropsychopharmacol. 2011;9:1–12. doi: 10.1017/S1461145711000848. [DOI] [PMC free article] [PubMed] [Google Scholar]
- Jönsson EG, Flyckt L, Burgert E, Crocq MA, Forslund K, Mattila-Evenden M, et al. Dopamine D3 receptor gene Ser9Gly variant and schizophrenia: association study and meta-analysis. Psychiatr Genet. 2003;13:1–12. doi: 10.1097/00041444-200303000-00001. [DOI] [PubMed] [Google Scholar]
- Joyce JN, Millan MJ. Dopamine D3 receptor antagonists as therapeutic agents. Drug Discov Today. 2005;10:917–925. doi: 10.1016/S1359-6446(05)03491-4. [DOI] [PubMed] [Google Scholar]
- Katona I, Sperlágh B, Sík A, Köfalvi A, Vizi ES, Mackie K, et al. Presynaptically located CB1 cannabinoid receptors regulate GABA release from axon terminals of specific hippocampal interneurons. J Neurosci. 1999;19:4544–4558. doi: 10.1523/JNEUROSCI.19-11-04544.1999. [DOI] [PMC free article] [PubMed] [Google Scholar]
- Katsurabayashi S, Kubota H, Tokutomi N, Akaike N. A distinct distribution of functional presynaptic 5-HT receptor subtypes on GABAergic nerve terminals projecting to single hippocampal CA1 pyramidal neurons. Neuropharmacology. 2003;44:1022–1030. doi: 10.1016/s0028-3908(03)00103-5. [DOI] [PubMed] [Google Scholar]
- Kilkenny C, Browne W, Cuthill IC, Emerson M, Altman DG. NC3Rs Reporting Guidelines Working Group. Br J Pharmacol. 2010;160:1577–1579. doi: 10.1111/j.1476-5381.2010.00872.x. [DOI] [PMC free article] [PubMed] [Google Scholar]
- Kissler J, Müller MM, Fehr T, Rockstroh B, Elbert T. MEG gamma band activity in schizophrenia patients and healthy subjects in a mental arithmetic task and at rest. Clin Neurophysiol. 2000;111:2079–2087. doi: 10.1016/s1388-2457(00)00425-9. [DOI] [PubMed] [Google Scholar]
- Kocsis B. Differential role of NR2A and NR2B subunits in N-methyl-D-aspartate receptor antagonist-induced aberrant cortical gamma oscillations. Biol Psychiatry. 2012;71:987–995. doi: 10.1016/j.biopsych.2011.10.002. [DOI] [PMC free article] [PubMed] [Google Scholar]
- Kuroki T, Nagao N, Nakahara T. Neuropharmacology of second-generation antipsychotic drugs: a validity of the serotonin-dopamine hypothesis. Prog Brain Res. 2008;172:199–212. doi: 10.1016/S0079-6123(08)00910-2. [DOI] [PubMed] [Google Scholar]
- Lee KH, Williams LM, Breakspear M, Gordon E. Synchronous gamma activity: a review and contribution to an integrative neuroscience model of schizophrenia. Brain Res Brain Res Rev. 2003;41:57–78. doi: 10.1016/s0165-0173(02)00220-5. [DOI] [PubMed] [Google Scholar]
- Lee SH, Kim DW, Kim EY, Kim S, Im CH. Dysfunctional gamma-band activity during face structural processing in schizophrenia patients. Schizophr Res. 2010;119:191–197. doi: 10.1016/j.schres.2010.02.1058. [DOI] [PubMed] [Google Scholar]
- Lee SY, Földy C, Szabadics J, Soltesz I. Cell-type-specific CCK2 receptor signaling underlies the cholecystokinin-mediated selective excitation of hippocampal parvalbumin-positive fast-spiking basket cells. J Neurosci. 2011;31:10993–11002. doi: 10.1523/JNEUROSCI.1970-11.2011. [DOI] [PMC free article] [PubMed] [Google Scholar]
- Leucht S, Corves C, Arbter D, Engel RR, Li C, Davis JM. Second-generation versus first-generation antipsychotic drugs for schizophrenia: a meta-analysis. Lancet. 2009;373:31–41. doi: 10.1016/S0140-6736(08)61764-X. [DOI] [PubMed] [Google Scholar]
- MacDonald GJ, Bartolomé JM. A decade of progress in the discovery and development of ‘atypical’ antipsychotics. Prog Med Chem. 2010;49:37–80. doi: 10.1016/S0079-6468(10)49002-5. [DOI] [PubMed] [Google Scholar]
- McGrath J, Drummond G, McLachlan E, Kilkenny C, Wainwright C. Guidelines for reporting experiments involving animals: the ARRIVE guidelines. Br J Pharmacol. 2010;160:1573–1576. doi: 10.1111/j.1476-5381.2010.00873.x. [DOI] [PMC free article] [PubMed] [Google Scholar]
- McMahon LL, Kauer JA. Hippocampal interneurons are excited via serotonin-gated ion channels. J Neurophysiol. 1997;78:2493–2502. doi: 10.1152/jn.1997.78.5.2493. [DOI] [PubMed] [Google Scholar]
- Mauri MC, Volonteri LS, Colasanti A, Fiorentini A, De Gaspari IF, Bareggi SR. Clinical pharmacokinetics of atypical antipsychotics: a critical review of the relationship between plasma concentrations and clinical response. Clin Pharmacokinet. 2007;46:359–388. doi: 10.2165/00003088-200746050-00001. [DOI] [PubMed] [Google Scholar]
- Minzenberg MJ, Firl AJ, Yoon JH, Gomes GC, Reinking C, Carter CS. Gamma oscillatory power is impaired during cognitive control independent of medication status in first-episode schizophrenia. Neuropsychopharmacology. 2010;35:2590–2599. doi: 10.1038/npp.2010.150. [DOI] [PMC free article] [PubMed] [Google Scholar]
- Morales M, Hein K, Vogel Z. Hippocampal interneurons co-express transcripts encoding the alpha7 nicotinic receptor subunit and the cannabinoid receptor 1. Neuroscience. 2008;152:70–81. doi: 10.1016/j.neuroscience.2007.12.019. [DOI] [PMC free article] [PubMed] [Google Scholar]
- Mulert C, Kirsch V, Pascual-Marqui R, McCarley RW, Spencer KM. Long-range synchrony of gamma oscillations and auditory hallucination symptoms in schizophrenia. Int J Psychophysiol. 2011;79:55–63. doi: 10.1016/j.ijpsycho.2010.08.004. [DOI] [PMC free article] [PubMed] [Google Scholar]
- Pinault D. N-methyl-D-aspartate receptor antagonists ketamine and MK-801 induce wake-related aberrant gamma oscillations in the rat neocortex. Biol Psychiatry. 2008;63:730–735. doi: 10.1016/j.biopsych.2007.10.006. [DOI] [PubMed] [Google Scholar]
- Richtand NM, Kelsoe JR, Segal DS, Kuczenski R. Regional quantification of D1, D2, and D3 dopamine receptor mRNA in rat brain using a ribonuclease protection assay. Brain Res Mol Brain Res. 1995;33:97–103. doi: 10.1016/0169-328x(95)00112-6. [DOI] [PubMed] [Google Scholar]
- Roth BL, Sheffler DJ, Kroeze WK. Magic shotguns versus magic bullets: selectively non-selective drugs for mood disorders and schizophrenia. Nat Rev Drug Discov. 2004;3:353–359. doi: 10.1038/nrd1346. [DOI] [PubMed] [Google Scholar]
- Schulz SB, Klaft ZJ, Rösler AR, Heinemann U, Gerevich Z. Purinergic P2X, P2Y and adenosine receptors differentially modulate hippocampal gamma oscillations. Neuropharmacology. 2012;62:914–924. doi: 10.1016/j.neuropharm.2011.09.024. [DOI] [PubMed] [Google Scholar]
- Swant J, Stramiello M, Wagner JJ. Postsynaptic dopamine D3 receptor modulation of evoked IPSCs via GABA(A) receptor endocytosis in rat hippocampus. Hippocampus. 2008;18:492–502. doi: 10.1002/hipo.20408. [DOI] [PubMed] [Google Scholar]
- Talkowski ME, Mansour H, Chowdari KV, Wood J, Butler A, Varma PG, et al. Novel, replicated associations between dopamine D3 receptor gene polymorphisms and schizophrenia in two independent samples. Biol Psychiatry. 2006;60:570–577. doi: 10.1016/j.biopsych.2006.04.012. [DOI] [PubMed] [Google Scholar]
- Traub RD, Bibbig A, LeBeau FE, Buhl EH, Whittington MA. Cellular mechanisms of neuronal population oscillations in the hippocampus in vitro. Annu Rev Neurosci. 2004;27:247–278. doi: 10.1146/annurev.neuro.27.070203.144303. [DOI] [PubMed] [Google Scholar]
- Turner TJ, Mokler DJ, Luebke JI. Calcium influx through presynaptic 5-HT3 receptors facilitates GABA release in the hippocampus: in vitro slice and synaptosome studies. Neuroscience. 2004;129:703–718. doi: 10.1016/j.neuroscience.2004.08.020. [DOI] [PubMed] [Google Scholar]
- Womelsdorf T, Schoffelen JM, Oostenveld R, Singer W, Desimone R, Engel AK, et al. Modulation of neuronal interactions through neuronal synchronization. Science. 2007;316:1609–1612. doi: 10.1126/science.1139597. [DOI] [PubMed] [Google Scholar]
- Zhang ZJ, Kang WH, Li Q, Wang XY, Yao SM, Ma AQ. Beneficial effects of ondansetron as an adjunct to haloperidol for chronic, treatment-resistant schizophrenia: a double-blind, randomized, placebo-controlled study. Schizophr Res. 2006;88:102–110. doi: 10.1016/j.schres.2006.07.010. [DOI] [PubMed] [Google Scholar]