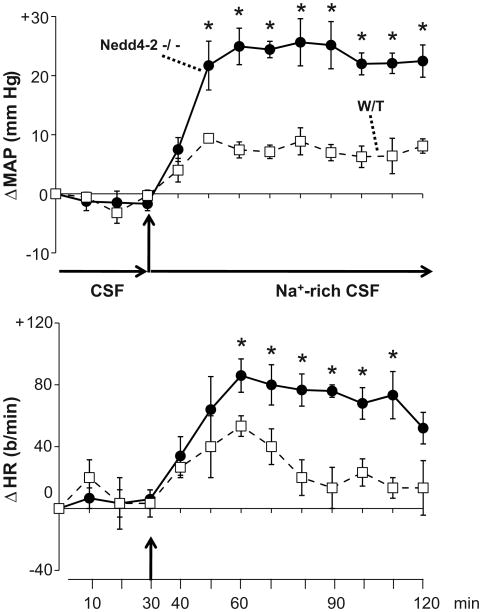
Figure 3.
Enhanced responses of mean arterial pressure (MAP) and heart rate (HR) to icv infusion of Na-rich aCSF (235 mM Na) at 0.4 μl/min in Nedd4-2 −/− mice versus W/T controls (n=5/group). Blood pressures were averaged over 10-min intervals. Values represent the mean ± SEM of the change from baseline. Baseline MAP and HR preceding the start of aCSF were: 114 ± 3 mmHg, 513 ± 35 b/min for W/T vs. 114 ± 2 mmHg, 516 ± 27 b/min for −/− mice.
* p < 0.05 vs W/T

