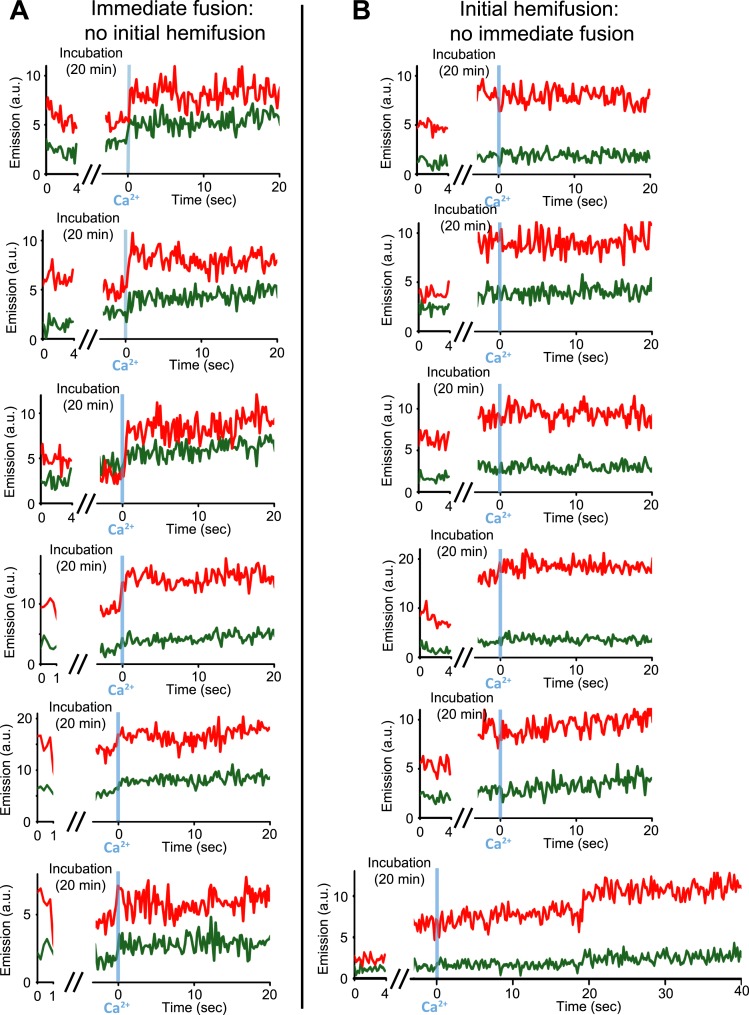
Figure 4.
Upon Ca2+-injection, immediate fusion events start form hemifusion-free point contacts whereas initially hemifused states are slow to fuse. (A) Representative real-time fluorescence intensity traces of instances of immediate fusion with imaging of initial florescence intensity levels right after addition of donor (synaptobrevin and synaptotagmin 1) to acceptor vesicles (syntaxin and SNAP-25) (red/upper traces: lipid dye fluorescence intensity, green/lower traces: content dye fluorescence intensity). Time point 0 indicates the instance of Ca2+ injection at 500 μM (blue vertical lines). As in Figure 1, immediate fusion is defined as a content dye fluorescence intensity jump that occurs during the first 600 ms time bin upon Ca2+ injection. In all cases, no significant (i.e., above noise level) lipid fluorescence intensity change was observed during the incubation period, which excludes the possibility of a hemifused initial state before Ca2+ triggering. Moreover, ‘all’ (seven) observed traces with immediate fusion upon Ca2+ injection exhibited this behavior. (B) Representative real-time fluorescence intensity traces of cases where the membranes are hemifused prior to Ca2+-injection. Initial hemifusion was characterized by a significant increase (i.e., above noise level) in only lipid dye fluorescence intensity between the initial recording and at the end of incubation period at 0 Ca2+. For approximately 400 fluorescent spots co-localized in both the initial recording and at the end of the incubation period, we observed 51 traces showing (1) an increase in lipid dye fluorescence and (2) no change in content dye fluorescence intensity during the incubation period but before the Ca2+ injection. For most of the 51 cases, no content mixing was observed upon Ca2+-injection during the observation period of 50 s except for two cases (see one example in the bottom panel) where delayed content mixing occurred at a later time. For illustration purposes only 20 s of the 50 s observation period are shown all traces but one since there was no change in the subsequent 30 s.

