

Abstract
Activation of phosphatidylinositol 3-kinase (PI3K)/Akt signaling is associated with tumorigenesis and metastasis of colorectal cancer (CRC). The mammalian target of rapamycin (mTOR) kinase, a downstream effector of PI3K/Akt signaling, regulates tumorigenesis and metastasis of CRCs, indicating that mTOR inhibition may have therapeutic potential. Notwithstanding, many cancers, including CRC, demonstrate resistance to the antitumorigenic effects of rapamycin. In this study, we show that inhibition of mTORC1 with rapamycin leads to feedback activation of PI3K/Akt and Ras-MAPK signaling, resulting in cell survival and possible contribution to rapamycin resistance. Combination with the multikinase inhibitor, sorafenib, abrogates rapamycin-induced activation of PI3K/Akt and Ras-MAPK signaling pathways. Combination of rapamycin with sorafenib synergistically inhibits proliferation of CRC cells. CRCs harboring coexistent KRAS and PIK3CA mutations are partially sensitive to either rapamycin or sorafenib monotherapy, but highly sensitive to combination treatment with rapamycin and sorafenib. Combination with sorafenib enhances therapeutic efficacy of rapamycin on induction of apoptosis and inhibition of cell-cycle progression, migration and invasion of CRCs. We demonstrate efficacy and safety of concomitant treatment with rapamycin and sorafenib at inhibiting growth of xenografts from CRC cells with coexistent mutations in KRAS and PIK3CA. The efficacy and tolerability of combined treatment with rapamycin and sorafenib provides rationale for use in treating CRC patients, particularly those with tumors harboring coexistent KRAS and PIK3CA mutations.
Abbreviations:
- CI
combination index
- CRC
colorectal cancer
- IHC
immunohistochemistry
- MAPK
mitogen activated protein kinase
- mTOR
mammalian target of rapamycin
- PI3K
phosphatidylinositol 3-kinase.
Introduction
Activation of phosphatidylinositol 3-kinase (PI3K) signaling by mutations in the PIK3CA oncogene or the tumor suppressor PTEN is associated with tumorigenesis, motility and metastasis of a number of cancers, including colorectal cancer (CRC) [1,2]. Current dogma predicates that cancers dependent on activation of the PI3K/Akt pathway signal through the downstream protein, mammalian target of rapamycin (mTOR), to drive tumorigenesis [3]. PIK3CA mutations often coexist with KRAS and/or BRAF mutations, which serve to activate the Ras-mitogen activated protein kinase (MAPK) pathway; these pathways cooperate to drive the growth of several human tumors [4–6].
mTOR is a serine/threonine kinase that regulates cell growth and metabolism. It forms two, distinct functional complexes: mTORC1 and mTORC2 [3]. mTORC1 phosphorylates and activates the eukaryotic translation initiation factor 4E (eIF4E) binding protein (4E-BP1) and the p70S6 ribosomal kinase (S6K), which regulate protein synthesis [7]. Conversely, mTORC2 plays a role in regulating cell proliferation and survival, as well as cell-cycle-dependent changes in the actin cytoskeleton. mTORC2 is the major hydrophobic kinase to phosphorylate the Serine 473 residue of Akt, which is required for complete activation of the latter, thus placing mTOR both upstream and downstream of Akt [3,8]. We have shown previously that both mTORC1 and mTORC2 regulate the tumorigenesis and metastasis of CRCs [9]. The bacterially derived drug, rapamycin, complexes with the FK506 binding protein (FKBP) 12, and the drug-receptor complex inhibits mTOR activity [3,10]. Rapamycin moderately inhibits mTORC1; mTORC2 is thought to be rapamycin insensitive, but prolonged treatment inhibits its assembly in certain cells [3,8].
Despite the seemingly clear mechanism of action of rapamycin and sound rationale for its use in cancer therapy, first-generation mTOR inhibitors have had only modest and unpredictable success in clinical trials for most solid tumors [3,10]. Inhibition of mTORC1 by rapamycin leads to loss of negative feedback via S6K and insulin-like growth factor-1 receptor (IGF-1R), which results in feedback activation of Akt [11]. Moreover, inhibition of mTORC1 with rapamycin also activates Ras/MAPK signaling through an S6K-PI3-KRAS feedback loop in several different types of cancers dependent on PI3K signaling [12]. These findings have important therapeutic implications since feedback activation of PI3K/Akt and Ras/MAPK signaling promotes cell survival and resistance to the therapeutic effects of mTORC1 inhibition using rapamycin.
Sorafenib is a multikinase inhibitor of Ras/MAPK signaling at the level of Raf kinase, which also inhibits several other growth factor receptors, such as VEGFR and PDGFR [13,14]. Its potent antiproliferative and antiangiogenic effects make it an attractive agent in the treatment of solid tumors. Unlike other Ras/MAPK pathway inhibitors, which are currently in various phases of preclinical testing and early phases of clinical trials, sorafenib is approved by the FDA for treatment of renal cell carcinoma and hepatocellular carcinoma, which facilitates rapid incorporation into clinical trials for patients with other solid tumors [15,16]. In this study, we determined the efficacy of combined sorafenib and rapamycin treatment against CRC tumorigenesis and progression.
Materials and methods
Immunohistochemistry
Tissue microarrays containing normal and cancer tissues, A203 (VI), were purchased from ISUABXIS through Accurate Chemical & Scientific Corporation (Westbury, NY). Each array consisted of tissue derived from 20 patients: 40 tumor cores, 10 normal cores. Immunohistochemistry (IHC) was performed as described previously [9,17]. Scoring was performed blindly by a pathologist according to a semiquantitative seven-tier system developed by Allred et al. [18]. pAktSer473 and pERKThr202/Tyr204 antibodies were purchased from Cell Signaling (Danvers, MA).
Cell lines, plasmid transfections and lentiviral transductions
The human CRC cell lines HCT116, SW620, DLD-1, HT-29 and Caco-2 were obtained from American Type Culture Collection (Manassas, VA). Generation of HCT116 stable knockdown mTOR, Raptor, Rictor and TSC2 cells was performed as described previously [9].
Cell proliferation and apoptosis analysis
Equal numbers of cells were seeded onto 24-well plates at a density of 2×10⁴ cells per well in the appropriate culture medium with supplements. For proliferation, cells were treated with varying doses of rapamycin (Calbiochem, San Diego, CA) and/or sorafenib (Bayer Pharmaceuticals, Seattle, WA) for 72h. Cells were trypsinized and counted using a cell counter (Beckman-Coulter, Fullerton, CA). For apoptosis assays, cells were serum starved for 24h, treated with rapamycin and/or sorafenib for 48h and apoptosis was measured using the Cell Death Detection ELISAplus (Roche, Indianapolis, IN) as detailed in the manufacturer’s instructions. Control group was treated with appropriate vehicle for all experiments.
Cell-cycle analysis
Cells (1×10⁴) were trypsinized, washed with PBS and fixed in 70% methanol. Fixed cells were then washed with PBS, incubated with 100 μg/ml RNAase for 30min at 37°C, stained with propidium iodide (50 μg/ml). Cells were subjected to flow cytometry analysis using Becton Dickinson FACScanto (Franklin Lakes, NJ). The percentages of cells in different cell cycle phases were analyzed using ModFit LT software (Verity Software House).
Western blot analysis
Western blot analysis was performed as described previously [9,17]. The following antibodies were from Cell Signaling (Danvers, MA): pAktSer473, pAktThr308, pERKThr202/Tyr204, total Akt, total ERK, β-actin, TSC2, p-p70S6KThr389 and pS6Ser235/236.
Immunofluorescence
Immunofluorescence staining was performed as described previously [19]. Foxo3a antibody was obtained from Santa Cruz (Santa Cruz, CA). Images were acquired using Nikon TE2000 inverted microscope (200x objective) and NIS Elements AR3.10 software.
Migration assay
A monolayer wound-healing (scratch) assay was used to compare the migratory ability of HCT116 cells treated with rapamycin (50nM) and/or sorafenib (5 μM) as described previously [19]. Control group was treated with appropriate vehicle for all experiments.
Invasion assay
A modified Boyden chamber assay with Matrigel-coated Transwell chambers was performed with HCT116 cells treated with rapamycin (50nM) and/or sorafenib (5 μM) as described previously [19]. Control group was treated with appropriate vehicle for all experiments.
Soft agar colony formation
HCT116 cells were plated in six-well plates at concentrations of 5×10³ cells per well. The final concentration of base agar was 0.8%, while the final concentration of top agar was 0.4% (Lonza, Rockland, ME). Appropriate drug treatment was added to the overlying medium. After incubation for 30 days, colonies were stained with a 0.01% crystal violet solution, washed with distilled water to remove excess dye, imaged using the Alpha Innotech Imaging system and quantified using the AlphaEase software.
In vivo studies
HCT116 cells were collected in 100 µl of sterile PBS and inoculated subcutaneously into 6-week-old male athymic nude mice at 1×10⁶ cells per injection site. The mice were then randomized into four groups (n = 5 for each group): (a) Vehicle, (b) Rapamycin, 5mg/kg, (c) Sorafenib, 30mg/kg, or (d) Rapamycin (5mg/kg) and Sorafenib (30mg/kg). Rapamycin was dissolved in 4% ethanol/5% PEG400/5% Tween 80 in water. Sorafenib was dissolved in Cremophor EL/ethanol (50:50; Sigma Cremophor EL, 95% ethyl alcohol) in water. All mice were given vehicle, rapamycin and/or sorafenib via oral gavage five days per week. The tumor size was measured with a vernier caliper and the tumor volume was defined as (longest diameter) × (shortest diameter)2 / 2. At the end of the experiment (day 23 post injection), mice were sacrificed and tumors removed, weighed and processed for IHC and western blot analysis. All animal procedures were performed in the nude mouse facility using protocols approved by the Institutional Animal Care and Use Committee.
Statistical analysis
Comparisons of semiquantitative IHC scores were performed using Wilcoxon rank-sum test or the signed rank test (Figure 1). Correlations between biomarkers were assessed by calculating Spearman’s correlation coefficient. In vitro combination studies of rapamycin and sorafenib to assess cell numbers were performed by evaluating several dose levels of each agent as well as several dose levels of the combination of the two agents. Analysis of variance model was employed to compare between treatment groups and across dose levels. Furthermore, assessments of synergy using fixed constant ratio of the combination agents were accomplished by calculating combination index and isobologram (Figure 2) [20]. Analysis of variance model which incorporates treatment group, cell line and several time points of measurement as well as interaction between factors were utilized for analysis for proliferation experiments measuring cell numbers in Figures 3 and 4. Contrasts were generated from the model for specific pairwise comparisons between treatment and control or between combination versus single agent therapies at specific time points of interest (Figure 5). Likewise, tumor-volume and tumor-weight data using xenograft mouse models was compared between treatment groups by analysis of variance (Figure 6). All error bars refer to standard deviation from the mean.
Fig. 1.

PI3K/Akt and Ras/MAPK signaling pathways are activated in stage IV CRC patient tissues and mTORC1 inhibition results in feedback induction of Ras/MAPK signaling. (A) Expression of pERKThr202/Tyr204 and pAktSer473 in tissues from stage IV CRC patients (200x magnification; n = 20 cases; 80 tumor cores, 20 non-neoplastic cores); (B) Distribution of pERKThr202/Tyr204 and pAktSer473 immunoreactivity scores; (C) Correlation in pERKThr202/Tyr204 and pAktSer473 immunoreactivity scores in samples derived from the same patient.
Fig. 2.
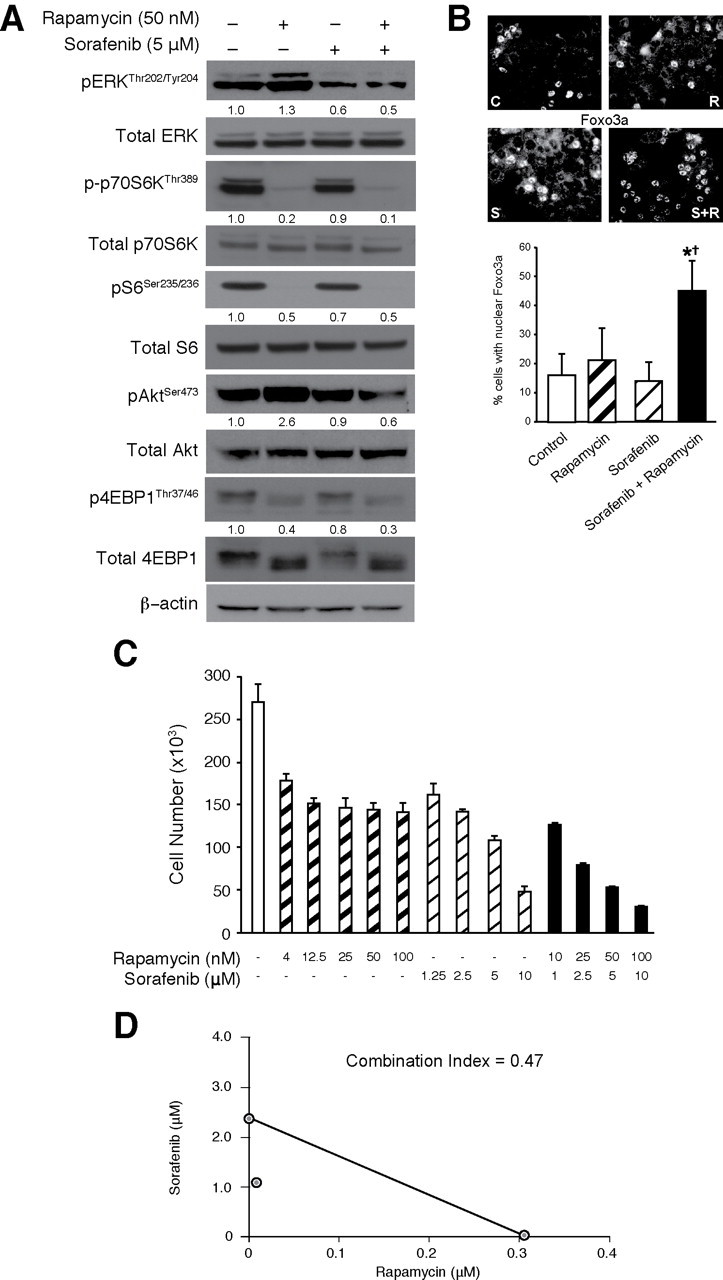
Combination with sorafenib abrogates feedback induction of PI3K/Akt and Ras/MAPK signaling on treatment with rapamycin. (A) Western blotting and (B) Immunofluorescence analysis of HCT116 cells after combined with rapamycin (R; 50nM), sorafenib (S; 5 μM), or the combination (R + S) for 24h (C = Control). Numbers under each lane represent relative densitometric values after normalization with β-actin (A). (C) HCT116 cells were treated with varying concentrations of rapamycin (0–100nM) and/or sorafenib (0–10 μM) for 72h and cell numbers were counted. (D) Isobologram demonstrating the interaction between varying concentrations of rapamycin and sorafenib in HCT116 cells.
Fig. 3.
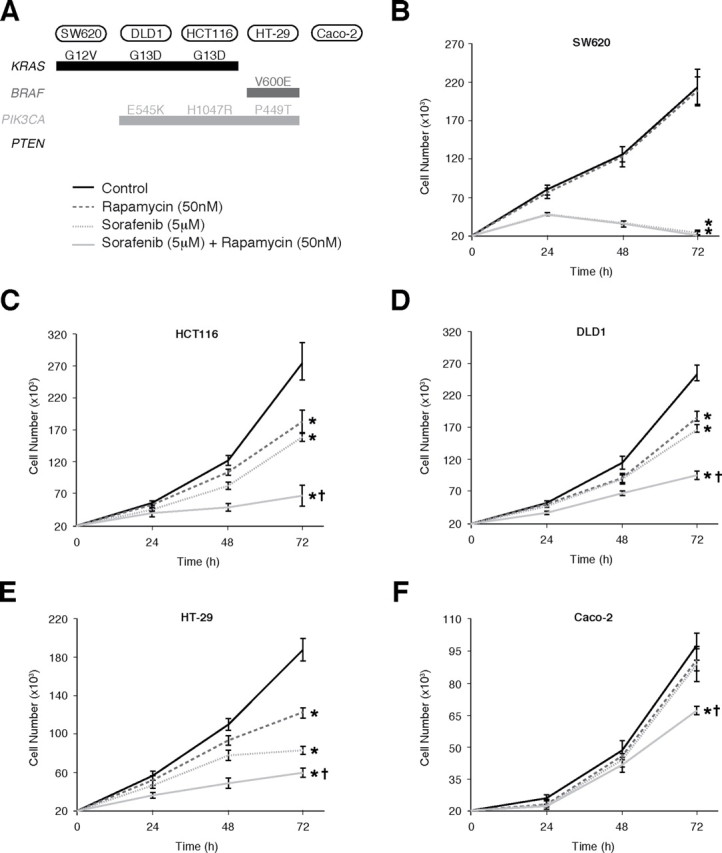
Effects of combined rapamycin and sorafenib treatment on CRC proliferation. (A) Mutation status of KRAS, BRAF, PIK3CA and PTEN in CRC cells; (B)–(F) Assessment of proliferation by counting cell numbers after treatment with rapamycin (50nM) and/or sorafenib (5 μM). (*P < 0.05 versus control; † P < 0.05 versus rapamycin or sorafenib monotherapy)
Fig. 4.

Oncogenic KRAS and PIK3CA mutations determine the response of CRCs to rapamycin and sorafenib. Assessment of proliferation by counting cell numbers after treatment of isogenic HCT116 cells, with deletion of mutant PIK3CA (A) or KRAS (B) allele, with rapamycin (50nM) and/or sorafenib (5 μM). (*P < 0.05 versus control; †P <0.05 versus rapamycin or sorafenib monotherapy)
Fig. 5.

Functional effects of combined rapamycin and sorafenib treatment. HCT116 cells treated with rapamycin (50nM) and/or sorafenib (5 μM) were assessed for (A) serum-starvation induced apoptosis using Cell Death Detection ELISAplus; (B) cell cycle progression using flow cytometry; (C) migration using wound healing assay and (D) invasion using Boyden chamber assay with 10% FBS as chemoattractant. (*P < 0.05 versus control; †P < 0.05 versus rapamycin or sorafenib monotherapy)
Fig. 6.

Combined treatment with rapamycin and sorafenib suppresses growth of CRC xenografts in vivo. Athymic nude mice were inoculated subcutaneously with HCT116 cells. Five mice were used in each group, and cells were inoculated at one site in each mouse. Treatments were started when size of tumors reached ~100mm3 (horizontal dotted line in (A)). Size of the tumors was measured after 23 days of treatment with vehicle, rapamycin (5mg/kg), sorafenib (30mg/kg) or rapamycin and sorafenib (same doses as monotherapy treatment groups). Final (A) tumor weight and (B) tumor volume (*P < 0.05 versus control; †P < 0.05 versus rapamycin or sorafenib monotherapy). (C)–(D). Representative images of mice with tumors from each treatment group.
Results
Both PI3K/Akt and Ras/MAPK signaling pathways are activated in stage IV CRCs. To determine the specific expression changes associated with CRC growth and progression, we analyzed tissues from 20 stage IV CRC patients for pAktSer473 and pERKThr202/Tyr204 expression in matched normal colon, primary tumor and associated liver metastasis. Each sample was assigned an immunoreactivity score ranging from 0–6. Representative samples for each protein are shown (Figure 1A) along with analysis (Figure 1B). Paired comparisons of immunoreactivity scores between normal versus primary tumors and normal versus metastatic tumors were significant (P ≤ 0.001) for both proteins. However, no significant differences were observed between primary tumors versus liver metastases. Furthermore, there was a significant positive correlation noted between pAktSer473 and pERKThr202/Tyr204 expression in both normal colonic tissue (r = 0.84, P = 0.0002) and tumor tissue (including both primary tumor and liver metastases; r = 0.77, P < 0.0001), suggesting that both pathways are commonly activated in the same patient (Figure 1C). Taken together, these findings suggest that both PI3K/Akt and Ras/MAPK pathways are activated in primary CRCs and that this increased expression is maintained in the associated distant metastasis. Moreover, these two pathways may cooperate to drive the aberrant growth and progression of advanced CRCs.
Sorafenib abrogates the rapamycin-induced feedback induction of PI3K/Akt and Ras/MAPK signaling upon mTORC1 inhibition. We have previously shown that mTOR signaling plays a critical role in regulating the tumorigenesis and metastasis of CRC [9,19]. However, the response to the anti-proliferative effects of rapamycin is highly variable. To elucidate the mechanisms contributing to rapamycin resistance, we determined the effect of rapamycin on intracellular signaling in CRC cells with aberrant PI3K/Akt signaling. HCT116 cells, harboring a PIK3CA mutation (H1047R), treated with rapamycin (50nM) over a 24h time period demonstrate induction of both pAktSer473 and pERKThr202/Tyr204 levels (Figure 2A).
Sorafenib is a multikinase inhibitor, which potently inhibits the Ras/MAPK pathway at the level of BRAF kinase [13–16]. We found that the combination of rapamycin with sorafenib attenuates feedback activation of pERKThr202/Tyr204, which was noted on treatment with rapamycin alone (Figure 2A). Surprisingly, sorafenib also reduced rapamycin-mediated feedback activation of pAktSer473. We confirmed this finding by evaluating the nuclear translocation of Foxo3a as a result of dephosphorylation of Akt. As shown in Figure 2B, we noted a significant induction of nuclear translocation of Foxo3a upon combination of sorafenib with rapamycin. The finding that combination of rapamycin with sorafenib can attenuate the feedback induction of PI3K/Akt and Ras/MAPK signaling, both of which may contribute to rapamycin resistance noted in CRC, prompted us to pursue the potential therapeutic benefit of this combination in CRC treatment.
We hypothesized that the aforementioned modulation of signaling pathways observed with the sorafenib and rapamycin combination would result in synergistic interactions between these two agents. We determined the effect of combining varying concentrations of both rapamycin and sorafenib on HCT116 cell proliferation over a period of 72h (Figure 2C) and performed combination index (CI) analysis (Figure 2D) using the Chou-Talalay method to assess whether the interactions between these targeted therapies are synergistic (CI < 1), additive (CI = 1) or antagonistic (CI > 1) [20]. At the ED50 doses for both rapamycin and sorafenib, we found that CI = 0.47, suggesting that rapamycin and sorafenib synergistically inhibit proliferation of CRCs. We hypothesize that the synergism noted between rapamycin and sorafenib may be due to the ability of sorafenib to attenuate the induction of PI3K/Akt and Ras/MAPK signaling noted with rapamycin monotherapy. Taken together, these findings demonstrate that the combination of rapamycin with sorafenib is synergistic and more effective in inhibiting proliferation of CRCs than treatment with either agent alone.
Effects of combined rapamycin and sorafenib treatment on proliferation of CRCs with variable genetic backgrounds.Since rapamycin and sorafenib synergize to inhibit proliferation, we analyzed a panel of CRC cell lines, harboring varying genetic mutations in KRAS, BRAF and PIK3CA, for their sensitivity to the antiproliferative effects of rapamycin and sorafenib (Figure 3A). We found that CRC cells with mutational activation of the Ras/MAPK signaling pathway (KRAS or BRAF mutations), including SW620, HCT116, DLD1 and HT-29, were sensitive to sorafenib monotherapy (Figure 3B–E). In contrast, Caco-2 cells, which lack mutational activation of either KRAS or BRAF, were resistant to sorafenib monotherapy (Figure 3F). Furthermore, CRC cells with PIK3CA mutations, including HCT116, DLD1 and HT-29, were sensitive to rapamycin monotherapy, while those lacking mutational activation of the PI3K/Akt pathway (SW620, Caco-2) were resistant.
PIK3CA or PTEN mutations often coexist with KRAS or BRAF mutations in CRC cells [4]. Although CRC cells with coexistent mutations in PIK3CA and KRAS (HCT116 and DLD1) were sensitive to rapamycin and sorafenib monotherapy, we found that these cells only displayed a modest (30–40%) decrease in proliferation upon treatment with either agent alone. However, combination treatment with rapamycin and sorafenib resulted in significant greater inhibition of proliferation of these cells compared to either monotherapy (Figures 3C and 3D). Similar results were noted in HT-29 cells, which have coexistent mutations in PIK3CA and BRAF (Figure 3E). Finally, in Caco-2 cells, which lack mutational activation of either PI3K/Akt or Ras/MAPK signaling, no differences were noted in monotherapy, and while combination treatment significantly inhibited proliferation, the effect was more modest than in other cell lines (Figure 3F). Taken together, these findings suggest that CRCs harboring coexistent mutational activation of PI3K/Akt and Ras/MAPK signaling are only partially sensitive to either rapamycin or sorafenib monotherapy, but are highly sensitive to combination treatment with rapamycin and sorafenib.
Oncogenic KRAS and PIK3CA mutations affect the response of CRCs to rapamycin and sorafenib. Based on the above findings, we hypothesized that oncogenic activation of PI3K/Akt and Ras/MAPK signaling, by PIK3CA and KRAS mutations, respectively, could represent a major genetic determinant of the response to treatment with rapamycin and sorafenib in CRCs. To test the effects of the PIK3CA mutation upon response to rapamycin and sorafenib, we used HCT116 cells with genetic deletion of the PIK3CA R1047 mutant allele [21]. Consistent with our previous finding that CRC cells with mutational activation of PIK3CA are sensitized to the antiproliferative effects of rapamycin, we found that HCT116-derived isogenic cells, retaining only the wild-type PIK3CA allele, were slightly less sensitive to rapamycin as compared to the isogenic cells with only the mutant PIK3CA allele (Figure 4A). Moreover, the combination of rapamycin with sorafenib was more effective than either agent alone in cells with coexistent KRAS and PIK3CA mutations, but not in cells retaining only the wild-type PIK3CA allele along with mutant KRAS.
To determine the effects of the KRAS mutation on response to rapamycin and sorafenib, we utilized HCT116 cells in which the KRAS D13 mutant allele has been genetically deleted by homologous recombination [22]. Interestingly, HCT116-derived isogenic cells retaining only the wild-type KRAS allele (HKe-3) were resistant to sorafenib, but were more sensitive to rapamycin compared to either parental or isogenic cells with mutant KRAS (Figures 3C and 4B). Furthermore, the combination of rapamycin and sorafenib inhibited proliferation to the same extent as rapamycin monotherapy in these isogenic mutant cells with deletion of the mutant KRAS allele. These findings suggest that KRAS mutation may confer resistance to rapamycin and may be required for sensitivity to sorafenib in CRCs. Moreover, combination treatment with rapamycin and sorafenib is more effective than treatment with either agent alone in CRCs harboring coexistent KRAS and PIK3CA mutations.
Functional effect of combined rapamycin and sorafenib treatment on apoptosis, cell cycle progression, migration, invasion and soft agar colony formation in CRCs with coexistent PIK3CA and KRAS mutational activation. The mTOR signaling pathway plays a critical role in several processes underlying CRC tumorigenesis and metastasis, including apoptosis, cell-cycle progression, soft agar colony formation, migration and invasion; however, previous studies have shown that rapamycin only partially inhibits these functions [9,19]. Based on our above findings, we hypothesized that treatment with sorafenib will enhance the efficacy of rapamycin in the inhibition of these processes.
The synergistic interaction between rapamycin and sorafenib in decreasing cell proliferation may be attributed to decreased cell-cycle progression and/or increased induction of apoptosis. We determined the effects of rapamycin and/or sorafenib on serum-starvation induced apoptosis in these cells. As shown in Figure 5A, HCT116 cells treated with both rapamycin and sorafenib demonstrated significantly increased sensitivity to serum-starvation induced apoptosis compared to cells treated with either rapamycin or sorafenib alone. Furthermore, the percentage of cells in S-phase decreased, while the percentage of cells in G0/G1 increased markedly in HCT116 cells treated with both rapamycin and sorafenib compared to cells treated with either agent alone (Figure 5B and Supplemental Figure 1).
We have recently demonstrated a critical role for mTORC1 and mTORC2 in regulating the migration, invasion and metastasis of CRCs [19]. However, treatment with rapamycin only attenuated the migration and invasion of HCT116 cells by approximately 40–50%. Therefore, we determined the effect of combining rapamycin with sorafenib on migration and invasion of CRC cells. We found that HCT116 cells treated with both rapamycin and sorafenib demonstrated significantly decreased migration and invasion compared to cells treated with either rapamycin or sorafenib alone (Figures 5C and 5D, respectively). Finally, we also determined the effects of rapamycin and/or sorafenib on soft agar colony formation (Supplemental Figure 2). Rapamycin caused a modest but significant decrease in HCT116 colony formation compared to the control group. Surprisingly, sorafenib completely abolished formation of colonies in soft agar, either alone or in combination with rapamycin. Taken together, our findings suggest that combination with sorafenib enhances the therapeutic efficacy of rapamycin on the induction of apoptosis and the inhibition of cell-cycle progression, migration and invasion, but not soft agar colony formation, in CRC cells harboring coexistent mutations in KRAS and PIK3CA.
Combined treatment with rapamycin and sorafenib suppresses subcutaneous growth of xenografts derived from CRCs with coexistent PIK3CA and KRAS mutational activation in vivo. We next investigated the in vivo efficacy and safety of the combination of sorafenib and rapamycin in athymic nude mice bearing HCT116 CRC subcutaneous xenografts. After 10 days, when established tumors of approximately 100mm3 volume were detectable, groups of five mice were treated with vehicle, rapamycin (5mg/kg), sorafenib (30mg/kg) or combination of rapamycin and sorafenib (same doses as monotherapy treatment groups). Mice were sacrificed after 23 days of treatment since tumor burden in mice treated with vehicle (control) was at the maximal limit as per institutional guidelines. Rapamycin or sorafenib alone demonstrated approximately 40–50% reduction in tumor weight at the end of the treatment period (Figure 6A). Furthermore, the combination of rapamycin and sorafenib was more effective than monotherapy at inhibiting tumor growth and was actually able to cause tumor regression (Figure 6A–D). Notably, combined treatment with sorafenib and rapamycin at the dose and schedule tested in this study was well tolerated by all mice, with no weight loss or other signs of acute or delayed toxicity. Immunohistochemical analysis of tumors was used to confirm the efficacy of rapamycin and sorafenib treatment by determining expression levels of pS6Ser235/236 and pERKThr202/Tyr204, respectively (Supplemental Figure 3). Similar to the in vitro findings, rapamycin treatment resulted in feedback activation of pAktSer473 and pERKThr202/Tyr204 expression, while its combination with sorafenib blocked feedback activation of PI3K/Akt and Ras/MAPK signaling pathways. There were no significant differences in angiogenesis noted between the various treatment groups as determined by quantification of immunohistochemical CD31 staining (data not shown). Collectively, the results presented in this study highlight the efficacy and safety of concomitant treatment with rapamycin and sorafenib to inhibit tumorigenesis and progression of CRCs.
Discussion
In this study, we determined the therapeutic efficacy and safety of combining sorafenib with rapamycin for CRC treatment. First, we noted positive correlation in expression of pAktSer473 and pERKThr202/Tyr204 in advanced CRC specimens. Second, we show that inhibition of mTORC1 by rapamycin leads to feedback activation of PI3K/Akt and Ras/MAPK signaling. Combination with sorafenib abrogates rapamycin-induced activation of PI3K/Akt and Ras/MAPK signaling pathways. Moreover, combination of rapamycin with sorafenib is synergistic and more effective than treatment with either agent alone at inhibiting proliferation of CRCs. Third, CRCs harboring coexistent KRAS and PIK3CA mutations are only partially sensitive to either rapamycin or sorafenib monotherapy, but are highly sensitive to combination treatment with rapamycin and sorafenib. Fourth, combination with sorafenib enhances the therapeutic efficacy of rapamycin on induction of apoptosis and inhibition of cell-cycle progression, migration and invasion. Finally, we demonstrate the efficacy and safety of concomitant treatment with rapamycin and sorafenib to inhibit tumorigenesis of human xenografts derived from CRCs harboring coexistent mutations in KRAS and PIK3CA. These findings may have relevant therapeutic implications for treatment of CRC patients, especially those with tumors harboring co-existent KRAS and PIK3CA mutations.
Addiction to aberrant signaling caused by mutant oncogenes, such as KRAS or PIK3CA, not only provides cancer cells with a survival advantage over their normal counterparts, but is also required to evade cell death. PI3K/Akt and Ras/MAPK signaling pathways are two of the most frequently dysregulated cascades in human cancer, which cooperate to promote survival and tumorigenesis. Consistent with this notion, we found significant correlation in expression of pAktSer473 and pERKThr202/Tyr204 in tissues from metastatic CRC patients. Integrated signaling between the PI3K/Akt and Ras/MAPK pathways may explain why monotherapy with single-pathway inhibitors, such as rapamycin, may be insufficient to completely inhibit proliferation and induce apoptosis in CRCs with coexistent mutational activation of these pathways. We propose that the synergism noted between rapamycin and sorafenib may be because of the ability of sorafenib to attenuate feedback induction of PI3K/Akt and Ras/MAPK signaling, which occurs with rapamycin treatment alone. Furthermore, sorafenib may be of greater benefit than PI3K/Akt or MEK inhibitors as a part of combination therapy because of its apparent ability to block feedback induction of both pathways.
Another important implication of our findings is that stratification of patients based on oncogenic mutations driving tumor growth is necessary for effective use of targeted therapies, such as rapamycin and sorafenib. CRCs harboring coexistent activation of PI3K/Akt and Ras/MAPK signaling, due to oncogenic mutations in PIK3CA and KRAS respectively, are only partially sensitive to either rapamycin or sorafenib monotherapy, but are highly sensitive to combination treatment with rapamycin and sorafenib. Deletion of the oncogenes responsible for activation of either pathway, as demonstrated in the isogenic cell lines, was sufficient to confer dependence on the other pathway. Furthermore, treatment of CRCs with both rapamycin- and sorafenib-induced apoptosis, while treatment with either agent alone had a predominantly cytostatic effect in vitro. Moreover, only combination treatment with rapamycin and sorafenib was able to induce tumor regression of CRC xenografts in vivo. This is important from a clinical standpoint as optimal therapeutic regimens are able to induce both antigrowth and cytotoxic effects on cancer cells, thus resulting in tumor regression.
Although sorafenib was originally described as a RAF kinase inhibitor, later studies demonstrate that it can inhibit other biologically relevant targets, particularly receptor tyrosine kinases (RTKs) involved in angiogenesis such as vascular endothelial growth factor receptor (VEGFR 1, 2 and 3) and platelet-derived growth factor receptor (PDGFR) [23]. Therefore, one possibility for the in vivo inhibitory effect of sorafenib in our current study could be inhibition of angiogenesis; however, we assessed expression of CD31 as an indication for change in tumor vasculature [13] and did not see differences in expression between the treatment and control groups. While these findings suggest that inhibition of angiogenesis may not be the mechanism for the effects noted in the sorafenib-treated, xenografted tumors, it does not entirely exclude the possibility of the inhibition of other RTKs known to be affected by sorafenib (e.g. c-Kit, Flt-3 or RET). Finally, several reports have shown that certain BRAF inhibitors can activate CRAF and ERK by inducing dimerization of BRAF-CRAF in cancer cells with KRAS mutations [24,25]. Although sorafenib is capable of inducing BRAF-CRAF dimerization, the downstream ERK phosphorylation is still inhibited likely because of its ability to inhibit other upstream RTKs [24]. In our study, we did not observe any ERK transactivation. In fact, we found that sorafenib actually blocked rapamycin-mediated Akt and ERK induction.
In conclusion, our data suggest that the combination of rapamycin with sorafenib is safe and highly effective at inhibiting the tumorigenesis and progression of CRCs harboring KRAS and PIK3CA mutations. The safety and efficacy of this combination treatment has been demonstrated in other cancers, including melanoma, hepatocellular carcinoma and renal cell carcinoma [26–30]. Furthermore, rapamycin analogues, such as everolimus and temserolimus, as well as sorafenib, are already FDA approved for treatment of certain solid tumors, such as hepatocellular carcinoma and renal cell carcinoma, which facilitates rapid incorporation into clinical trials. Our findings provide the rationale for including rapamycin and sorafenib as part of the therapeutic regimen for treating CRC patients, particularly those with tumors harboring coexistent KRAS and PIK3CA mutations.
Supplementary material
Supplementary figures can be found online at http://carcin.oxfordjournals.org/
Funding
Gastrointestinal Specialized Program of Research Excellence (GI SPORE); B. Mark Evers (BME) (P20CA1530343). National Institutes of Health (R01CA133429 T.G.).
Conflict of Interest Statement: None declared.
Acknowledgements
We thank Drs B. Vogelstein and V.E. Velculescu (Johns Hopkins University) for providing HCT116 PIK3CA isogenic cells, Jennifer Rogers and Nathan Vanderford for manuscript preparation and Cynthia Long and Sarah Kennedy for assistance with IHC.
References
- 1. Philp A.J., et al. (2001). The phosphatidylinositol 3ʹ-kinase p85alpha gene is an oncogene in human ovarian and colon tumors. Cancer Res. 61 7426–7429 [PubMed] [Google Scholar]
- 2. Roy H.K., et al. (2002). AKT proto-oncogene overexpression is an early event during sporadic colon carcinogenesis. Carcinogenesis 23 201–205 [DOI] [PubMed] [Google Scholar]
- 3. Guertin D.A., et al. (2007). Defining the role of mTOR in cancer. Cancer Cell 12 9–22 [DOI] [PubMed] [Google Scholar]
- 4. Simi L., et al. (2008). High-resolution melting analysis for rapid detection of KRAS, BRAF, and PIK3CA gene mutations in colorectal cancer. Am. J. Clin. Pathol. 130 247–253 [DOI] [PubMed] [Google Scholar]
- 5. Liu Z., et al. (2008). Highly prevalent genetic alterations in receptor tyrosine kinases and phosphatidylinositol 3-kinase/akt and mitogen-activated protein kinase pathways in anaplastic and follicular thyroid cancers. J. Clin. Endocrinol. Metab. 93 3106–3116 [DOI] [PubMed] [Google Scholar]
- 6. Tsao H., et al. (2004). Genetic interaction between NRAS and BRAF mutations and PTEN/MMAC1 inactivation in melanoma. J. Invest. Dermatol. 122 337–341 [DOI] [PMC free article] [PubMed] [Google Scholar]
- 7. Gingras A.C., et al. (1999). eIF4 initiation factors: effectors of mRNA recruitment to ribosomes and regulators of translation. Annu. Rev. Biochem. 68 913–963 [DOI] [PubMed] [Google Scholar]
- 8. Sarbassov D.D., et al. (2005). Phosphorylation and regulation of Akt/PKB by the rictor-mTOR complex. Science 307 1098–1101 [DOI] [PubMed] [Google Scholar]
- 9. Gulhati P., et al. (2009). Targeted inhibition of mammalian target of rapamycin signaling inhibits tumorigenesis of colorectal cancer. Clin. Cancer Res. 15 7207–7216 [DOI] [PMC free article] [PubMed] [Google Scholar]
- 10.Guertin D.A., et al. The pharmacology of mTOR inhibition. Sci. Signal. (2009);2:pe24. doi: 10.1126/scisignal.267pe24. [DOI] [PubMed] [Google Scholar]
- 11. O’Reilly K.E., et al. (2006). mTOR inhibition induces upstream receptor tyrosine kinase signaling and activates Akt. Cancer Res. 66 1500–1508 [DOI] [PMC free article] [PubMed] [Google Scholar]
- 12. Carracedo A., et al. (2008). Inhibition of mTORC1 leads to MAPK pathway activation through a PI3K-dependent feedback loop in human cancer. J. Clin. Invest. 118 3065–3074 [DOI] [PMC free article] [PubMed] [Google Scholar]
- 13. Wilhelm S.M., et al. (2004). BAY 43-9006 exhibits broad spectrum oral antitumor activity and targets the RAF/MEK/ERK pathway and receptor tyrosine kinases involved in tumor progression and angiogenesis. Cancer Res. 64 7099–7109 [DOI] [PubMed] [Google Scholar]
- 14. Wilhelm S.M., et al. (2008). Preclinical overview of sorafenib, a multikinase inhibitor that targets both Raf and VEGF and PDGF receptor tyrosine kinase signaling. Mol. Cancer Ther. 7 3129–3140 [DOI] [PMC free article] [PubMed] [Google Scholar]
- 15. Dal Lago L., et al. (2008). Selected combination therapy with sorafenib: a review of clinical data and perspectives in advanced solid tumors. Oncologist 13 845–858 [DOI] [PubMed] [Google Scholar]
- 16. Takimoto C.H., et al. (2008). Safety and anti-tumor activity of sorafenib (Nexavar) in combination with other anti-cancer agents: a review of clinical trials. Cancer Chemother. Pharmacol. 61 535–548 [DOI] [PubMed] [Google Scholar]
- 17. Rychahou P.G., et al. (2008). Akt2 overexpression plays a critical role in the establishment of colorectal cancer metastasis. Proc. Natl. Acad. Sci. U.S.A. 105 20315–20320 [DOI] [PMC free article] [PubMed] [Google Scholar]
- 18. Allred D.C., et al. (1993). Association of p53 protein expression with tumor cell proliferation rate and clinical outcome in node-negative breast cancer. J. Natl. Cancer Inst. 85 200–206 [DOI] [PubMed] [Google Scholar]
- 19. Gulhati P., et al. (2011). mTORC1 and mTORC2 regulate EMT, motility, and metastasis of colorectal cancer via RhoA and Rac1 signaling pathways. Cancer Res. 71 3246–3256 [DOI] [PMC free article] [PubMed] [Google Scholar]
- 20. Chou T.C. (2010). Drug combination studies and their synergy quantification using the Chou-Talalay method. Cancer Res. 70 440–446 [DOI] [PubMed] [Google Scholar]
- 21. Samuels Y., et al. (2004). Oncogenic mutations of PIK3CA in human cancers. Cell Cycle 3 1221–1224 [DOI] [PubMed] [Google Scholar]
- 22. Shirasawa S., et al. (1993). Altered growth of human colon cancer cell lines disrupted at activated Ki-ras. Science 260 85–88 [DOI] [PubMed] [Google Scholar]
- 23. Wilhelm S., et al. (2006). Discovery and development of sorafenib: a multikinase inhibitor for treating cancer. Nat. Rev. Drug Discov. 5 835–844 [DOI] [PubMed] [Google Scholar]
- 24. Heidorn S.J., et al. (2010). Kinase-dead BRAF and oncogenic RAS cooperate to drive tumor progression through CRAF. Cell 140 209–221 [DOI] [PMC free article] [PubMed] [Google Scholar]
- 25. Hatzivassiliou G., et al. (2010). RAF inhibitors prime wild-type RAF to activate the MAPK pathway and enhance growth. Nature 464 431–435 [DOI] [PubMed] [Google Scholar]
- 26. Gangadhar T.C., et al. (2011). Two drug interaction studies of sirolimus in combination with sorafenib or sunitinib in patients with advanced malignancies. Clin. Cancer Res. 17 1956–1963 [DOI] [PMC free article] [PubMed] [Google Scholar]
- 27. Harzstark A.L., et al. (2011). A phase 1 study of everolimus and sorafenib for metastatic clear cell renal cell carcinoma. Cancer 117 4194–4200 [DOI] [PubMed] [Google Scholar]
- 28. Lasithiotakis K.G., et al. (2008). Combined inhibition of MAPK and mTOR signaling inhibits growth, induces cell death, and abrogates invasive growth of melanoma cells. J. Invest. Dermatol. 128 2013–2023 [DOI] [PubMed] [Google Scholar]
- 29. Newell P., et al. (2009). Ras pathway activation in hepatocellular carcinoma and anti-tumoral effect of combined sorafenib and rapamycin in vivo. J. Hepatol. 51 725–733 [DOI] [PMC free article] [PubMed] [Google Scholar]
- 30. Wang Z., et al. (2008). Effect of rapamycin alone and in combination with sorafenib in an orthotopic model of human hepatocellular carcinoma. Clin. Cancer Res. 14 5124–5130 [DOI] [PubMed] [Google Scholar]