

Abstract
Gastrointestinal stromal tumors (GISTs) are driven by gain-of-function mutations of KIT or PDGFRa. The introduction of imatinib has significantly extended survival for patients. However, most patients develop resistances. Notch signaling is a conserved developmental pathway known to play a critical role in the development of several cancers, functioning as a tumor promoter or a tumor suppressor. Given that the normal progenitor cell for GIST, the interstitial cell of Cajal, has characteristics similar to those of cells of neuroendocrine origin, we hypothesized that Notch pathway impacts the biology of GIST cells. In this study, we retrovirally and pharmacologically manipulated the Notch pathway in human GIST cells. We also performed a retrospective analysis of a cohort on 15 primary tumors to determine the role of Hes1, a major target gene of Notch, as a prognostic marker for GIST. Constitutively, active intracellular domain of Notch1 (ICN1) expression potently induced growth arrest and downregulated KIT expression in vitro. Additionally, treatment with the histone deacetylase inhibitor suberoylanilide hydroxamic acid caused dose-dependent upregulation of Notch1 expression and a parallel decrease in viability in these cells. Retroviral silencing of downstream targets of Notch (dominant-negative Hes1) and pharmacological inhibition of Notch activation (γ-secretase inhibition) partially rescued GIST cells from suberoylanilide hydroxamic acid treatment. GIST patients with high Hes1 mRNA levels have a significantly longer relapse-free survival. These results identify a novel anti-tumor effect of Notch1 and cross talk between the Notch and KIT pathways. Thus, activation of this pathway by treatment with histone deacetylase inhibitors is an appealing potential therapeutic strategy for GISTs.
Abbreviations:
- DMSO
dimethyl sulfoxide
- GFP
green fluorescent protein
- GIST
Gastrointestinal stromal tumors
- HDAC
histone deacetylase
- Hsp90, heat shock protein 90 ICC
interstitial cells of Cajal
- ICN
intracellular domain of Notch
- MAM
Mastermind like
- OS
overall survival
- PE
phycoerythrin
- RFS
relapse-free survival
- SAHA
suberoylanilide hydroxamic acid
Précis: This study is the first report of the tumor suppressor effects of Notch pathway in gastrointestinal stromal tumors via a negative feedback with the oncogene KIT and may lead the development of new therapeutic strategies for GISTs patients.
Introduction
Gastrointestinal stromal tumors (GISTs) are the most common mesenchymal tumors of the gastrointestinal tract, but are rare in comparison with gastrointestinal carcinomas. The cell of origin of GISTs is believed to be the interstitial cells of Cajal (ICC), which serve as the pacemaker cell of the gastrointestinal tract, controlling peristalsis (1). Gain-of-function mutations of the stem cell growth factor receptor, KIT, play key roles in the oncogenesis of GIST (2,3). Indeed, 65–80% of GISTs have activating mutations of KIT. Of the GISTs not harboring KIT mutations, ~30% have mutations of PDGFRa (4). In GISTs lacking KIT or PDGFRa mutations, a small subset of GIST have been found to carry mutations of BRAF (5). In tumors lacking these mutations, defects in succinate dehydrogenase via germline-inactivating mutations have been reported (6). The introduction of molecularly targeted kinase inhibitors (e.g. imatinib and sunitinib) has dramatically extended the lifespan of patients with metastatic or unresectable GIST (7). However, the majority of the GIST patients will eventually have relapses, prompting interest in gaining a better understanding of GIST biology and developing new therapeutic options for this tumor (8–11).
Developmental pathways such as the Notch, Sonic Hedgehog and WNT signaling play fundamental roles in the normal growth of many tissues by maintaining the balance between cell proliferation and differentiation. These embryonic pathways are aberrantly activated in a wide variety of cancers, suggesting a critical role for the evolution and maintenance of malignant cells. Interestingly, the function of the Notch signaling pathway in tumorigenesis is described as either oncogenic or antiproliferative depending on the context (12,13). Researchers established the oncogenic potential of the Notch pathway in patients with acute T-cell lymphoblastic leukemia, which was followed by reports in several solid tumors including ovarian, colorectal, breast, and non-small cell lung cancer. This led to the development of pharmacological inhibitors of the Notch pathway (14,15). In contrast, the tumor suppressor function of Notch pathway has been established in solid tumors, including prostate, skin, small cell lung cancer, and neuroendocrine tumors as well as B-cell malignancies and chronic myelomonocytic leukemia (16–19). Furthermore, two recent studies using massively parallel sequencing revealed that Notch1 is frequently mutated in head and neck squamous cell carcinoma suggesting a major tumor suppressor role in this tumor (20,21). This dual role of Notch in cancer is generally explained by the biology characteristics of this pathway in physiological conditions, leading the stem cell phenotype maintenance in some tissues and differentiation in others. Additionally, in cancer cells, interactions with the microenvironment or other oncogenic pathways are key events (22). Indeed, Notch signaling has exhibited cross talk with AKT, mTOR, RAS, nuclear factor-κB, Sonic Hedgehog, WNT and EGFR pathways (14).
The activation of Notch pathway starts by the binding of specific ligands to Notch receptors (Notch1, Notch2, Notch3 and Notch4), followed by two sequential cleavages that cause the release of the intracellular domain of Notch (ICN) into the cytoplasm and subsequent translocation into the nucleus. ICN binds to the CBF1, Su(H) and Lag-1 (CSL) complex and transforms it into a potent transcriptional activator with additional recruitment of coactivator complexes, including Mastermind like (MAM) proteins and histone acetyltransferases (23,24). This transcriptional cascade has multiple effects and several target genes have been described (25). In particular, the basic helix-loop helix transcriptional repressor hairy/enhancer-of-split (Hes) family are well-characterized target genes of Notch pathway (26).
The cell of origin of GIST, the ICC represents the interface between the neural system of the gut and the endocrine system and has characteristics similar to neuroendocrine cells (27,28). We reasoned that Notch signaling may function as a tumor suppressor for GISTs, as it does for neuroendocrine tumors (16). We therefore examined the impact of Notch signaling in GIST cells since any tumor suppressor function might have potential benefit for patients. Additionally, several in vitro studies have shown that histone deacetylase (HDAC) inhibitors upregulate Notch1 in neuroendocrine tumors (carcinoid tumors, pheochromocytomas and medullary thyroid cancers) and decrease tumor cell growth (29–32). Furthermore, a recent study provided evidences that HDAC inhibitors, including suberoylanilide hydroxamic acid (SAHA), exhibit antiproliferative effects in GIST cells (33). Our aim in this study was to determine the effect of Notch signaling in established human GIST cell lines and patient samples to develop novel approaches to controlling GIST growth, particularly after failure of treatment with tyrosine kinase inhibitors.
Materials and methods
Cell culture and drug treatment
The human cell line GIST-T1, which has an imatinib-sensitive KIT mutation in exon 11 (V560-Y579del), was established from a patient with metastatic imatinib-naive GIST (34). The imatinib-sensitive cell line GIST882, which has homozygous missense mutations in KIT exon 13 (K642E), was established from a patient with primary, imatinib-naive GIST (35). Imatinib-resistant cell line GIST48IM, which harbors homozygous KIT exon 11 mutations (V560D) and a heterozygous secondary exon 17 mutation (D820A), was established from a GIST that has progressed on imatinib, after initial clinical response (36). GIST-T1, GIST882 and GIST48IM cells were kindly provided by Dr Andrew Godwin (Fox Chase Cancer Center), Dr Jonathan Fletcher (Dana-Farber Cancer Institute) and Dr Anette Duensing (University of Pittsburgh Cancer Institute), respectively. KIT mutations were confirmed by direct sequencing. Potential contaminations by other cell lines were verified using short tandem repeated DNA fingerprinting with an AmpFℓSTR Identifiler kit according to the manufacturer’s instructions (Applied Biosystems). Cells were maintained as described previously (37).
SAHA and imatinib were purchased from the University of Texas—MD Anderson Cancer Center Pharmacy. γ-Secretase inhibitor, GSI XXI, was purchased from Calbiochem. The drugs were dissolved in dimethyl sulfoxide (DMSO) (Fisher Bioreagents) at 10 mmol/l and filtered through 0.22 micron filters, and aliquots were stored in –20°C, protected from light.
RNA purification, cDNA synthesis and real-time reverse transcription–PCR
Total RNA was purified with RNeasy minikit (QIAgen) as described by the manufacturer. Samples were desalted and concentrated by centrifugation columns. Omniscript Reverse Transcription kit (QIAgen) was used to synthesize cDNA, using 2 μl RT buffer, 2 μl dNTP mix, 1 μl oligo-dT primer, 1 μl Rnas inhibitor, 1 μl Omniscript Reverse Transcriptase, incubated for 60min at 40°C. The newly synthesized cDNA was diluted in a final volume of 200 μl.
Real-time quantitative RT–polymerase chain reaction (RT–PCR) was performed by mixing 13 μl SYBR Green (Bio-Rad), 1 μl of forward and reverse primers (Invitrogen) and RNase-free water to a total volume of 23 μl. In total, 2 μl of the cDNA template was added and the reaction mix heated to 95°C for 10min. Amplification was carried out on an ABI5700 (Applied Biosystems) for 40 cycles with a denaturation temperature of 95°C for 15 s and an annealing and extension temperature of 60°C for 1min. The genes analyzed were Notch1, Hes1 and KIT. The designed primer sequences are listed in Supplementary Table S1, available at Carcinogenesis Online. The reference gene GAPDH was used for normalization. All experiments were performed in triplicates at least three times and the results were analyzed using the Ct method and recorded as relative expression level (38).
Plasmids and retroviral constructs
A murine stem cell virus-based retroviral vector MigR1 coexpressing green fluorescent protein (GFP) as an expression marker was used to modulate Notch signaling in GIST cells (39). The intracellular domain of human Notch1 (ICN1) or full-length human Hes1 or Hes5 was inserted into the MigR1 vector. The dominant-negative Hes1 (dnHes1) and mastermind (dnMAM) were similarly generated and described previously (17,40).
Flow cytometric analysis
For GFP analysis, adherent GIST cells alone were trypsinized and resuspended in media. Transduced cells were identified as GFP+. For cell cycle analysis, ~3×10⁵ cells were cultured with SAHA for 72h, and floating and adherent cells were collected and incubated overnight at 4°C with 0.005% propidium iodide and 0.1% Triton X-100 diluted in phosphate-buffered saline. For measurement of KIT and Notch1 surface expression, adherent cells were stained with phycoerythrin-conjugated (PE) KIT or an anti-Notch1 monoclonal antibody (eBioscience). To control for non-specificity, GIST cells were similarly stained with a PE-conjugated isotype anti-IgG1 monoclonal antibody (FastImmune). Events were recorded on a FACSCalibur flowcytometer (Becton, Dickinson and Co.) and analyzed with FlowJo software program (Tree Star).
Analysis of cell proliferation
Cell proliferation assays were performed using a Promega CellTiter 96 Aqueous Non-radioactive Cell Proliferation Assay kit (Promega) according to the manufacturer’s instructions. Direct cell counting were done by counting nuclei (5–25 μm) using an automated Vi-Cell Analyzer (Beckman Coulter) as described previously or Mozi Z cell counter (Orflo) (41).
Western blotting analysis
GIST cells were harvested and washed with phosphate-buffered saline, pellets were lysed on ice for 5min in a lysis buffer with complete Protease Inhibitor Cocktail (Roche Diagnostic). The protein concentration was measured using a Bio-Rad Protein Assay (Bio-Rad). Cell lysates were diluted 1:2 with 10mM dithiothreitol sodium dodecyl sulfate–polyacrylamide gel electrophoresis (SDS-PAGE) loading buffer. Forty micrograms of protein was resolved using SDS-PAGE gels and transferred onto polyvinylidene difluoride membranes. Western blotting was performed as described previously (37,42). The primary antibodies used were as follows: rabbit anti-pKIT (Tyr719) (1:1000, cell signaling), rabbit anti-AcH3K9 (1:1000, cell signaling) and rabbit anti-AcH3 (1:1000, cell signaling). Actin served as control for equal protein loading. Anti-rabbit IgG ECL antidody (1:2000, GE healthcare) was used as a secondary antibody.
Patients and tumor specimens
All GIST specimens were obtained from patients with pre-treated GIST enrolled in a previously described IRB approved prospective phase II study of neoadjuvant and adjuvant imatinib at MD Anderson Cancer Center (43).
Statistical analysis
For in vitro analysis, the significance of the results was assessed using the Student’s t-test. All experiments were conducted at least three times. Statistical analyses were performed using the Prism 5 software program (GraphPad). For patient sample analysis, the relapse-free survival (RFS) was defined as the time from surgical resection to disease recurrence; and the overall survival (OS) as the time from surgical resection to death. To control for the known prognostic factors, the chi-square test was used for categorical variables and the Student’s t-test for continuous variables. To evaluate the association between Hes1 mRNA expression and patient outcome, Kaplan–Meier curves were created, and log-rank tests were used to compare RFS and OS curves among patients. A value of P < 0.05 was considered significant.
Results
The active form of Notch1 transduction decreases GIST cell growth
To determine the effect of Notch signaling on GIST cells, we transduced imatinib-sensitive GIST-T1 and GIST882 cells, and imatinib-resistant GIST48IM cells with either an empty vector expressing GFP alone (MigR1), or coexpressing a constitutively active truncated intracellular portion of Notch receptor 1 (ICN1). We used the percentage of GFP+ cells at different times after transduction as an indirect measure of cell growth (Supplementary Figure S1, available at Carcinogenesis Online). ICN1 expression potently induced growth arrest in the three GIST cell lines irrespective of their sensitivity or resistance to imatinib (Figure 1A). The proportion of GFP+ ICN-expressing cells decreased compared with GFP– cells, relative decrease of 93, 84 and 95% in GIST-T1, GIST882 and GIST48IM, respectively, 16 days after transduction (P < 0.01). In contrast, proliferation of cells transduced with control empty vector was not affected.
Fig. 1.

ICN1 inhibits GIST cells proliferation. (A) Graph of the percentage of GFP+ GIST cells over time after stable retroviral transduction of vector alone (MigR1) or containing ICN1 (normalized to day 2 after transduction). GIST-T1, GIST882 and GIST48IM cells were transduced with the control vector or ICN1, statistical differences: **P < 0.01. (B) Graphs of the percentage of GFP+ GIST-T1 cells over time (normalized to day 2) after retroviral transduction with MigR1 alone, Hes1 or Hes5, statistical differences: *P < 0.05.
Because Hes1 and Hes5 are essential Notch effectors in regulation of mammalian neuronal differentiation, we asked whether expression of them is sufficient to recapitulate the inhibitory effect of ICN1 in GIST-T1 cells. To answer this question, we cloned Hes1 or Hes5 into MigR1 and retrovirally expressed in GIST-T1 cells. Although the transduction of Hes1 and Hes5 into GIST-T1 cells had a limited growth-inhibitory effect, this effect did not fully recapitulate the growth inhibition observed with transduction of ICN1 (Figure 1B).
ICN1 transduction decreases KIT protein expression in GIST cells
To elucidate the mechanism of growth arrest in GIST cells, we investigated the effects of ICN1 on KIT expression. We transduced the three GIST cell lines with either empty MigR1 or MigR1-containing ICN1. Six days after transduction, we analyzed the cell surface KIT expression by flow cytometry using a monoclonal antibody against KIT conjugated with PE. We observed that ICN1 forced expression resulted in a decrease of the KIT protein expression in the three GIST cell lines (Figure 2A and 2B).
Fig. 2.

ICN1 decreases KIT expression. (A) The GIST cell lines were transduced with MigR1 or ICN1 as described above. After transduction, KIT expression on the surface of the cells was evaluated using flow cytometry. The KIT expression in the GFP+ (transduced cells) cells is indicated in each cell-specific gate. KIT expression was lower in GFP+ cells (transduced cells) than GFP– cells (parental cell lines) for the constructs containing ICN1 but not for the empty vector. Three independent experiments were performed, with similar results: one representative result is shown. (B) Comparison of the KIT expression in the GFP+ cells transduced with MigR1 alone and ICN1. A PE-conjugated IgG antibody was used as an isotype control (ISO). KIT expression was lower in the ICN1-transduced cells than in the vector control cells.
SAHA upregulates Notch1 mRNA level and protein expression
Treatment with several drugs, particularly HDAC inhibitors, can upregulate Notch genes pathway in different models (29–32). To test our hypothesis that treatment with SAHA could upregulate Notch genes in GIST cells, we treated these cells with SAHA by increasing concentrations for 72h. We found that Notch1 mRNA expression was significantly upregulated in all three cell (Figure 3A). Notch1 mRNA level increase with treatment with 2 μmol/l SAHA (6- and 1.5-fold increase in GIST-T1 and GIST882 cells, respectively, P < 0.05 in both cases). In GIST48IM, treatment with 5 μmol/l SAHA was required to upregulate Notch1 mRNA expression by a 2-fold (P < 0.05). To determine whether this increased of the Notch1 transcript level translated to Notch1 protein expression on the surface of these cells, we performed flow cytometry analysis using a monoclonal antibody specific for Notch1 protein. The flow cytometry analysis indicated that, at the basal level, Notch1 receptor is absent from the surface of the GIST cells, and upregulated after treatment with SAHA (Figure 3B). A significant upregulation of Hes1 mRNA expression is also observed after SAHA treatment in GIST-T1 and GIST882 (P < 0.05) although this upregulation remains small (Supplementary Figure S2, available at Carcinogenesis Online).
Fig. 3.

SAHA upregulates Notch1 mRNA and protein expression. (A) Quantitative RT–PCR analysis of GIST cells treated with increasing doses of SAHA for 24h showing Notch1 mRNA expression. The data are presented as the relative expression levels using GAPDH as reference gene and normalized with untreated cells. Notch1 mRNA increases after SAHA treatment. Experiments were performed in triplicate, and repeated three times, the error bars represent standard deviation, statistical differences: *P < 0.05, **P < 0.01. (B) GIST-T1 and GIST882 cells were treated with 2 μmol/l SAHA, and GIST48IM cells were treated with 5 μmol/l SAHA. Cells were collected 48h after drug treatment and evaluated for cell surface Notch1 expression using flow cytometry. Notch1 expression increases after SAHA treatment. Three independent experiments were performed with similar results, one representative result is shown.
SAHA decreases cell growth, increases apoptosis and suppresses KIT expression in GIST cells
To determine the antiproliferative effects of SAHA, we performed colorimetric MTS assays to evaluate the GIST cell proliferation after treatment with this HDAC inhibitor. Specifically, we treated the GIST cell lines with SAHA at clinically relevant concentrations for 72h (100 nmol/l to 5 μmol/l). As observed previously, we found a dose-dependent growth inhibition in imatinib-sensitive GIST-T1 and GIST882 cells and in imatinib-resistant GIST48IM cells (Figure 4A) (33).
Fig. 4.
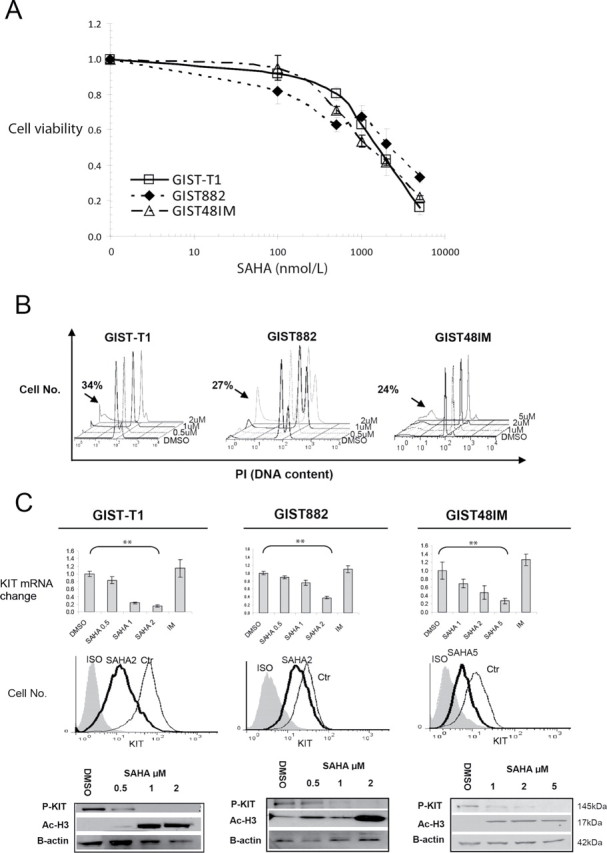
Dose-dependent decrease in cell viability, increase in apoptosis and downregulation of KIT expression in GIST cell lines following exposure to SAHA. (A) Exponentially growing GIST cells were exposed to varying concentrations of SAHA. Cell proliferation was assessed using an MTS assay 3 days after drug exposure. Points represent mean absorbance of triplicate wells relative to DMSO vehicle controls; bars, standard deviation. (B) Results of cell cycle analysis using propidium iodide staining and flow cytometry: GIST cells were incubated with SAHA at the indicated concentrations for 72h. Proportion of apoptosis cells estimated by the amount of the hypodiploid DNA peak is (sub-G1 populations) indicated by the arrows. The experiments were repeated on three separate occasions with similar results. (C) Quantitative RT–PCR analysis of KIT mRNA expression in GIST-T1, GIST882 and GIST48IM cells 24h after increasing doses of SAHA. The histograms show the changes in KIT mRNA expression after normalization with GAPDH expression in triplicate wells; Bars, standard deviation, statistically differences: **P < 0.01. GIST cells were treated with SAHA 2 μmol/l for 48h and evaluated for cell surface KIT expression by flow cytometry. The western blots analysis show level of phosphorylated KIT (P-KIT) and acetylated Histone H3 (Ac-H3) in GIST cells after 48h of SAHA treatment. Actin served as control for equal protein loading. Three independent experiments were performed: one representative result is shown. IM, imatinib; ISO, isotype control; Ctr, DMSO control.
To confirm that the antiproliferative effect of SAHA on GIST cells is related to apoptosis, we performed cell cycle analysis of detached and attached cells treated with SAHA. We found a dose-dependent increase in the number of sub-G1 cells for all three cell lines (Figure 4B). Notably, in GIST-T1 cells, treatment with 2 μmol/l SAHA resulted in a 25-fold increase in the sub-G1 population over that in cells treated with control DMSO. In GIST48IM cells, the effect of treatment with 2 μmol/l SAHA was minimal and treatment with 5 μmol/l was required to achieve a 2.5-fold increase of the sub-G1 population compared with control cells.
In addition, to determine whether SAHA affects KIT expression, we first investigated the effects of treatment with SAHA on KIT mRNA level in GIST cells. To prevent the confounding late effects of apoptosis on KIT expression, we performed quantitative RT–PCR analysis to measure the KIT mRNA expression in the three GIST cell line at an early time point (24h). In agreement with published findings, KIT mRNA level decreased in a dose-dependent manner with treatment with 2 μmol/l SAHA (85 and 62% in GIST-T1 and GIST882 cells, respectively). In the imatinib-resistant GIST48IM, treatment with 5 μmol/l SAHA downregulated KIT mRNA expression by 73% (Figure 4C). In contrast, treatment with imatinib did not decrease KIT mRNA level compared with DMSO control.
Furthermore, to determine whether the loss of KIT mRNA expression affected KIT protein expression and activation, we performed western blot and flow cytometric analysis of the three GIST cell lines after 48h of treatment with SAHA. The treatment resulted in a decrease of total KIT expression and a complete inhibition of phosphorylated KIT in the three cell lines (Figure 4C). As expected, we observed parallel dose-dependent hyperacetylation of histone H3 at lys9 in the three cell lines after HDAC inhibitor treatment (Figure 4C).
Inhibition of Notch pathway partially rescues GIST cells from the effects of SAHA treatment
Given that the treatment with HDAC inhibitors potentially affects the expression of hundreds of genes, we performed a rescue assay to elucidate the relative contribution of upregulation of Notch1 expression to the mechanism of action of SAHA in GIST cells. We transduced GIST-T1 cells with dominant-negatives dnHes1 and dnMAM and examined cells’ viability and KIT expression. To avoid counting dead or dying cells, we assessed cell growth by counting the nuclei after chemical lysis of the plasma membrane. After 72h of treatment with 1 μmol/l SAHA, we observed significant difference between cells growth in transfected dnHes1 and vector control (P < 0.001) but not with the dnMAM construct (Figure 5A). Pharmacological inhibition of Notch activation by a γ-secretase inhibitor (GSI XXI) showed a partial rescue of the effect of SAHA in GIST-T1 and GIST882 cells (Figure 5B). The addition of GSI XXI decreased the inhibitory effect of SAHA alone (P < 0.05).
Fig. 5.
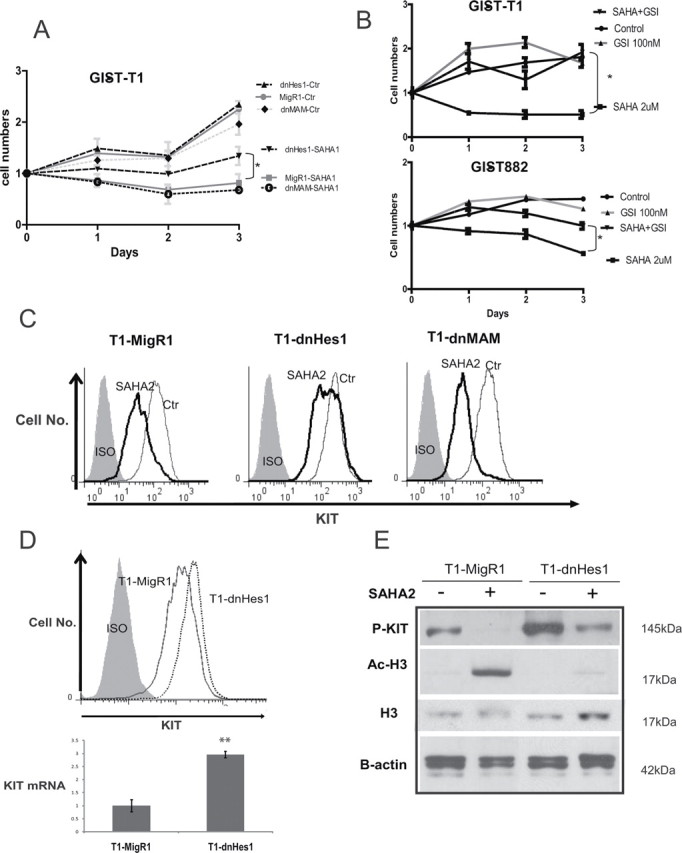
Dominant negative Hes1 and γ-secretase inhibitor treatment partially rescue the cell growth from SAHA treatment. (A) Growth curve of GIST-T1 cells transduced with dnHes1, dnMAM and vector alone after DMSO control and 1 μmol/l SAHA. The numbers of cells were assessed by automated Vi-CELL Analyzer. DnHes1 partially rescues the cell growth, whereas dnMAM does not. Data are presented as the mean of three independent experiments +/– standard deviation, statistical differences: *P < 0.05. (B) Growth curve of GIST-T1 and GIST882 cells after treatment with SAHA 2 μmol/l alone, GSI XXI 100 nmol/l alone or in combination of the two drugs. The numbers of cells were assessed by Moxi Z cell counter. Data are presented as the mean of three independent experiments +/– standard deviation, statistical differences: *P < 0.05. (C) GIST-T1 cells transduced with a MigR1, dnHes1 and dnMAM cells were treated with 2 μmol/l SAHA. Cells were collected 48h after drug treatment and evaluated for cell surface KIT expression using flow cytometry. The KIT expression is rescued by dnHes1 but not dnMAM. Three independent experiments were performed with similar results. (D) Comparison of KIT expression in the vector control (MigR1) versus dnHes1 GIST-T1 cells. KIT expression is higher at the protein and mRNA levels in the dnHes1 transduced cells in comparison with the control. (E) The western blots analysis show level of phosphorylated KIT (P-KIT), total histone H3 (H3) and acetylated histone H3 (Ac-H3) in GIST-T1 cells after 48h of SAHA treatment. Actin served as control for equal protein loading.
We then studied the KIT cell surface expression after SAHA treatment in cells transduced with these constructs. Downregulation of KIT cell surface expression was partially abolished by dnHes1 expression. In contrast, dnMAM did not rescue the KIT protein expression after the treatment (Figure 5C).
The expression of KIT by flow cytometry and the phosphorylated form of KIT by western blotting was found to be higher after transduction of dnHes1 (Figure 5D and 5E). The KIT mRNA level was found to be higher in the dnHes1 cells. After SAHA treatment, the partial rescue of phosho-KIT in the dnHes1 GIST-T1 cells was associated with the abolition of the hyperacetylation of H3K9 (Figure 5E).
GIST patients with high levels of mRNA Hes1 expression have better prognosis than patients with low levels of this expression
The previous finding that Notch signaling has an anti-tumor effect in GIST cells prompted us to determine whether baseline expressions of members from this pathway is related to RFS or OS in GIST patients. In particular, as the previous data showed an inhibitory effect of Notch 1 in GIST cells, we hypothesized that Notch signaling members expression may be associated with improved clinical outcome in patients. We evaluated the clinical predictive value of Notch1 and Hes1 expression in 15 pre-imatinib GIST patients who underwent surgical resection of their tumor followed by adjuvant treatment with imatinib by performing quantitative RT–PCR to analysis mRNA transcript levels. Patient characteristics are listed in Table I. The primary tumor sites were the stomach and small bowel. The Notch1 mRNA transcript levels were almost undetectable in all the 15 samples (Supplementary Figure S3, available at Carcinogenesis Online). In contrast, Hes1 mRNA expression was variable in the cohort. We then performed a Kaplan–Meier analysis in the patient cohort after grouping them into two categories, based on Hes1 expression (Supplementary Figure S3, available at Carcinogenesis Online). Patients with high Hes1 expression had longer RFS than did those with low expression [median of 37 months versus median not reached at >80 months; P = 0.005 (log-rank test)] (Figure 6A). However, because of the small size of the cohort and small number of patient death, the difference in OS between the two groups was not significantly different (median not reached at >80 months in either groups) (Figure 6B).
Fig. 6.
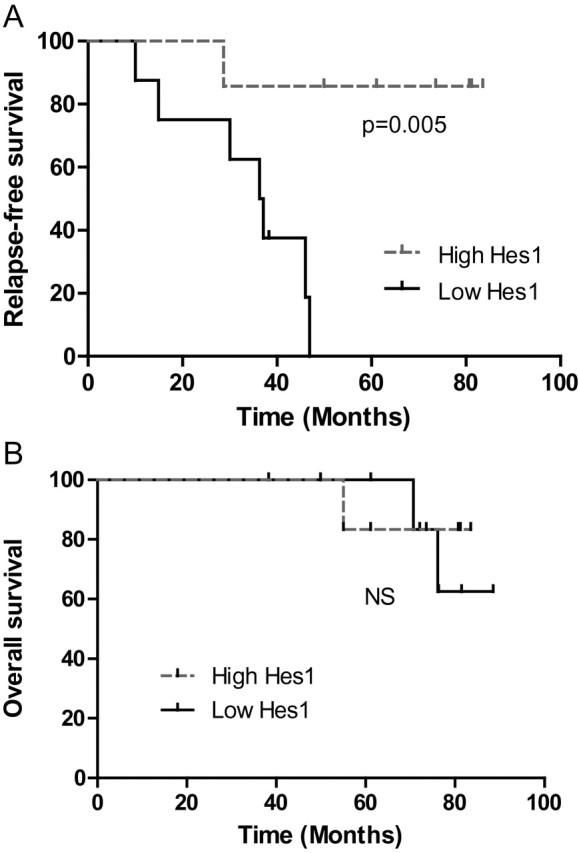
Hes1 mRNA level predicts the relapse of patient with GIST. (A) Kaplan–Meier analysis for RFS in GIST patients with high versus low Hes1 mRNA expression [n = 15; P = 0.005 (log-rank test)]. (B) Kaplan–Meier analysis for OS in GIST patients with high versus low Hes1 mRNA expression [n = 15; P = not significant (log-rank test)].
Discussion
Despite the fact that treatment with imatinib has dramatically changed the history of GIST, acquired resistance mainly caused by secondary mutations of KIT is an important clinical challenge. Currently, second-generation tyrosine kinase inhibitors are administered for patients with imatinib resistance, but these drugs provide little benefit prior to disease progression. For those patients, the need for new approaches to counteracting resistance is urgent.
Notch signaling pathway is a fundamental developmental pathway that regulates several functions, particularly, proliferation and differentiation of the intestinal epithelium and neural crest-derived tissue (44). Studies have implicated the involvement of this pathway in the initiation and progression of many different hematological malignancies and solid tumors. However, the role of Notch in GIST was not known.
In this study, we showed that GIST cell lines and patient samples had very low mRNA Notch1 expression (Supplementary Figure S3, available at Carcinogenesis Online). A constitutively active form of Notch1 led to growth inhibition in the three human GIST cell lines tested, which had diverse KIT mutations and sensitivities to imatinib. In parallel, we demonstrated that KIT expression was downregulated in response to Notch1 activation. Interestingly, we found that transduction with a dominant negative of Hes1 increased the KIT expression in GIST-T1 cells. This is the first report of a negative interaction between the Notch and KIT pathways in GIST. We speculate that the growth inhibition caused by ICN1 in GIST cells resulted from the depletion of KIT. An alternative explanation is that Notch target genes may be only tolerated transiently and induce differentiation or excessive apoptosis in GIST cells. The mechanism by which ICN1 decreases KIT expression remains unclear. Importantly, we found that neither Hes1 nor Hes5 fully recapitulated the effect of ICN1 on growth inhibition in GIST-T1 cells. This finding indicates that although Hes1 and Hes5 decrease the cell growth, they may not be the only downstream targets of ICN1 in these cells. Importantly, in silico analysis of the KIT promoter sequence up to 1306bp revealed the presence of two N-box consensus sequences (-738,-733 pb) and (-520,-515 pb) that are binding site for Hes family members (Supplementary Figure S4, available at Carcinogenesis Online). Additionally, epigenetic modifications and microRNA interactions may modulate level and stability of KIT mRNA in a Notch-dependent manner. Further studies are needed to clarify the mechanisms and effectors of Notch-mediated growth inhibition and downregulation of KIT expression in GIST cells. Interestingly, one of the more common cytogenetic aberrations found in GIST is the loss of 1p region (between 1p36 and 1p13) (45–48). This deletion is associated with aggressiveness in GIST and is less frequently found in other sarcomas such as leiomyosarcomas. This region contains the hes2, hes3, hes4 and hes5 genes. It was hypothesized that the deletion of chromosome 1p plays a critical role in GIST development by the loss of tumor suppressor genes. In the light of our results, we hypothesize that these genes may include Hes family members. Additionally, determining whether other tumors have similar negative feedback mechanisms, particularly in tissues where KIT is highly expressed, such as hematopoietic stem cells, mast cells, melanocytes and germ cells, would be important.
Our results show that HDAC inhibitor SAHA can upregulate Notch1 expression as it was described previously in other cancer types. In several cancer models, treatment with HDAC inhibitors induced apoptosis by re-inducing expression of tumor suppressor genes and downregulating expression of oncogenes. In this study, we confirm that treatment with SAHA at clinically relevant concentrations induced apoptosis and reduced KIT expression in vitro. However, the mechanism of action of SAHA in GIST cells remained controversial. A previous study demonstrated an interaction between HDAC inhibitors and heat shock protein 90 (Hsp90), a KIT protein chaperone, and proposed that HDAC inhibitors silence KIT expression via acetylation of Hsp90. Nevertheless, we found that downregulation of KIT protein expression could be explained by the decrease of the KIT mRNA level. Although both events, the decrease of KIT mRNA level and the loss of Hsp90 chaperone activity, may contribute to the effect of SAHA on GIST cells, we did not quantify the respective contributions of these mechanisms. Nevertheless, the profound decrease in KIT mRNA transcript level that we observed seems to indicate a stronger transcriptional effect than a post-translational effect described previously. To confirm that SAHA’s effect is partially due to its upregulation on the Notch1 pathway, we showed a partial rescue of cell growth with dnHes1 and a γ-secretase inhibitor.
Having found that Notch1 activation induces growth arrest and downregulates KIT expression in GIST cells, we next examined whether difference expressions of Notch signaling members were associated with differences in clinical outcome in 15 GIST patients. As shown in Supplementary Figure S3, available at Carcinogenesis Online, the tumors express very low levels of Notch1 whereas elevated Hes1 expression is observed in some patients indicating that Hes1 mRNA expression in GIST tumors may be under the control of other Notch receptors, or alternatively by other signaling pathways. Nevertheless, we found that the level mRNA Hes1 expression was a prognostic factor for relapse in our cohort. Larger studies with proper controls are needed to confirm the prognostic role of Hes1 in GIST.
In conclusion, in this study, we demonstrated that active form of Notch1 has a growth-inhibitory effect on GIST cells. The upregulation of Notch1 may be a therapeutic opportunity for GIST patients as our data suggest that treatment with SAHA could increase the mRNA and protein Notch1 expression. Notch1 pathway activation with HDAC inhibitors may represent a novel strategy for treatment of GIST, in particular, after imatinib failure. Furthermore, in our small cohort, high mRNA Hes1 expression levels are associated with improved RFS in patients with resected GIST and may be an important prognostic markers for GIST. Altogether, our findings support a role for the Notch pathway as a tumor suppressor pathway via a negative feedback with KIT signaling and identify a potential therapeutic target for GIST.
Table I.
GIST patient and tumor characteristics (n = 15)
| Characteristic | Overall cohort (15) | High Hes1 (7) | Low Hes1 (8) | P | |
|---|---|---|---|---|---|
| Age (y) | 54 (29–84) | 53 | 48 | 0.29 | |
| Tumor size (cm) | 8.5 (3.2–18.8) | 6.9 | 12.5 | 0.43 | |
| n (%) | n | n | |||
| Gender | Male | 8 (53) | 4 | 4 | 0.99 |
| Female | 7 (47) | 3 | 4 | ||
| Site of disease | Stomach | 9 (60) | 6 | 3 | 0.30 |
| Small bowel | 6 (40) | 1 | 5 | ||
| Metastatic | 4 (27) | 1 | 3 | 0.38 | |
| GIST genotype | KIT exon 11 | 12 (80) | 5 | 7 | 0.87 |
| KIT exon 9 | 1 (7) | 0 | 1 | ||
| PDGFRA | 1 (7) | 1 | 0 | ||
| Wild-type | 1 (7) | 1 | 0 | ||
Statistical tests are based on P value calculation. Chi-square test was used for binary/categorical variables and t-test was used for continuous variables
Funding
National Institutes of Health through MD Anderson’s Cancer Center Support (CA016672).
Supplementary material
Supplementary Table 1 and Figures 1–4 can be found at http://carcin.oxfordjournals.org/
Acknowledgements
We thank our patients for their courage. We thank the members of Hughes laboratory and Bethany Alicie for technical assistance. We also thank Dr Patrick Zweidler-McKay and Dr Sarah Dumont for helpful discussions.
Conflict of Interest Statement: None declared.
References
- 1. Kindblom L.G., et al. (1998). Gastrointestinal pacemaker cell tumor (GIPACT): gastrointestinal stromal tumors show phenotypic characteristics of the interstitial cells of Cajal. Am. J. Pathol. 152 1259–1269 [PMC free article] [PubMed] [Google Scholar]
- 2. Hirota S., et al. (1998). Gain-of-function mutations of c-kit in human gastrointestinal stromal tumors. Science 279 577–580 [DOI] [PubMed] [Google Scholar]
- 3. Sommer G., et al. (2003). Gastrointestinal stromal tumors in a mouse model by targeted mutation of the Kit receptor tyrosine kinase. Proc. Natl. Acad. Sci. U.S.A. 100 6706–6711 [DOI] [PMC free article] [PubMed] [Google Scholar]
- 4. Heinrich M.C., et al. (2003). PDGFRA activating mutations in gastrointestinal stromal tumors. Science 299 708–710 [DOI] [PubMed] [Google Scholar]
- 5. Agaram N.P., et al. (2008). Novel V600E BRAF mutations in imatinib-naive and imatinib-resistant gastrointestinal stromal tumors. Genes. Chromosomes Cancer 47 853–859 [DOI] [PMC free article] [PubMed] [Google Scholar]
- 6. Janeway K.A., et al. (2011). Defects in succinate dehydrogenase in gastrointestinal stromal tumors lacking KIT and PDGFRA mutations. Proc. Natl. Acad. Sci. U.S.A. 108 314–318 [DOI] [PMC free article] [PubMed] [Google Scholar]
- 7. Dematteo R.P., et al. (2002). Clinical management of gastrointestinal stromal tumors: before and after STI-571. Hum. Pathol. 33 466–477 [DOI] [PubMed] [Google Scholar]
- 8. Demetri G.D., et al. (2002). Efficacy and safety of imatinib mesylate in advanced gastrointestinal stromal tumors. N. Engl. J. Med. 347 472–480 [DOI] [PubMed] [Google Scholar]
- 9. Heinrich M.C., et al. (2003). Kinase mutations and imatinib response in patients with metastatic gastrointestinal stromal tumor. J. Clin. Oncol. 21 4342–4349 [DOI] [PubMed] [Google Scholar]
- 10. Verweij J., et al. (2004). Progression-free survival in gastrointestinal stromal tumours with high-dose imatinib: randomised trial. Lancet 364 1127–1134 [DOI] [PubMed] [Google Scholar]
- 11. Blanke C.D., et al. (2008). Long-term results from a randomized phase II trial of standard- versus higher-dose imatinib mesylate for patients with unresectable or metastatic gastrointestinal stromal tumors expressing KIT. J. Clin. Oncol. 26 620–625 [DOI] [PubMed] [Google Scholar]
- 12. Miele L., et al. (2006). Notch signaling in cancer. Curr. Mol. Med. 6 905–918 [DOI] [PubMed] [Google Scholar]
- 13. Miele L., et al. (2006). NOTCH signaling as a novel cancer therapeutic target. Curr. Cancer Drug Targets 6 313–323 [DOI] [PubMed] [Google Scholar]
- 14. Ranganathan P., et al. (2011). Notch signalling in solid tumours: a little bit of everything but not all the time. Nat. Rev. Cancer 11 338–351 [DOI] [PubMed] [Google Scholar]
- 15. Mizutani T., et al. (2001). Conservation of the biochemical mechanisms of signal transduction among mammalian Notch family members. Proc. Natl. Acad. Sci. U.S.A. 98 9026–9031 [DOI] [PMC free article] [PubMed] [Google Scholar]
- 16. Kunnimalaiyaan M., et al. (2007). Tumor suppressor role of Notch-1 signaling in neuroendocrine tumors. Oncologist 12 535–542 [DOI] [PubMed] [Google Scholar]
- 17. Zweidler-McKay P.A., et al. (2005). Notch signaling is a potent inducer of growth arrest and apoptosis in a wide range of B-cell malignancies. Blood 106 3898–3906 [DOI] [PMC free article] [PubMed] [Google Scholar]
- 18. Dotto G.P. (2008). Notch tumor suppressor function. Oncogene 27 5115–5123 [DOI] [PMC free article] [PubMed] [Google Scholar]
- 19. Klinakis A., et al. (2011). A novel tumour-suppressor function for the Notch pathway in myeloid leukaemia. Nature 473 230–233 [DOI] [PMC free article] [PubMed] [Google Scholar]
- 20. Agrawal N., et al. (2011). Exome sequencing of head and neck squamous cell carcinoma reveals inactivating mutations in NOTCH1. Science 333 1154–1157 [DOI] [PMC free article] [PubMed] [Google Scholar]
- 21. Stransky N., et al. (2011). The mutational landscape of head and neck squamous cell carcinoma. Science 333 1157–1160 [DOI] [PMC free article] [PubMed] [Google Scholar]
- 22. Radtke F., et al. (2003). The role of Notch in tumorigenesis: oncogene or tumour suppressor? Nat. Rev. Cancer 3 756–767 [DOI] [PubMed] [Google Scholar]
- 23. Artavanis-Tsakonas S., et al. (1999). Notch signaling: cell fate control and signal integration in development. Science 284 770–776 [DOI] [PubMed] [Google Scholar]
- 24. Nickoloff B.J., et al. (2003). Notch signaling as a therapeutic target in cancer: a new approach to the development of cell fate modifying agents. Oncogene 22 6598–6608 [DOI] [PubMed] [Google Scholar]
- 25. Borggrefe T., et al. (2009). The Notch signaling pathway: transcriptional regulation at Notch target genes. Cell. Mol. Life Sci. 66 1631–1646 [DOI] [PMC free article] [PubMed] [Google Scholar]
- 26. Iso T., et al. (2003). HES and HERP families: multiple effectors of the Notch signaling pathway. J. Cell. Physiol. 194 237–255 [DOI] [PubMed] [Google Scholar]
- 27. Bümming P., et al. (2007). Gastrointestinal stromal tumors regularly express synaptic vesicle proteins: evidence of a neuroendocrine phenotype. Endocr. Relat. Cancer 14 853–863 [DOI] [PubMed] [Google Scholar]
- 28. Modlin I.M., et al. (2006). Evolution of the diffuse neuroendocrine system–clear cells and cloudy origins. Neuroendocrinology 84 69–82 [DOI] [PubMed] [Google Scholar]
- 29. Greenblatt D.Y., et al. (2008). Valproic acid activates Notch1 signaling and induces apoptosis in medullary thyroid cancer cells. Ann. Surg. 247 1036–1040 [DOI] [PMC free article] [PubMed] [Google Scholar]
- 30. Greenblatt D.Y., et al. (2007). Valproic acid activates notch-1 signaling and regulates the neuroendocrine phenotype in carcinoid cancer cells. Oncologist 12 942–951 [DOI] [PubMed] [Google Scholar]
- 31. Greenblatt D.Y., et al. (2007). Suberoyl bishydroxamic acid inhibits cellular proliferation by inducing cell cycle arrest in carcinoid cancer cells. J. Gastrointest. Surg. 11 1515–15–20; discussion 1520 [DOI] [PubMed] [Google Scholar]
- 32. Adler J.T., et al. (2008). Histone deacetylase inhibitors upregulate Notch-1 and inhibit growth in pheochromocytoma cells. Surgery 144 956–9–61; discussion 961 [DOI] [PMC free article] [PubMed] [Google Scholar]
- 33. Mühlenberg T., et al. (2009). Inhibitors of deacetylases suppress oncogenic KIT signaling, acetylate HSP90, and induce apoptosis in gastrointestinal stromal tumors. Cancer Res. 69 6941–6950 [DOI] [PMC free article] [PubMed] [Google Scholar]
- 34. Taguchi T., et al. (2002). Conventional and molecular cytogenetic characterization of a new human cell line, GIST-T1, established from gastrointestinal stromal tumor. Lab. Invest. 82 663–665 [DOI] [PubMed] [Google Scholar]
- 35. Tuveson D.A., et al. (2001). STI571 inactivation of the gastrointestinal stromal tumor c-KIT oncoprotein: biological and clinical implications. Oncogene 20 5054–5058 [DOI] [PubMed] [Google Scholar]
- 36. Rossi S., et al. (2006). Gastrointestinal stromal tumours overexpress fatty acid synthase. J. Pathol. 209 369–375 [DOI] [PubMed] [Google Scholar]
- 37. Reynoso D., et al. (2011). Synergistic induction of apoptosis by the Bcl-2 inhibitor ABT-737 and imatinib mesylate in gastrointestinal stromal tumor cells. Mol. Oncol. 5 93–104 [DOI] [PMC free article] [PubMed] [Google Scholar]
- 38. Livak K.J., et al. (2001). Analysis of relative gene expression data using real-time quantitative PCR and the 2(-Delta Delta C(T)) Method. Methods 25 402–408 [DOI] [PubMed] [Google Scholar]
- 39. Pear W.S., et al. (1998). Efficient and rapid induction of a chronic myelogenous leukemia-like myeloproliferative disease in mice receiving P210 bcr/abl-transduced bone marrow. Blood 92 3780–3792 [PubMed] [Google Scholar]
- 40. Zhang P., et al. (2010). Regulation of NOTCH signaling by reciprocal inhibition of HES1 and Deltex 1 and its role in osteosarcoma invasiveness. Oncogene 29 2916–2926 [DOI] [PMC free article] [PubMed] [Google Scholar]
- 41. Geryk-Hall M., et al. (2010). Driven to death: inhibition of farnesylation increases Ras activity in osteosarcoma and promotes growth arrest and cell death. Mol. Cancer Ther. 9 1111–1119 [DOI] [PMC free article] [PubMed] [Google Scholar]
- 42. Zhang P., et al. (2008). Critical role of notch signaling in osteosarcoma invasion and metastasis. Clin. Cancer Res. 14 2962–2969 [DOI] [PMC free article] [PubMed] [Google Scholar] [Retracted]
- 43. McAuliffe J.C., et al. (2009). A randomized, phase II study of preoperative plus postoperative imatinib in GIST: evidence of rapid radiographic response and temporal induction of tumor cell apoptosis. Ann. Surg. Oncol. 16 910–919 [DOI] [PMC free article] [PubMed] [Google Scholar]
- 44. Okamura Y., et al. (2008). Notch signaling is required for the maintenance of enteric neural crest progenitors. Development 135 3555–3565 [DOI] [PubMed] [Google Scholar]
- 45. Gunawan B., et al. (2007). An oncogenetic tree model in gastrointestinal stromal tumours (GISTs) identifies different pathways of cytogenetic evolution with prognostic implications. J. Pathol. 211 463–470 [DOI] [PubMed] [Google Scholar]
- 46. Ylipää A., et al. (2011). Integrative genomic characterization and a genomic staging system for gastrointestinal stromal tumors. Cancer 117 380–389 [DOI] [PMC free article] [PubMed] [Google Scholar]
- 47. Wozniak A., et al. (2007). Array CGH analysis in primary gastrointestinal stromal tumors: cytogenetic profile correlates with anatomic site and tumor aggressiveness, irrespective of mutational status. Genes. Chromosomes Cancer 46 261–276 [DOI] [PubMed] [Google Scholar]
- 48. Meza-Zepeda L.A., et al. (2006). Array comparative genomic hybridization reveals distinct DNA copy number differences between gastrointestinal stromal tumors and leiomyosarcomas. Cancer Res. 66 8984–8993 [DOI] [PubMed] [Google Scholar]