

Abstract
Thioredoxin reductase 1 (TR1) controls the redox state of protein thiols in mammalian cells and has been shown to have roles in both preventing and promoting cancer. To define the role of this selenoenzyme in hepatocellular carcinoma development, we examined tumor incidence in the liver of mice with tissue-specific knockout of mouse TR1 subjected to the liver carcinogen, diethylnitrosamine (DEN). TR1-deficient livers manifested ~90% tumor incidence compared with ~16% in control livers. The TR1-dependent effect was observed independent of sex, and, in control mice, tumorigenesis did not affect the expression of TR1. On the other hand, we observed upregulation of another selenoenzyme, glutathione peroxidase 2 (GPx2), and components of the glutathione (GSH) system, including those that generate reduced GSH. Overall, this study shows that TR1 protects against chemically induced hepatocarcinogenesis via the control of the cellular redox state, whereas its role in promoting this type of cancer is minimal.
Abbreviations
- AOX1
aldehyde oxygenase 1
- CAT
catalase
- CBR3
carbonyl reductase 3
- DEN
diethylnitrosamine
- GCLC
glutamate–cysteine ligase
- GPx1
glutathione peroxidase 1
- GPx2
glutathione peroxidase 2
- GPx4
glutathione peroxidase 4
- GSR
glutathione reductase
- GST-α1
glutathione-S-transferase-alpha 1
- GAPDH
glyceraldehyde 3-phosphate dehydrogenase
- GSH
glutathione
- mRNA
messenger RNA
- MT1
metallothionein 1
- PRDX1
peroxiredoxin 1
- PB
phenobarbital
- SRXN1
sulfiredoxin 1
- SOD1
superoxide dismutase 1
- TRX1
thioredoxin 1
- TR1
thioredoxin reductase 1
- Trx
Thioredoxin
Introduction
Cytosolic thioredoxin reductase 1 (TR1, Txnrd1) is one of the major redox regulators in mammalian cells (1,2), whose primary function in normal cells is to keep thioredoxin (Trx) in the reduced state (3,4). It is an essential selenium-containing protein (selenoprotein; 5,6) with roles in DNA repair, angiogenesis, proliferation and transcription (7–10). By reducing Trx, TR1 serves as a redox regulator of cell signaling and contributes to the antioxidant defense of cells (1,2,7–10). Since one of the major characteristics of cancer cells is that they suffer from oxidative stress (e.g. see refs 11–13 and references therein) and TR1 acts in protecting normal cells from oxidative burden, TR1 has been proposed to have a role in cancer prevention (13–18). Several lines of evidence support this idea. For example, TR1 participates in activating the p53 tumor suppressor and promoting other tumor suppressor activities (14) and its downregulation by specific carcinogenic electrophilic compounds (15) results in altering some of the cell’s malignancy phenotypes.
However, other studies suggested that TR1 promotes cancer development. For example, it is overexpressed in many cancer cell lines and cancers [(13) and see (17,18) for reviews]. TR1 has been targeted by a number of potent inhibitors and anticancer drugs that reduce its activity, which in turn reverses cell morphology and other cancer-like characteristics. These observations have led to the proposal that TR1 is a prime target for cancer therapy [(13) and see (17,18) for reviews].
Several studies suggested a link between the Trx and glutathione (GSH) systems with special emphasis on the interrelationships between these two redox regulatory systems in tumors and cancer cells that depend on these antioxidant systems due to the fact that malignant cells suffer from oxidative stress (11,22). The downregulation of one of these systems in cancer cells often results in an upregulation of the other system. In addition, the simultaneous inhibition of the Trx and GSH systems is being examined as an avenue for cancer therapy by promoting oxidative stress [(11,19,20) and references therein].
The above in vitro and in vivo studies suggest two opposing ways on how TR1-deficient hepatocytes may respond to a liver carcinogen. That is, TR1 has a major role in maintaining redox homeostasis and, for example, decreasing the rate of mutations that lead to cancer; but tumor growth also depends on this redox control, especially due to general vulnerabilities of tumors to oxidative stress (11,19–22). A TR1-deficient system may, therefore, lead to either increased resistance (23) or greater susceptibility to tumor growth [see references in (17,18)]. To shed light on which of these two TR1 roles prevail in chemically induced hepatocarcinogenesis, we examined whether mice lacking TR1 in liver were more or less susceptible to tumor development than control mice. Herein, TR1-deficient mice were found to develop a very high tumor incidence, even though the loss of this selenoenzyme was accompanied by an increase in another selenoenzyme, glutathione peroxidase 2 (GPx2), and elevated levels of components of the GSH system.
Materials and methods
Mouse strains
The TR1 conditional knockout mice in a C57BL/6 background (5) and the Alb-cre transgenic mice also in a C57BL/6 background (24) were crossed and the resulting heterozygous floxed male and female mice were then crossed to obtain the desired experimental genotypes, which are shown in Supplementary Figure 1, available at Carcinogenesis Online. All mice used in this study were therefore C57BL/6. Genotyping was performed as described (5,24). Homozygous floxed mice carrying the Alb-cre transgene were designated as TR1 −liv and mice wild type for TR1 and homozygous for the Alb-cre transgene were designated as TR1 +liv. Both males and females were used in all experiments. Mice were handled and humanely killed in accordance with the National Institutes of Health Institutional Guidelines under the expert direction of Dr John Dennis (NCI, NIH, Bethesda, MD, USA) and all mouse experiments were approved by the Animal Ethics Committee at the National Institutes of Health.
Experimental design
Four-week-old TR1 +liv (n = 19; 10 males, 9 females) and TR1 −liv (n = 18; 8 males, 10 females) mice were injected intraperitoneally with 5mg/kg diethylnitrosamine (DEN; Sigma, St. Louis, MO) in phosphate-buffered saline weekly for 2 weeks (i.e. a total of two DEN injections) to initiate tumors and 2 weeks following DEN injections, the mice received 0.01% phenobarbital (PB; Sigma) in the drinking water to promote tumor formation until their sacrifice at 13 months of age (i.e. animals were killed 12 months after the initial DEN injection). Control TR1 +liv (n=4; 1 male, 3 females) and TR1 −liv (n = 6; 3 males, 3 females) mice did not receive DEN/PB treatment and were killed at 13 months of age.
Liver harvest and tumor analysis
Mice were killed, weighed and their livers removed immediately and weighed. The presence of liver tumors was evaluated and recorded. When tumors were present, fractions of tumors of sufficient sizes and nearby macroscopically normal tissue from the same liver were snap frozen in liquid nitrogen and stored at −80°C for biochemical analyses. The remaining samples were placed in 10% neutral-buffered formalin and paraffin embedded. Tissue sections were stained routinely with hematoxylin and eosin and the presence of hepatic foci, cellular alteration, adenomas and carcinomas was analyzed qualitatively in a blind manner. Neoplastic lesions were classified according to the International Classification of Rodent Tumors: The Mouse (25). Tumors were not observed in other organs during necropsy and other tissues were not further examined.
RNA analysis
Total RNA was isolated from liver tissues using Trizol (Invitrogen). Two-step qPCR was performed to determine the relative expression of genes using primer sequences shown in Supplementary Table 1, available at Carcinogenesis Online. For each sample, 1 µg of total RNA was reverse transcribed using an iScript™ cDNA Synthesis Kit (Bio-Rad), according to the manufacturer’s instructions and used for qPCR using DyNAmo™ SYBR Green qPCR Kit (Thermo Scientific). Reactions were carried out in triplicate and RNA levels were normalized to glyceraldehyde 3-phosphate dehydrogenase (GAPDH).
Western blot analysis
Protein extracts were prepared from liver tumor and surrounding control tissue by homogenizing the tissue in cold lysis buffer [50mM Tris; pH 7.5, 150mM NaCl, 1mM ethylenediaminetetraacetic acid, 0.1% Igepal and Complete Mini Protease Inhibitor (Roche)]. Total protein was electrophoresed on 10% NuPage polyacrylamide gels (Invitrogen), transferred onto polyvinylidene difluoride membranes and immunoblotted with antibodies against either glutathione peroxidase 1 (GPx1), superoxide dismutase 1 (SOD1), thioredoxin 1 (TRX1), peroxiredoxin 1 (PRDX1; Abcam, Cambridge, UK; 1:1000 dilution); catalase (CAT), GPx2 (R&D Systems, Minneapolis, MN; 1:1000 dilution); glutathione peroxidase 4 (GPx4), TR1 (Epitomics, Cambridge, MA; 1:1000 dilution), glutathione reductase (GSR; Epitomics, Cambridge, MA; 1:1000 dilution); glutamate–cysteine ligase (GCLC; Thermo Scientific, Rockford, IL; 1:1000 dilution); glutathione-S-transferase-alpha 1 (GST-α1; Detroit R&D, Detroit, MI; 1:2000 dilution) or carbonyl reductase 3 (CBR3; Proteintech Group, Inc., Chicago, IL, 1:1000 dilution). Following incubation of the primary antibody, membranes were washed with tris-buffered saline (20mM Tris/HCl; pH 7.5, 150mM NaCl) containing 0.1% Tween 20 and incubated in anti-rabbit (GPx1, GPx4, GSR, GCLC, TR1, TRX1, PRDX1, SOD1 and CBR3), anti-goat (GST-α1, CAT) or anti-mouse (GPx2) horseradish peroxidase-conjugated secondary antibodies (Thermo Scientific, Rockford, IL; 1:10 000). Following secondary antibody incubation, membranes were washed with tris-buffered saline, incubated in Supersignal West Dura Extended Duration Substrate (Thermo Scientific, Rockford, IL) and exposed to x-ray film.
GSH measurements
Total GHS [oxidized GSSG (glutathione disulfide) + reduced GSH] levels in liver were measured using a GSH assay kit according to the manufacturer’s instructions (Sigma–Aldrich, St. Louis, MO).
Statistical analysis
Values in all figures are presented as the standard error of the mean (SEM). Student’s t-test was performed using GraphPad Prism (GraphPad Sofware, La Jolla, CA). P values less than or equal to 0.05 (P ≤ 0.05) were considered significant.
Results
TR1-deficient livers are highly susceptible to chemically induced hepatocarcinogenesis
TR1 −liv and the corresponding TR1 +liv mice were either treated or not treated with DEN/PB and killed 12 months following the initial exposure to the liver carcinogen. At necropsy, tumors were found only in livers of treated mice. Tumors were classified according to cell type as benign (adenoma) or malignant (carcinoma) by histological analysis and, in addition, the number of mice with each tumor type was recorded (Table 1). Almost 90% of the TR1 −liv mice (16 of 18) treated with DEN/PB developed liver tumors, whereas only about 16% of TR1 +liv mice (3 of 19) had liver tumors.
Table 1.
Liver tumor incidence and type in TR1+liv and TR1−liv mice with and without DEN/PB treatment
| Total tumor incidence | Tumor type incidence (% total mice) and number of mice with tumors | |||||
| Group | Exposure | Number of mice with tumor | Percent of mice with tumor | Hepatic carcinoma | Hepatic adenoma | Cholangiocellular adenoma |
| TR1+liv (n = 4; 1 male, 3 females) | None | 0 | 0 | 0 | 0 | 0 |
| TR1−liv (n=6; 3 males, 3 females) | None | 0 | 0 | 0 | 0 | 0 |
| TR1+liv (n=19; 10 males, 9 females) | DEN/PB | 3 | 15.8% | 10.5% (1 male, 1 female) | 5.3% (1 male) | 0 |
| TR1−liv (n=18; 8 males, 10 females) | DEN/PB | 16 | 88.9% | 66.7% (5 males, 7 females) | 11.1% (1 male, 1 female) | 11.1% (1 male, 1 female) |
The types of tumors found in the TR1 −liv mice fell into three classes, hepatic carcinoma, hepatic adenoma and cholangiocellular adenoma, with carcinoma being by far the most prevalent. Two tumors in the TR1 +liv mice were carcinomas, and the only other tumor-bearing TR1 +liv mouse had an adenoma. Pathological analysis of the three tumor types found in TR1 −liv mice and their descriptions are given in Figure 1C. There was no preference with respect to sex as the number of tumors and tumor types were virtually identical in males and females.
Fig. 1.

Hepatocarcinogenesis in TR1 +liv and TR1 −liv mice. (A) Liver and body weight ratios in TR1 +liv and TR1 −liv mice (n = 4 and 6 for TR1 +liv and TR1 −liv untreated and 19 and 18 for TR1 +liv and TR1 −liv DEN/PB-treated mice, respectively; *Denotes statistical difference, P ≤ 0.05). (B) Lipidosis revealed by liver pathology analysis. Livers from untreated TR1 +liv and TR1−liv mice were sectioned, stained with hematoxylin and eosin and analyzed. Representative examples of lipidosis are shown. Arrows point to the characteristic clear staining cytoplasmic vacuoles. (C) Carcinogenesis in TR1 +liv and TR1 −liv mice. Livers from TR1 −liv mice were sectioned and stained with hematoxylin and eosin and analyzed. Representative examples of a hepatocellular carcinoma, hepatic cholangiocellular adenoma and hepatocellular adenoma are shown. Arrows designate hepatocellular carcinoma characterized by invasiveness, varied growth patterns and cellular pleomorphism; hepatocellular adenoma is circumscribed, noninvasive and composed of well-differentiated hepatocytes; and hepatic cholangiocellular adenoma is a circumscribed tumor with areas of hepatic and biliary differentiation. The pathology of the hepatocellular carcinoma and adenoma tumors from control mice was indistinguishable from the corresponding tumors in TR1 −liv mice.
Elevated liver to body weight ratios in TR1-deficient mice
The liver/body ratios were much greater in TR1 −liv-treated mice due the large tumor mass in livers of most of these animals compared with TR1 +liv mice (Figure 1A). Rollins et al. (26) examined the liver growth rates in TR1 +liv and TR1 −liv mice and found them to be similar, but examination of the liver/body ratios in the present study showed that these ratios were slightly but significantly higher (P ≤ 0.05) in TR1 −liv untreated mice compared with the corresponding untreated TR1 +liv mice. This observation prompted us to perform histological comparison of the livers (Figure 1B). Four of six untreated TR1 −liv mice had mid-zonal hepatic lipidosis compared with none of four TR1 +liv mice. The extent of lipidosis in the affected mice ranged from mild to severe with one mouse showing mild lipidosis, two moderate (see representative liver in Figure 1B, lower panel) and one having severe lipidosis.
Selenoenzyme expression is virtually unaffected by DEN exposure, but GPx2 is dramatically upregulated in carcinogen-induced TR1-deficient tumors
To assess the effects of DEN/PB treatment on the expression of TR1 and the cellular GPxs (GPx1, GPx2 and GPx4) in the livers of TR1 +liv and TR1 −liv mice, we compared the messenger RNA (mRNA) and protein levels of these selenoproteins in treated and untreated mice (Supplementary Figure 2, available at Carcinogenesis Online). The Tr1 and TR1 levels in the livers of these mice were similar and western blotting confirmed that, as expected, the corresponding TR1 −liv tissues did not express this selenoprotein (Supplementary Figure 2A and 2B, respectively, available at Carcinogenesis Online). The levels of Gpx1 were similar in the livers of the two treated mouse lines compared with the Gpx1 levels in the corresponding livers of untreated mice, which were lower but also in similar amounts (Supplementary Figure 2A, available at Carcinogenesis Online). However, the GPx1 levels appeared similar in both treated and untreated lines that showed some variations in levels in the various duplicate samples (Supplementary Figure 2B, available at Carcinogenesis Online). Treatment of these mice with DEN/PB caused an increase in the Gpx1 level, but it is not clear why the higher levels did not result in more GPx1 expression. Gpx2 was poorly expressed in livers of the two untreated mouse lines but slightly higher in the TR1 −liv mouse. Upon treatment, Gpx2 levels significantly increased in both TR1 +liv and TR1 −liv livers (P ≤ 0.05), with the most dramatic increase occurring in TR1 −liv livers (P ≤ 0.05), albeit still being at a relatively low level. The amounts of GPx2 expressed in the livers of these mice were below detection of the corresponding antibodies. Gpx4 levels were slightly, but not significantly, increased in livers of TR1 −liv mice compared with the controls, but GPx4 protein levels were higher in livers of untreated TR1 −liv mice compared with the corresponding TR1 +liv mice. Similarly, treated TR1 −liv mice expressed higher levels of GPx4 than the corresponding TR1 +liv mice. The enhanced expression of GPx4 in livers of TR1 −liv mice compared with the corresponding TR1 +liv mice most probably was due to the loss of TR1 that resulted in higher availability of selenium and Sec for synthesis of other hepatic selenoproteins. Since treatment of mice with DEN/PB did not have major consequences on the relative expression of these selenoenzymes, we examined only the livers of treated mice in subsequent studies.
Henceforth, we designated nontumor-containing tissue that surrounded tumors in livers of DEN/PB-treated mice as control tissue. Analyses of mRNA and protein levels of TR1, Trx1, GPx1, GPx2 and GPx4 (Figure 2) in liver tumors and surrounding control tissue revealed that the levels of Tr1 mRNA and protein were similar in TR1 +liv mice and the single tumor examined in the TR1 +liv mouse, and as expected, were substantially reduced in TR1 −liv tumor and TR1 −liv mice (Figure 2A and 2B). Substantial levels of Trx1 were found in all liver samples from TR1-sufficient to knockout mice and the variations in amounts were not significantly different. TRX1 levels were slightly reduced in tumor tissues compared with control tissues in both TR1 +liv and TR1 −liv mice.
Fig. 2.

Selenoprotein and Trx1 expression in TR1 +liv and TR1 −liv mice. (A) Gene expression in tumors and surrounding control tissue from livers of TR1 +liv and TR1 −liv mice. Tr1 and Trx1 mRNA levels were analyzed by real-time PCR. Data are shown as relative mRNA levels compared with GAPDH (n = 1 for TR1 +liv tumor, n = 4 for other samples; *Denotes statistical difference, P ≤ 0.05). (B) Western blot analysis of TR1 and TRX1 in DEN/PB-treated TR1 +liv and TR1 −liv mice. A representative western blot is shown. Coomassie blue staining is shown in the bottom panel as control for protein loading. (C) mRNA levels of GPx1, GPx2 and GPx4. Gene expression was analyzed by real-time PCR. Data are shown as relative mRNA levels compared with GAPDH (n = 1 for TR1 +liv tumor, n = 4 for other samples; *Denotes statistical difference, P ≤ 0.05). (D) Western blot analysis of GPx1, GPx2 and GPx4 in livers of TR1 +liv and TR1 −liv mice. Protein extracts were prepared from tumors and surrounding control tissue from livers of TR1 +liv and TR1 −liv mice. Representative samples from a western blot are shown. Coomassie blue staining is shown in the bottom panel as control for protein loading.
Gpx1 mRNA levels were statistically unchanged in the four tissue samples (Figure 2C). However, the expression of GPx1 was reduced substantially in the tumor of the TR1 +liv mouse compared with control tissue and to the TR1 −liv tumor and its control tissue (Figure 2D). In addition, the GPx1 level appeared to be slightly lower in TR1 −liv tumor than its control tissue. Gpx2, on the other hand, was poorly expressed in TR1 +liv samples and in the control TR1 −liv sample, but it increased dramatically in the tumor TR1 −liv sample (P ≤ 0.05) suggesting that the large enhancement of GPx2 occurred in response to TR1 loss and to compensate for the reduced ability to maintain redox homeostasis. Gpx4 expression was enhanced about 3-fold in the TR1 +liv tumor sample over that observed in the surrounding control tissue and was also enriched in the TR1 −liv tumor sample over that observed in the control tissue (P ≤ 0.05). GPx4 was expressed higher in TR1 −liv tissues than the corresponding TR1 +liv samples.
Hepatic TR1 deficiency is compensated for by elevated expression of enzymes involved in GSH metabolism
The expression of mRNAs and the corresponding proteins of three enzymes involved in GSH metabolism, GST-α1, GSR and GCLC, was examined in TR1 +liv and TR1 −liv tumor and surrounding control tissues (Figure 3A and 3B). The levels of Gsta and Gsr were low in both the TR1 +liv tumor and surrounding control samples but increased dramatically in the corresponding TR1 −liv liver samples (P ≤ 0.05), whereas those of Gclc appeared to be similar in these four samples; one exception involved Gclc expression that was about 2-fold lower in the TR1 +liv tumor sample compared with the corresponding control tissues (Figure 3A). The GST-α1, GSR and GCLC levels were all dramatically increased in the TR1 −liv tumor and control samples compared with those in the corresponding TR1 +liv samples and the enrichment of GSR and GCLC was greater in the TR1 −liv tumor than TR1 +liv control samples (Figure 3B). The fact that GSR is involved in reducing GSSG to GSH and that GCLC is the first rate-limiting enzyme involved in GSH synthesis provides strong evidence that their elevated expression in TR1 −liv tumors is to provide additional antioxidant support during TR1 deficiency.
Fig. 3.

Expression of enzymes involved in GSH metabolism and GSH levels in TR1 +liv and TR1 −liv mice. (A) mRNA levels of Gsta1, Gsr and Gclc. Gene expression was analyzed by real-time PCR. Data are shown as relative mRNA levels compared with GAPDH (n = 1 for TR1 +liv tumor, n = 4 for other samples; *Denotes statistical difference, P ≤ 0.05). (B) Western blot analysis of GST-α1, GSR and GCLC. Protein extracts were prepared from tumors and surrounding control tissue from livers of TR1 +liv and TR1 −liv mice. Representative samples from a western blot are shown. Coomassie blue staining is shown in the bottom panel as control for protein loading. (C) Total GSH levels were measured in livers from TR1 +liv control (n = 3), TR1 +liv tumor (n = 1), TR1 −liv control (n = 3) and TR1 −liv tumor (n = 3) tissues.
The levels of total GSH were slightly, but not significantly, lower in TR1 −liv tumors than in control samples (Figure 3C).
Other antioxidant systems probably do not provide additional antioxidant support to TR1-deficient liver samples
We further examined mRNA expression of other antioxidant proteins, including PRDX1, CAT, SOD1, sulfiredoxin 1 (SRXN1), metallothionein 1 (MT1), CBR3, and three cytochrome P450 isozymes, CYP2E1, CYP2B13 and aldehyde oxygenase 1 (AOX1; Figure 4). The functions of these antioxidant proteins are summarized in Supplementary Table 2, available at Carcinogenesis Online. With the exception of Cbr3 and Cyp2e1, antioxidant protein mRNAs appeared downregulated in the TR1 −liv and TR1 +liv tumor tissues compared with the corresponding control tissues (Figure 4A). On the other hand, Cbr3 was poorly expressed in TR1 +liv tumor and control tissues but was dramatically upregulated in the TR1 −liv tumor and control tissues (P ≤ 0.05). Cyp2e1 was slightly upregulated in the tumor samples compared with the corresponding control tissues, but the differences were not statistically significant. Cyp2b13 and Aox1 were upregulated in TR1 −liv control tissues compared with TR1 +liv tissues, which was apparently due to the loss of TR1 expression, and both were downregulated in TR1 −liv tumor compared with TR1 −liv control tissues (P ≤ 0.05). Sod1 expression was lower in TR1 −liv control tissue when compared with TR1 +liv control tissue and was also lower in the TR1 −liv tumor samples compared with TR1 −liv control tissues (P ≤ 0.05). We further examined the expression of PRDX1, CAT, SOD1 and CBR3 (Figure 4B). Although we found no significant change in mRNA levels, PRDX1 was upregulated in TR1 −liv tumor and control tissues compared with the corresponding TR1 +liv samples, whereas CAT and SOD1 expression was slightly higher in the TR1 −liv control tissue compared with the three other tissues and SOD1 appeared to be slightly decreased in TR1 −liv tumor samples compared with TR1 −liv control tissues. CBR3 expression was dramatically upregulated in the TR1 −liv tumor and control tissues and appeared to be slightly more upregulated in the TR1 −liv tumor than the control tissue. With the possible exception of CBR3, the other antioxidant proteins examined did not appear to provide additional antioxidant support to TR1 −liv tumor tissues.
Fig. 4.
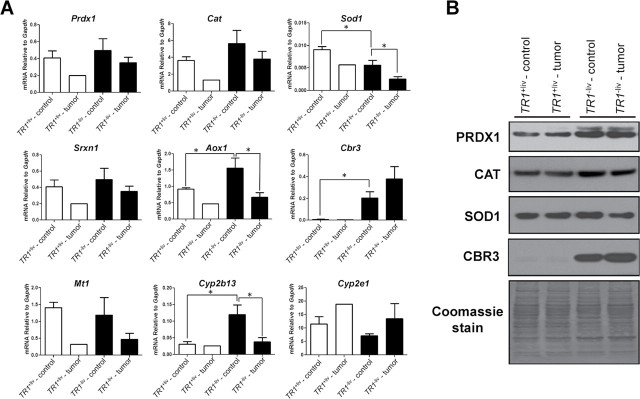
Expression of oxidative stress-related genes. (A) Gene expression in tumors and surrounding control tissue from livers of TR1 +liv and TR1 −liv mice. mRNA levels of Prdx1, Cat, Sod1, Srxn1, Aox1, Cbr3, Mt1, Cyp2b13 and Cyp2e1 in tumors and surrounding control tissue from livers of TR1 +liv and TR1 −liv mice was analyzed by real-time PCR. Data are shown as relative mRNA level to GAPDH (n = 1 for TR1 +liv tumor, n = 4 for other samples; *Denotes statistical difference, P ≤ 0.05). (B) Western blot analysis of PRDX1, CAT, SOD1 and CBR3 in DEN/PB-treated TR1 +liv and TR1 −liv mice. Protein extracts were prepared from tumors and surrounding control tissue from livers of TR1 +liv and TR1 −liv mice. Representative samples from a western blot are shown. Coomassie blue staining is shown in the bottom panel.
Discussion
The dramatically enhanced liver tumor incidence in DEN/PB-treated TR1 −liv mice (~90% of the animals developed tumors) compared with DEN/PB-treated TR1 +liv mice (~16% tumor incidence) clearly shows that the loss of this important selenoprotein in hepatocytes results in a considerable increase in tumor development. These data demonstrate the significance of TR1 in preventing chemically induced liver cancer in mice.
Since most cancer cells suffer from oxidative stress as a consequence of disrupted redox homeostasis, they rely on key redox regulators to perpetuate rapid growth and sustain their malignant status. Confronted with the deficiency in a major redox regulatory system, such cells would have to compensate by elevating functions of other antioxidant systems. Consistent with this possibility, the expression of GPx2 was dramatically enriched in tumors of TR1 −liv mice compared with surrounding tissue and compared with the tumor in TR1 +liv mice and its surrounding tissue. Although GPx2 is known as a gastrointestinal GSH peroxidase, it is also expressed in other tissues including human liver (27). Interestingly, its expression level is increased in malignant epithelial cells. It has an important role in cell proliferation, is an antioxidant and has also been implicated in protection against carcinogenesis (27,28). Its large increase in tumors of TR1 −liv mice observed in the present study suggests that GPx2 has a role in the development and/or maintenance of this cancer.
The levels of enzymes involved in the GSH system, GST-α1, GSR and GCLC, were also enhanced considerably in DEN/PB-treated TR1 −liv mice compared with treated TR1 +liv mice. GSR and GCLC were enriched in TR1 −liv tumors compared with surrounding tissue. The increased expression of enzymes involved in generating GSH, GSR and GCLC is expected to provide tumors of TR1 −liv mice with additional reducing equivalents necessary to counter increased oxidative stress in malignant TR1 −liv tissue. Overall, our data suggest that the loss of an important redox regulator of protein thiols in liver led to an enrichment in several components of the GSH system including GPx2, most probably as a response to an increase in oxidized molecules normally reduced by the Trx system. However, this enrichment did not prevent tumor formation and may in turn be driving the malignancy.
The roles of TR1 and the GSH system (29–32) in preventing, promoting and/or sustaining cancer have been recognized for some time. However, the interrelationships and interdependence of these systems, particularly in cancer tissue, have received little attention until recently (11,19–22). An interesting finding in several recent studies, and in TR1-deficient hepatocytes as observed in our study, is the upregulation of the NF-E2-related factor 2 (Nrf2) stress-response pathway (33,34). This transcription factor has been shown to be upregulated in TR1-deficient hepatocytes (34), activating expression of many proteins involved in protective cellular effects (35,36), and is responsible for the upregulation of several antioxidant proteins involved in selenium and GSH metabolism, including TR1. As previously reported and confirmed in this study, TR1 −liv mice show an increase in Nrf2-regulated genes and proteins involved in phase I and phase II response, such as Cbr3, Cyp2b13 and Gsta (34).
Upregulation of Nrf2 has been observed in many types of cancer and may play a role in promoting malignancy due to the subsequent upregulation of protective enzymes (37). However, Nrf2-deficient mice display an increased sensitivity to hepatic carcinogens, most probably due to the loss of detoxification enzymes regulated by Nrf2 (37). Clearly, despite the increase of many Nrf2-regulated enzymes in TR1 −liv mice, tumor formation is elevated, implicating TR1 as a key Nrf2-regulated enzyme in preventing malignancy.
GPx4 expression was also upregulated in TR1 −liv compared with TR1 +liv tissues. However, the apparent slight downregulation of GPx4 in TR1 −liv tumor tissues compared with the surrounding control tissues may be a reflection of the enhanced expression of specific selenoproteins (e.g. GPx2). This observation may also apply to GPx1 as the simultaneous upregulation in TR1 expression and downregulation of GPx1 in tumor tissues was initially reported several years ago (38). Such translational demands may also be responsible, along with the fact that SECIS-binding protein 2 is limiting in selenoprotein synthesis (39,40), for the disconnect observed in mRNA expression and corresponding protein synthesis.
Among other tested genes involved in antioxidant control that were examined in the present study, only Cbr3 and Cyp2e1 appeared to be upregulated in TR1 −liv tumors compared with the surrounding tissue. Cyp2e1 has been shown to be involved in the metabolic activation of DEN (41), possibly contributing to the increased tumorgenicity seen in TR1 −liv mice. In addition, CBR3 was strongly upregulated in TR1 −liv tumor and surrounding control tissue compared with the corresponding TR1 +liv tissues. However, any possible role of this protein in liver cancer must await further examination. PRDX1 was upregulated in both TR1 −liv tumor and nontumor tissue compared with the corresponding TR1 +liv tissues suggesting that the enhanced expression of this protein is also needed to compensate for TR1 deficiency.
As discussed in the Introduction, overexpression of TR1 has been observed in many tumors and cancer cells, and this protein is a target for several drugs currently in use in cancer treatment, which has led to the proposal that this selenoenzyme is a prime target for chemotherapy. However, since the expression of this selenoenzyme was not enhanced in the TR1 sufficient liver tumor (compared with control tissues), it would seem that this selenoenzyme is not involved in promoting chemically induced hepatocarcinogenesis and thus its targeting may not help in liver cancer therapy. Instead, the evidence presented herein that TR1 deficiency results in a dramatic increase in chemical hepatocarcinomas suggests that its role is more of one in protecting hepatocytes against cancer initiation.
Clearly, cancers and cancerous tissues are different with regard to the role of TR1 and other selenoproteins in carcinogenesis (17,18). Selenium deficiency has also been shown to play a role in preventing some cancers (42,43), including mouse liver cancer driven by the c-Myc oncogene (43). In addition, differences may be seen when only one selenoprotein is compromised either by knockout, as in our study, or by targeted inactivation using specific inhibitors [see (16) for review] or when the entire selenoproteome is compromised, as in dietary studies and genetic manipulations involving essential factors (e.g. Sec tRNA) that affect selenoprotein expression as a whole. Further complications arise from compensatory changes in other systems regulating redox homeostasis. In our study, the loss of TR1 led to an increase in another selenoenzyme, GPx2 (Figure 2C), and other components of the GSH system (Figure 3), whereas the total loss of selenoprotein expression can no longer support such interplay. As investigators begin to elucidate the complex interactions between different redox regulators and redox regulatory systems (see Introduction), such studies will most certainly uncover the interrelationships involving selenium, individual selenoproteins, the entire selenoproteome and other antioxidant systems.
As we move into the era of personalized medicine, information on the specific links between tumors derived from mutations in certain genes and pathways, and their response to drugs, will play an important role in clinical approaches. Here, we defined the role of one critical enzyme, previously implicated in both preventing and promoting cancer, in chemically induced hepatocarcinogenesis in mice. However, additional studies will be required to define other cancer types with regard to the roles of TR1, other selenoproteins and ultimately dietary selenium, in cancer. With this information, it may be possible, in the future, to precisely define conditions and genotypes that benefit from dietary selenium, as well as those for which dietary selenium will have adverse effects.
Supplementary material
Supplementary Tables 1 and 2 and Figures 1 and 2 can be found at http://carcin.oxfordjournals.org/
Funding
National Institutes of Health NCI Intramural Research Program and the Center for Cancer Research (to D.L.H.) and National Institutes of Health Grants GM065204 and CA080946 (to V.N.G.).
Conflict of Interest Statement: None declared.
References
- 1. Gromer S., et al. (2005). Human selenoproteins at a glance. Cell. Mol. Life Sci. 62 2414–2437 [DOI] [PMC free article] [PubMed] [Google Scholar]
- 2. Holmgren A. (2006). Selenoproteins of the thioredoxin system. In Hatfield D.L., Berry M.J., Gladyshev V.N., (eds). Selenium: Its Molecular Biology and Role In Human Health 2nd edition Springer Science+Business Media; New York, NY: pp. 183–194 [Google Scholar]
- 3. Arnér E.S., et al. (2000). Physiological functions of thioredoxin and thioredoxin reductase. Eur. J. Biochem. 267 6102–6109 [DOI] [PubMed] [Google Scholar]
- 4. Turanov A.A., et al. (2010). Mammalian thioredoxin reductase 1: roles in redox homoeostasis and characterization of cellular targets. Biochem. J. 430 285–293 [DOI] [PMC free article] [PubMed] [Google Scholar]
- 5. Jakupoglu C., et al. (2005). Cytoplasmic thioredoxin reductase is essential for embryogenesis but dispensable for cardiac development. Mol. Cell. Biol. 25 1980–1988 [DOI] [PMC free article] [PubMed] [Google Scholar]
- 6. Bondareva A.A., et al. (2007). Effects of thioredoxin reductase-1 deletion on embryogenesis and transcriptome. Free Radic. Biol. Med. 43 911–923 [DOI] [PMC free article] [PubMed] [Google Scholar]
- 7. Rundlöf A.K., et al. (2004). Regulation of the mammalian selenoprotein thioredoxin reductase 1 in relation to cellular phenotype, growth, and signaling events. Antioxid. Redox Signal. 6 41–52 [DOI] [PubMed] [Google Scholar]
- 8. Biaglow J.E., et al. (2005). The thioredoxin reductase/thioredoxin system: novel redox targets for cancer therapy. Cancer Biol. Ther. 4 6–13 [DOI] [PubMed] [Google Scholar]
- 9. Arnér E.S., et al. (2006). The thioredoxin system in cancer. Semin. Cancer Biol. 16 420–426 [DOI] [PubMed] [Google Scholar]
- 10. Fujino G., et al. (2006). Thioredoxin and protein kinases in redox signaling. Semin. Cancer Biol. 16 427–435 [DOI] [PubMed] [Google Scholar]
- 11. Mandal P.K., et al. (2010). Loss of thioredoxin reductase 1 renders tumors highly susceptible to pharmacologic glutathione deprivation. Cancer Res. 70 9505–9514 [DOI] [PubMed] [Google Scholar]
- 12. Montero A.J., et al. (2011). Cellular redox pathways as a therapeutic target in the treatment of cancer. Drugs 71 1385–1396 [DOI] [PubMed] [Google Scholar]
- 13. Selenius M., et al. (2010). Selenium and the selenoprotein thioredoxin reductase in the prevention, treatment and diagnostics of cancer. Antioxid. Redox Signal. 12 867–880 [DOI] [PubMed] [Google Scholar]
- 14. Merrill G.F., et al. (1999). The human p53 negative regulatory domain mediates inhibition of reporter gene transactivation in yeast lacking thioredoxin reductase. Cancer Res. 59 3175–3179 [PubMed] [Google Scholar]
- 15. Moos P.J., et al. (2003). Electrophilic prostaglandins and lipid aldehydes repress redox-sensitive transcription factors p53 and hypoxia-inducible factor by impairing the selenoprotein thioredoxin reductase. J. Biol. Chem. 278 745–750 [DOI] [PubMed] [Google Scholar]
- 16. Urig S., et al. (2006). On the potential of thioredoxin reductase inhibitors for cancer therapy. Semin. Cancer Biol. 16 452–465 [DOI] [PubMed] [Google Scholar]
- 17. Hatfield D.L., et al. (2009). Selenoproteins that function in cancer prevention and promotion. Biochim. Biophys. Acta 1790 1541–1545 [DOI] [PMC free article] [PubMed] [Google Scholar]
- 18. Yoo M.-H., et al. (2012). Selenoproteins harboring a split personality in both preventing and promoting cancer. In Hatfield D.L., Berry M.J., Gladyshev V.N., (eds). Selenium: Its Molecular Biology and Role In Human Health 3rd edition Springer Science+Business Media; New York: NY: pp. 325–333 [Google Scholar]
- 19. Scarbrough P.M., et al. (2012). Simultaneous inhibition of glutathione- and thioredoxin-dependent metabolism is necessary to potentiate 17AAG-induced cancer cell killing via oxidative stress. Free Radic. Biol. Med. 52 436–443 [DOI] [PMC free article] [PubMed] [Google Scholar]
- 20.Simons A.L., et al. Inhibition of glutathione and thioredoxin metabolism enhances sensitivity to perifosine in head and neck cancer cells. J. Oncol. (2009);2009:519563. doi: 10.1155/2009/519563. [DOI] [PMC free article] [PubMed] [Google Scholar]
- 21. Prigge J.R., et al. (2012). Hepatocyte DNA replication in growing liver requires either glutathione or a single allele of txnrd1. Free Radic. Biol. Med. 52 803–810 [DOI] [PMC free article] [PubMed] [Google Scholar]
- 22. Fath M.A., et al. (2011). Enhancement of carboplatin-mediated lung cancer cell killing by simultaneous disruption of glutathione and thioredoxin metabolism. Clin. Cancer Res. 17 6206–6217 [DOI] [PMC free article] [PubMed] [Google Scholar]
- 23. Yoo M.H., et al. (2006). Thioredoxin reductase 1 deficiency reverses tumor phenotype and tumorigenicity of lung carcinoma cells. J. Biol. Chem. 281 13005–13008 [DOI] [PubMed] [Google Scholar]
- 24. Carlson B.A., et al. (2004). Specific excision of the selenocysteine tRNA[Ser]Sec (Trsp) gene in mouse liver demonstrates an essential role of selenoproteins in liver function. J. Biol. Chem. 279 8011–8017 [DOI] [PubMed] [Google Scholar]
- 25.Mohr U. International Classification of Rodent Tumors. The Mouse; Springer-Verlag; New York, NY: (2001). [Google Scholar]
- 26. Rollins M.F., et al. (2010). Hepatocytes lacking thioredoxin reductase 1 have normal replicative potential during development and regeneration. J. Cell. Sci. 123(Pt 14)2402–2412 [DOI] [PMC free article] [PubMed] [Google Scholar]
- 27. Brigelius-Flohé R., et al. (2009). Glutathione peroxidases in different stages of carcinogenesis. Biochim. Biophys. Acta 1790 1555–1568 [DOI] [PubMed] [Google Scholar]
- 28. Banning A., et al. (2012). Glutathione Peroxidase 2 and Its Role in Cancer. In Hatfield D.L., Berry M.J., Gladyshev V.N., (eds). Selenium: Its molecular biology and role in human health 3rd edition Springer Science+Business Media; New York, NY: pp. 271–282 [Google Scholar]
- 29. Estrela J.M., et al. (2006). Glutathione in cancer biology and therapy. Crit. Rev. Clin. Lab. Sci. 43 143–181 [DOI] [PubMed] [Google Scholar]
- 30. Franco R., et al. (2009). Apoptosis and glutathione: beyond an antioxidant. Cell Death Differ. 16 1303–1314 [DOI] [PubMed] [Google Scholar]
- 31. Corti A., et al. (2010). Gamma-glutamyltransferase of cancer cells at the crossroads of tumor progression, drug resistance and drug targeting. Anticancer Res. 30 1169–1181 [PubMed] [Google Scholar]
- 32. Montero A.J., et al. (2011). Cellular redox pathways as a therapeutic target in the treatment of cancer Drugs 71 1385–1396 [DOI] [PubMed] [Google Scholar]
- 33. Bondareva A.A., et al. (2007). Effects of thioredoxin reductase-1 deletion on embryogenesis and transcriptome. Free Radic. Biol. Med. 43 911–923 [DOI] [PMC free article] [PubMed] [Google Scholar]
- 34.Suvorova E.S., et al. Cytoprotective Nrf2 pathway is induced in chronically txnrd 1-deficient hepatocytes. PLoS ONE. (2009);4:e6158. doi: 10.1371/journal.pone.0006158. [DOI] [PMC free article] [PubMed] [Google Scholar]
- 35. Kensler T.W., et al. (2007). Cell survival responses to environmental stresses via the Keap1-Nrf2-ARE pathway. Annu. Rev. Pharmacol. Toxicol. 47 89–116 [DOI] [PubMed] [Google Scholar]
- 36. Okawa H., et al. (2006). Hepatocyte-specific deletion of the keap1 gene activates Nrf2 and confers potent resistance against acute drug toxicity. Biochem. Biophys. Res. Commun. 339 79–88 [DOI] [PubMed] [Google Scholar]
- 37. Slocum S.L., et al. (2011). Nrf2: control of sensitivity to carcinogens. Arch. Toxicol. 85 273–284 [DOI] [PubMed] [Google Scholar]
- 38. Gladyshev V.N., et al. (1998). Contrasting patterns of regulation of the antioxidant selenoproteins, thioredoxin reductase, and glutathione peroxidase, in cancer cells. Biochem. Biophys. Res. Commun. 251 488–493 [DOI] [PubMed] [Google Scholar]
- 39. Copeland P.R., et al. (2000). A novel RNA binding protein, SBP2, is required for the translation of mammalian selenoprotein mRNAs. EMBO J. 19 306–314 [DOI] [PMC free article] [PubMed] [Google Scholar]
- 40. Low S.C., et al. (2000). SECIS-SBP2 interactions dictate selenocysteine incorporation efficiency and selenoprotein hierarchy. EMBO J. 19 6882–6890 [DOI] [PMC free article] [PubMed] [Google Scholar]
- 41. Kang J.S., et al. (2007). Role of CYP2E1 in diethylnitrosamine-induced hepatocarcinogenesis in vivo. Cancer Res. 67 11141–11146 [DOI] [PubMed] [Google Scholar]
- 42. Felix K., et al. (2004). Selenium deficiency abrogates inflammation-dependent plasma cell tumors in mice. Cancer Res. 64 2910–2917 [DOI] [PubMed] [Google Scholar]
- 43. Novoselov S.V., et al. (2005). Selenoprotein deficiency and high levels of selenium compounds can effectively inhibit hepatocarcinogenesis in transgenic mice. Oncogene 24 8003–8011 [DOI] [PubMed] [Google Scholar]