Abstract
Aim:
The aim was to evaluate the quantitative changes in nuclear diameter (ND), cytoplasmic diameter (CD) and nuclear/cytoplasmic ratio (N/C) in cytological buccal smears of iron deficiency anemic patients by comparing with normal healthy individuals.
Materials and Methods:
The study group consisted of 40 healthy individuals and 40 iron deficiency anemic patients who were selected on clinical history, hematological investigations, and confirmed by serum ferritin levels. Exfoliative buccal smears stained with PAP stain were evaluated for cytoplasimic, nuclear diameters, and nuclear/cytoplasmic ratios (N/C) using Image Proexpress Version 6.0 image analysis system. All the parameters were statistically analyzed by using unpaired ‘t’ test.
Results:
A significant increase is seen in the average nuclear diameter (ND) and N/C ratio of the anemic group when compared to the control group. The average cytoplasmic diameter (CD) did not show any statistical difference among the two groups.
Conclusion:
Oral exfoliative cytological techniques could possibly be a noninvasive alternative diagnostic tool for iron deficiency anemia.
Keywords: Cytomorphometry, iron deficiency anemia, oral exfoliative cytology
Introduction
Anemia is defined as an abnormal reduction in the number of circulating red blood cells, the quantity of hemoglobin and the volume of packed red cells in a given unit of blood. The various blood diseases present polymorphic clinical expressions, one of which is the relatively constant involvement of oral structures.[1] The oral mucous membrane is particularly sensitive to certain types of systemic disorders such as anemias, leukemias, vitamin deficiencies, and many infectious diseases.[2] Iron deficiency is considered to be the world's most common single-nutrient disorder.[3] Iron deficiency anemia attributable to nutritional deficiency and/or blood loss still remains the most common treatable anemia in the world.[3,4]
Aim
The aim was to evaluate the quantitative changes in nuclear diameter (NA), cytoplasmic diameter (CD), and cytoplasmic/nuclear ratio (N/C) in cytological buccal smears of iron deficiency anemic patients by comparing with normal healthy individuals.
Materials and Methods
The study group consisted of 40 clinically suspected cases of iron deficiency anemia and 40 normal healthy individuals as the control group selected from Out Patient Department of SIBAR Institute of Dental Sciences, Guntur. The control group consisted of healthy individuals with clinically normal oral mucosa. Patients with deleterious habits and systemic diseases are excluded from the study group. Written informed consent was obtained and the proforma inventory was completed detailing name, age, gender, and relevant medical history.
Clinical history, hematological tests such as peripheral blood smear, hemoglobin estimation, total RBC count (RBC), mean corpuscular volume (MCV), mean corpuscular hemoglobin (MCH), mean corpuscular hemoglobin concentration (MCHC), and serum ferritin levels (ADVIA Centaur CP Ferrtin immunoassay) were assessed in both the control and iron deficiency anemia groups. The hemoglobin in controls ranged from 16.9% to 12.1 g% and in anemic patients 4.9% to 8.8 g%. Individuals with serum ferritin levels below 15 ng/ml were considered under the iron deficiency anemia group. Serum ferritin levels in the iron deficiency anemia group ranged from 4.43 ng/ml to 12.2 ng/ml. Both the groups in the study were subjected for oral exfoliative cytological studies.
Cytomorphometric Analysis
In each smear 20 cells were selected by moving the microscope stage in “Z” shape to avoid recounting of the same cell. Using Image Pro Express software nuclear and cellular diameters were obtained and then mean cellular diameter (CD), nuclear diameter (ND), and the nuclear/cytoplasmic ratio were calculated for each case. Variables were compared between two groups using the Pearson correlation coefficient test and the comparison between two means was done using the t-test in SPSS software version 13.0. P values < 0.05 were considered significant.
Results
The age of study groups ranged between 21 and 49 years in iron deficiency anemia with mean age of 35 years and 20 and 48 years in control group with mean age of 34 years. In iron deficiency anemia group there were 19 males and 21 females. In the control group there were 20 males and 20 females.
There was no significant difference between three age groups (20--29, 30—39, and 40--49 years) with respect to mean CD (P < 0.625) and mean ND (P < 0.260). There was no significant difference in the CD (P < 0.829) and ND (P < 0.980) values between the two sexes in the study group. The mean nuclear cytoplasmic (N/C) ratio showed a statistically significant increase (P < 0.0007) when compared between the two study groups.
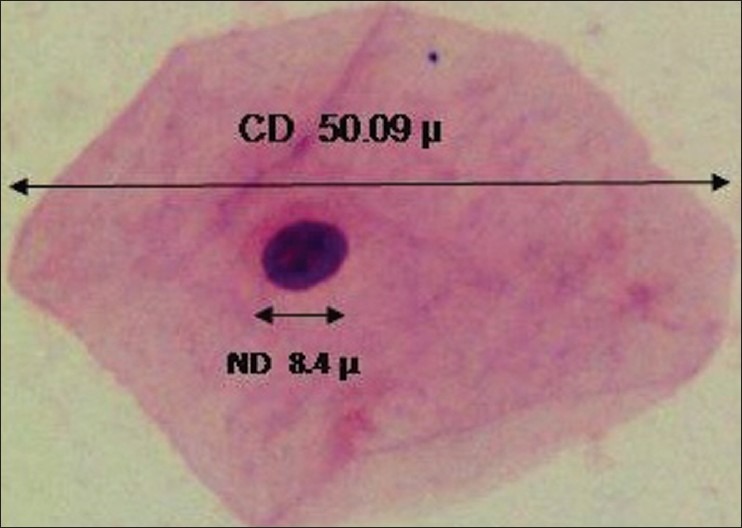
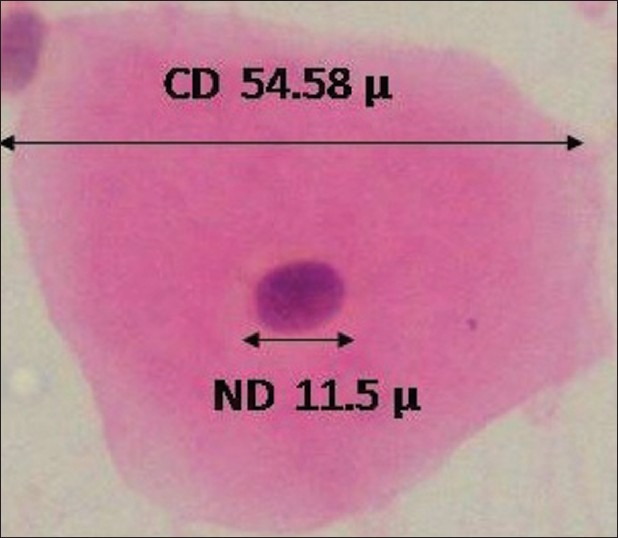
There was a statistically very significant increase in the average nuclear diameter (ND) [Table 1] and N/C [Table 2] ratio of the anemic group when compared to the control group [Figures 1 and 2]. The average cytoplasmic diameter (CD) did not show any statistical difference among the two groups.
Table 1.
Comparison of control and anemic groups with respect to ND mean (m)

Table 2.
Comparison of control and anemic groups with respect to the n/c ratio

Figure 1.

40×: A well-stained squame from cytological buccal smear of normal healthy individual stained with PAP showing cytoplasmic and nuclear diameters obtained by computerassisted cytomorphometry
Figure 2.

40×: A squame from cytological buccal smear of iron-deficient anemic individual stained with PAP showing cytoplasmic and nuclear diameters obtained by computerassisted cytomorphometry
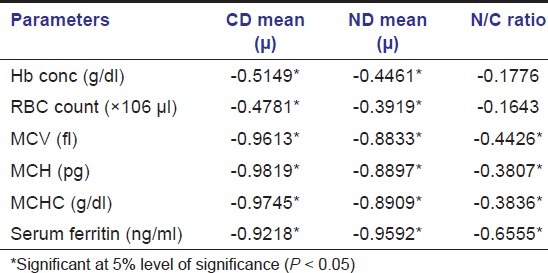
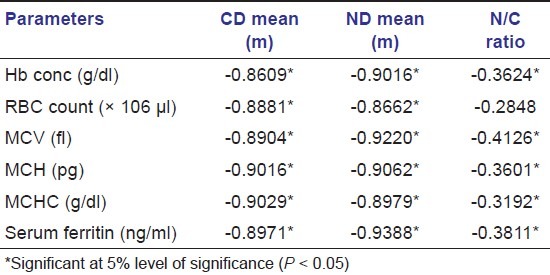
On comparison of the red blood cell parameters with the CD and ND values in iron deficiency anemia, positive correlation was found between the Hb%, RBC, MCV, MCH, MCHC, Ferritin levels, and CD and ND values, suggesting that the changes in these indices and serum ferritin levels may be related to the changes in the CD and ND [Tables 3 and 4].
Table 3.
Correlation between CD, ND, and ratio values with different parameters in the iron deficiency anemia group

Table 4.
Correlation between CD, ND, and ratio values with different parameters in the control group

Discussion
Iron deficiency anemia is a global problem of immense public significance affecting persons of all ages and economic group and has claims to be the commonest deficiency disease of the world.[5] Iron deficiency anemia develops when iron is insufficient for the formation of hemoglobin.[6] It is common in growing children, women of child bearing age, and pregnant women.[5] Oral manifestations of iron deficiency include pale mucosa, glossitis, angular stomatitis, burning sensation, hyperpigmentation, and postcricoid esophageal web.[7,8]
Though it is difficult to interpret the exact cause for increased nuclear diameter and nuclear/cytoplasmic ratio, it may be attributed to the following reasons:
Normal red cells can resist oxidative stress by several antioxidant defense systems. Red cells in iron deficiency have a decreased activity of essential antioxidant enzymes like glutathione peroxidase and catalase. This increases lipid peroxidation which is very leathal to the cells.
Growth and tissue repair depend on increased rates of cellular proliferation. Folic acid is required for the systhesis of thymidine and pyrimidine bases, while zinc participates at the catalytic site of DNA and RNA polymerases. Since folate, zinc, and iron have critical roles in regulation of DNA synthesis, these nutrients are considered as rate limiting factor for growth.
A variety of critically important enzymes containing iron are modulated by iron containing cofactors. These include aconitase, catalse, cytochrome C, cytochrome C reductase, cytochrome oxidase, succinic dehydrogenase, formimonotransferase, peroxidase, xanthine oxidase, and tryptophan pyrrolase.
Iron is needed for ribonucleotide reductase that reduces the sugar group of nucleotides to corresponding deoxy derivatives, the precursors of DNA. If this enzyme is decreased, DNA synthesis will be impaired with resultant alterations leading to the increase in nuclear diameter of exfoliated cells in iron deficiency anemia.[9]
Oral cytology provides a simple, relatively painless, noninvasive diagnostic test that is readily acceptable to both patients and clinicians alike.[10] Thus it is important to improve its sensitivity in detecting oral diseases. In the past, oral cytology has relied mainly on subjective interpretation, which showed a large number of false negative results.
Boddington MM in 1959 correlated buccal cells of iron deficiency anemia with the papillations on the tongue. There was a statistically significant increase in N/C ratio (P < 0.05). Metabolic defects of DNA cause increase in nuclear diameter of the buccal squamous cells in iron deficiency.[11] In our study there is an increase in ND and N/C ratio but not the CD. This may be due to the difference in the sample size and site of consideration.
Our study showed no statistical significance between CD and ND with respect to age and gender. This is in correlation with other study done by Macleod et al. in 1998.[12] Frost in 1977 proposed that normal CD is due to the less ability of the cytoplasm to mature with regard to the nucleoplasm in conditions such as iron deficiency anemia's leading to the altered N/C ratio.[13]
Hormones like estrogen and progesterone which promote anabolism and growth, increase at the time of puberty, and decrease as age advances. These hormones have a direct effect on the increase and decrease of cellular diameter and nuclear diameter in relation to age in both genders equally.
Age-related variation of ND, CD, and N/C ratio irrespective of gender can be ascribed to cellular senescence. The renewal capacity of the basal cells declines as age advances resulting in the accumulation of senescent cells, which has the effect of various environmental factors resulting in increased ND and N/C ratio.[14]
Gururaj et al. in 2004 reported that there is a significant increase of CD, ND, and N/C ratio in anemic patients when compared with control group.[9] Similar results were observed in the present study which showed a significant increase in the mean nuclear diameter (ND) and N/C ratio among the anemic group when compared to the healthy controls, but mean cytoplasmic diameter (CD) results were normal. The difference in CD may be due to application of different methods of measurement and difference in the gender proportions included in the study.
With advancements in the field of quantitative oral exfoliative cytology, interest in oral cytology has once again emerged in the diagnosis of oral lesions.[15] Computer-assisted morphometric analysis of exfoliative cytology specimens has improved the ability to accurately measure various cell parameters.[16]
Conclusion
The findings obtained from the study were encouraging in estimation of CD, ND, and N/C ratio by the cytomorphometric computerized image analysis technique. This can be a prospective, noninvasive diagnostic tool for the clinicians to screen iron deficiency anemia patients. Further studies should be conducted in larger cohort samples for assessing the sensitivity and specificity of this technique in determining the diagnostic significance.
Footnotes
Source of Support: Nil
Conflict of Interest: None declared.
References
- 1.Rajendran R. Shafer's text book of oral pathology. 6th ed. Philadelphia: Elsevier; 2009. Diseases of the blood and blood forming organs: Shafer, Hine, Levy; pp. 754–5. [Google Scholar]
- 2.Lain ES. Lesions of the oral cavity caused by physical and physicochemical factors. Arch Derm Syphilol. 1940;41:295–307. [Google Scholar]
- 3.Lozoff B, Corapci F, Burden MJ, Kaciroti N, Angulo-Barroso R, Sazawal S, et al. Preschool aged children with iron deficiency anemia show altered affect and behavior. J Nutr. 2007;13:683–9. doi: 10.1093/jn/137.3.683. [DOI] [PMC free article] [PubMed] [Google Scholar]
- 4.Brugnara C. Diagnostic approaches for iron deficiency and erythropoiesis. Clin Chem. 2003;10:1573–8. doi: 10.1373/49.10.1573. [DOI] [PubMed] [Google Scholar]
- 5.Lokeshwar MR, Mehta M, Mehta N, Shelke P, Babar N. Prevention of Iron deficiency anemia: How far have we reached? Indian J Pediatr. 2010;78:593–602. doi: 10.1007/s12098-010-0130-1. [DOI] [PubMed] [Google Scholar]
- 6.Baynes RD, Bothwell TH. Iron deficiency. Annu Rev Nutr. 1990;10:133–48. doi: 10.1146/annurev.nu.10.070190.001025. [DOI] [PubMed] [Google Scholar]
- 7.Okamura H, Tsutsumi S, Inaki S, Mori T. Esophageal web in plummer-vinson syndrome. Laryngoscope. 1988;98:994–8. doi: 10.1288/00005537-198809000-00014. [DOI] [PubMed] [Google Scholar]
- 8.Darby WJ. The oral manifestations of iron deficiency. J Am Med Assoc. 1946;130:830–5. doi: 10.1001/jama.1946.02870130004002. [DOI] [PubMed] [Google Scholar]
- 9.Gururaj N, Sivapathasundharam B, Sumathy N. Cytological findings in iron deficiency anemia. Indian J Dent Res. 2004;15:126–8. [PubMed] [Google Scholar]
- 10.Mehrotra R, Gupta A, Singh M, Ibrahim R. Application of cytology and molecular biology in diagnosing premalignant or malignant oral lesions. Mol Cancer. 2006;5:11. doi: 10.1186/1476-4598-5-11. [DOI] [PMC free article] [PubMed] [Google Scholar] [Retracted]
- 11.Boddington MM. Changes in buccal cells in the anemias. J Clin Pathol. 1959;12:222–7. doi: 10.1136/jcp.12.3.222. [DOI] [PMC free article] [PubMed] [Google Scholar]
- 12.Macleod RI, Hamilton PJ, Soames JV. Quantitative exfoliative oral cytology in iron deficiency anemia and megaloblastic anemia. Anal Quant Cytol Histol. 1998;10:176–80. [PubMed] [Google Scholar]
- 13.Frost JK. Comprehensive cytopathology. 2nd ed. Philadelphia: W.B. Saunder's Company; 1997. Pathologic processes affecting cells from inflammation to cancer; p. 845. [Google Scholar]
- 14.Anuradha A, Sivapathasundharam B. Image analysis of normal exfoliative gingival cells. Indian J Dent Res. 2007;18:63–6. doi: 10.4103/0970-9290.32422. [DOI] [PubMed] [Google Scholar]
- 15.Ramaesh T, Mendis BR, Ratnatunga N, Thatti RO. Cytomorphometric analysis of squames obtained from normal oral mucosa and lesions of oral leukoplakia and squamous cell carcinoma. J Oral Pathol Med. 1998;27:83–6. doi: 10.1111/j.1600-0714.1998.tb02099.x. [DOI] [PubMed] [Google Scholar]
- 16.Ramaesh T, Mendis BR, Ratnatunga N, Thatti RO. Diagnosis of oral premalignant and malignant lesions using cytomorphometry. Odontostomatol Trop. 1999;85:23–8. [PubMed] [Google Scholar]


