

Abstract
In this study, we investigated the effects of membrane cholesterol content on the mechanical properties of cell membranes by using optical tweezers. We pulled membrane tethers from human embryonic kidney cells using single and multi-speed protocols, and obtained time-resolved tether forces. We quantified various mechanical characteristics including the tether equilibrium force, bending modulus, effective membrane viscosity, and plasma membrane-cytoskeleton adhesion energy, and correlated them to the membrane cholesterol level. Decreases in cholesterol concentration were associated with increases in the tether equilibrium force, tether stiffness, and adhesion energy. Tether diameter and effective viscosity increased with increasing cholesterol levels. Disruption of cytoskeletal F-actin significantly changed the tether diameters in both non-cholesterol and cholesterol-manipulated cells, while the effective membrane viscosity was unaffected by F-actin disruption. The findings are relevant to inner ear function where cochlear amplification is altered by changes in membrane cholesterol content.
Introduction
Cell membranes are composite structures containing lipids, proteins, carbohydrates, and other molecules. Cholesterol is an abundant lipid component of the plasma membrane of eukaryotic cells, accounting for up to 50 mol% of membrane lipids.1, 2 It modulates the activities of membrane associated proteins, such as the kinetics of current activation in voltage-gated chloride channel CIC-2,3 current intensity in inwardly rectifying K+ channels,4 and function of G-protein-coupled receptors.5 Cholesterol also affects membrane lipid organization,1, 6 and distribution of transmembrane proteins such as prestin in outer hair cells within the cochlea.7 Cholesterol is also a key component of lipid rafts, and the related caveolae, which are involved in signal transduction, and endocytosis.8-10
Numerous studies have been conducted to investigate the effects of cholesterol on both non-biological and biological membranes. In non-biological membranes, the number of saturated hydrocarbon chains in the lipids affects the membrane thickness and membrane bending modulus.11, 12 Specifically, membrane bending modulus increases with added cholesterol in lipids with two saturated chains such as 1,2-dimyristoyl-sn-glycero-3-phosphocholine lipids.13 However, when both chains are monounsaturated as in 1,2-dioleoyl-sn-glycero-3-phosphocholine and 1,2-dierucoyl-sn-glycerol-3-phosphocholine lipids, the bending modulus remains unchanged for cholesterol mole fractions up to 0.4.13 In giant bilayer vesicles, the bilayer cohesion increases with added cholesterol only for lipids in which both chains are saturated or monosaturated. Specifically, the area expansion modulus of stearoyloleoylphosphatidylcholine type of lipids is reported to increase by six times with addition of cholesterol up to 58 mol%.14
In contrast to non-biological membranes, the presence of the cytoskeleton in living cells, gives rise to a composite plasma membrane-cytoskeleton structure which is absent in synthetic vesicles. The cytoskeleton provides the cell with internal organization, and mechanical rigidity.15 Plasma membrane mechanics as well as the mechanical association of membrane with cytoskeleton are important factors that influence cell shape. Examples of biologically important shape changes are deformation of erythrocytes in capillaries, electromotility of outer hair cells (OHCs), cell division, phagocytosis, pseudopodium and dendritic spine formation. Mechanical properties of the cell membrane may be altered by modulation of the plasma membrane cholesterol content. In vitro analysis of human neutrophils with elevated membrane cholesterol content showed increased probability of firm arrest during rolling over a P-selectin coated surface.16 Neutrophil-bead collision experiments conducted with higher membrane cholesterol levels resulted in greater cell deformation during the collision, increased probability of tether formation and longer tethers compared to controls. Similar experiments conducted under cholesterol depletion conditions decreased the probability of firm arrest and formation of tethers, and produced shorter tethers.17 Studies on endothelial cells with micropipette aspiration technique showed that decreased membrane cholesterol resulted in a significant increase in the stiffness of the composite membrane-cytoskeleton in bovine aortic endothelial cells. However cholesterol enrichment had no significant effect on the stiffness.18 In another study on the same cells, membrane tether formation experiments indicated stronger membrane-cytoskeleton association in cholesterol depleted cells, and weaker associations upon cholesterol enrichment.19 Recently, a nano-indentation technique was used to measure the local nano-mechanical properties of the cell plasma membrane.20 The results of that study indicate decreased membrane stiffness of the lamellipodium of the fixed NIH-3T3 fibroblast cells under cholesterol depleted conditions, where cholesterol restoration reversed the effects of cholesterol depletion on membrane stiffness and cellular morphology.
We have shown that high cholesterol levels result in auditory dysfunction while low levels of cholesterol appear to improve performance in animal studies.7, 21 In vivo cochlear function analysis revealed that cochlear cholesterol loading/depletion affected the production of distortion product otoacoustic emissions in mice.7 Cholesterol depletion was associated with dramatic increase in cochlear electromotility of guinea pigs.21 Electromotility originates within the plasma membrane of OHCs in the cochlea, and is responsible for sensitivity and frequency tuning of mammalian hearing. In parallel with the in-vivo studies, we demonstrated that changes in the membrane cholesterol content modulate the membrane associated charge movement in single OHCs.7 In response to membrane cholesterol depletion and cholesterol loading, the peak voltage of nonlinear membrane capacitance shifted to depolarized and hyperpolarized voltages, respectively, in both OHCs and human embryonic kidney (HEK) cells expressing the transmembrane protein prestin.22
In this study, we use optical tweezers to pull cell plasma membrane nanotubes (tethers) from HEK293 cells, and investigate the effects of membrane cholesterol on membrane mechanical properties by analyzing time-resolved tether force. Membrane tethers are formed by grasping a part of the cell surface and pulling it away from the cell, using optically trapped microspheres as handles.23-25 We use the HEK cell line as a model system for cholesterol manipulation, consistent with our previous work where these cells were used to investigate the effects of cholesterol on membrane capacitive properties.22 We also present results for F-actin disrupted cells to establish the role of F-actin on plasma membrane mechanical properties, and discern if mechanical properties of the membrane in F-actin disrupted cells are also affected by membrane cholesterol levels.
Experimental
Cell Culture
HEK293 cells (ATCC, CRL-1573, Manassas, VA) were seeded in Dulbecco’s modified eagle medium (DMEM, Gibco, Grand Island, NY) with 10% fetal bovine serum (FBS, Invitrogen, Grand Island, NY) and 1% Penicillin/Streptomycin (Gibco). Cells were incubated in an air jacketed CO2 incubator (NuAire, Plymouth, MN) at 37°C with 5% CO2. When the cells became 70-80% confluent, they were passaged into glass bottom poly-d-lysine coated MatTek plates (P35GC-1.0-14C). Cells of medium size (population distribution: 10-20 μm in diameter) were selected for measurements if they were firmly attached to the bottom of the Petri dish. All experiments were performed within 30-45 minutes of removal of cells from the incubator.
Plasma membrane cholesterol manipulation
A commonly used method to modify the membrane cholesterol content is incubation of cells with cyclodextrins.26 Cells were incubated in DMEM containing 3 and 5 mM methyl-β-cyclodextrin (MβCD) (Sigma-Aldrich, St Louis, MO) for cholesterol depletion. We used water-soluble cholesterol with MβCD as a vehicle (51 mg of cholesterol per one gram of cholesterol-MβCD) (Sigma-Aldrich) for cholesterol enrichment. Specifically, cells were incubated in DMEM containing 3 and 5 mM MβCD in water-soluble cholesterol (cholesterol-MβCD) for cholesterol enrichment. Incubation time was 30 minutes at 37°C and 5% CO2 in both cholesterol depletion and cholesterol enrichment experiments.7
Plasma membrane cholesterol quantification
We assumed the membrane cholesterol concentrations for each cholesterol modulation condition to be the same as those reported in our previous report.22 In that study, membrane cholesterol content for control and cholesterol manipulated HEK cells was quantified using the Amplex Red Cholesterol Assay. Briefly, this colorimetric assay is based on the reaction of cholesterol with cholesterol oxidase to yield H2O2, which can be detected using the Amplex Red reagent.
Cell cytoskeleton F-actin disruption
We used Latrunculin A dissolved in DMSO (EMD Chemicals, Gibbstown, NJ) as an F-actin disrupting reagent.27 F-actin disruption was performed after each type of cholesterol modulation and prior to tether pulling experiments. Specifically, cells were incubated in DMEM and then Latrunculin A solution was added to DMEM to a final concentration of 2 μM Latranculin A. Cells were incubated with Latrunculin A for 15 minutes at 37°C and 5% CO2.
Optical tweezers, displacement measurements, and calibration
We used an infrared Nd:YVO4 diode-pumped solid state laser (1064 nm, Prisma-1064-8-V, Coherent, Santa Clara, CA) to create the optical tweezers. The optical tweezers setup consisted of an inverted microscope (Nicon Eclipse Ti-DH, Melville, NY) containing a 100X oil immersion objective with a high numerical aperture (NA=1.49) (Nikon, Apo TIRF) through which the laser beam passed and converged to form an optical trap. The laser beam was expanded prior to entering the microscope to fill the back aperture of the microscope objective.
We optically trapped 4 μm diameter sulfate-modified fluorescent polystyrene microspheres (beads) (F-8858, Molecular probes, Eugene, OR), and used them as handles to pull membrane tethers from cells. The excitation spectrum of the fluorescent beads is between 480 and 590 nm with maximum fluorescence emission at 605 nm. Light from a mercury source (Nikon, Intenslight, C-HGFI) was passed through a filter set (Nikon, TRITC, TE 2000) to illuminate the trapped bead. The filter set included an excitation filter (525-560 nm), a dichroic mirror which reflected the excitation light into the objective to illuminate the trapped bead, and an emission filter (570-620 nm) which transmitted the emitted fluorescent light from bead. An emission bandpass filter (Chroma, 605±25 nm, Brattleboro, VT) was placed in front of a position-sensing quadrant photodetector (QPD) (QP50-6SD; Pacific silicon sensor, Westlake village, CA) to specifically select the fluorescent emission from the bead.
The fluorescent image of the trapped bead was projected onto the center of QPD to measure the displacement of the bead from the trapping center. Using an analog-to-digital converter (Wavebook 521; IOTEch, Cleveland, OH), the sum-and difference output signals (in mV) from the QPD amplifier were digitized and subsequently recorded by WaveView software (WaveView 7.14.16; IOTech, Norton, MA). Data collection frequency was 66.66 Hz. A charge-coupled device (CCD) camera (Hamamatsu Corp., EM-CCD, C9100/13, Bridgewater, NJ) was used to visualize the objects in the field of view.
The QPD signal represented the displacement of the bead position from the trapping center, which is proportional to an external force such as the tethering force experienced by the bead. The external force was calibrated for the output voltage signal of the QPD by the viscous drag force method utilizing Stokes’ Law.28 In this method, a known drag force was applied to the trapped bead while recording the resulting differential signal from the QPD. The drag force was generated by driving a piezoelectric translation-stage (PZT) (Physik Instrumente, Model P-527.C3, Waldbronn, Germany) at known velocities. The resolution of the piezoelectric stage was 10 nm in x and y directions, and 2 nm in z directions (laser beam propagation direction). The applied force was linearly fit to the output voltage of the QPD. In this study, calibration and force measurements were performed at laser power of 350 mW after the microscope objective. There was no evidence of thermally induced structural damages in the living cells at this power. The relationship between the bead displacement and QPD signal was determined by moving a bead immobilized on the coverslip by known displacements with the PZT while recording the QPD voltage signal. There was a linear relationship between bead displacement and QPD output signal.
Static tether force
A HEK cell that was firmly attached to the bottom of the Petri dish was brought into contact with an optically trapped bead by moving the PZT. After 5-10 seconds contact time, the cell was moved away by the PZT at the rate of 1 μm/s to form the plasma membrane tether. Once a tether was formed, we continued to move cell away at 1 μm/s until the tether was elongated to a desired length (10, 15 and 20 μm). Once the tether reached the desired length, laser power was then decreased gradually until the tether force exceeded the strength of the optical trap, causing the bead to escape the trap and rapidly return towards the cell. We recorded the laser power when the bead escaped, and converted the power to force via a calibration.29
Dynamic tether force measurements: single-speed pulling protocol
After a bead was trapped, a cell which was firmly attached to the bottom of the Petri dish was identified and moved towards the bead until they were separated by ≈4 μm. Then the PZT was triggered to move the cell toward the trapped bead at 1 μm/s to bring them into contact. The bead and cell were in contact for 5-15 seconds to achieve plasma membrane-bead attachment. The cell was subsequently moved away from the bead at 1 μm/s, resulting in separation of the plasma membrane from the underlying cytoskeleton to form a long, thin cylindrical membrane tube. When the tether was elongated by 20 μm, the PZT was subsequently stopped. The tether was maintained at this length and the relaxation of the tether force was recorded (see Fig. 1 for example of the procedure).
Fig. 1.
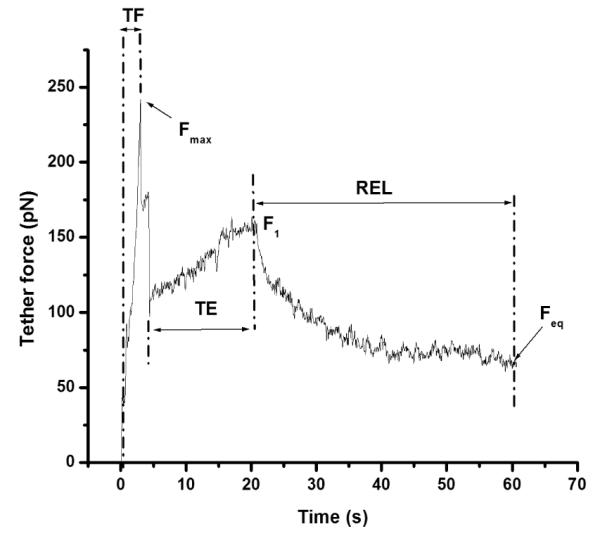
Typical temporal plasma membrane tether force plot for a HEK cell in response to a single-speed pulling protocol. Force plot shows tether formation (TF), tether elongation (TE), and tether force relaxation (REL) regions. Tether is formed and elongated at a constant pulling rate of force, 1μm/s to 20μm. Fmax-maximum tether force, Feq-equilibrium tether F1-tether force at the end of elongation.
Dynamic tether force measurements: multi-speed pulling protocol
We used a multi-speed tether pulling protocol to determine the membrane effective viscosity. In this protocol, once a plasma membrane tether was formed, it was subsequently elongated at 1 μm/s for 10 seconds, followed by 2 μm/s pulling rate for three seconds, 3 μm/s for three seconds, and 4 μm/s for four seconds.
All tether pulling experiments were done using the PZT stage, which provided a controlled fine movement to avoid impulsions throughout the bead-cell contact, tether formation, and tether elongation processes in our experiments. The initial bead-cell contact was detected by fluorescent microscopy. Using fluorescent microspheres, we were able to control the initiation of microsphere–plasma membrane physical contact by observing the appearance of a non-zero QPD differential output voltage deviation from an initial zero value (indicating bead-cell contact and plasma membrane reactive forces), rather than attempting to visually observe and estimate the contact.
Membrane tether imaging
Membrane tethers were imaged in order to estimate tether diameters. For this purpose, we used the single-speed tether pulling protocol. Once tether forces reached their equilibrium values, tethers were illuminated in bright-field, and imaged by the CCD camera. Multiple (100 frames) images of the same tether were averaged, and then the background image was subtracted from the final averaged image to eliminate background noise. The background image was an image of the field of view without the cell and trapped bead. We used MATLAB Image Processing Toolbox (R2010b, The Mathworks, Natick, MA) for image processing including image averaging and background subtraction. The tether diameter was estimated from the background subtracted image using ImageJ (1.44p, National Institute of Health, USA). We calibrated the transverse (x and y) planes by measuring known distances in the x and y directions. For this purpose, we used a microruler with 20 μm spacing. The calibration yielded 0.16 μm per pixel in both directions.
F-actin staining
We used fluorescein isothiocyanate (FITC) labeled phalloidin (Phalloidin-FITC,Sigma-Aldrich) as cytochemical marker of polymerized actin. Tethers were pulled according to the single-speed pulling protocol. Once the tether force reached its equilibrium value, the bead was immobilized by lowering the axial position of the optical trap with the PZT until the bead came in contact with the glass surface at the bottom of Petri dish. The cells were then immediately fixed with PBS-paraformaldehyde 4% for 15 minutes, treated with PBS-triton X100 0.2% for five minutes, blocked with PBS-5% BSA for 30 minutes, and incubated for one hour with PBS-phalloidin-FITC 1 μM to stain F-actin.30 Fluorescent emission from stained F-actin was filtered using FITC filter set (Nikon, FITC). Images were subsequently acquired by the CCD camera with 100X optical microscope, and analyzed with ImageJ software.
Statistical analysis
We performed the statistical analysis of the data using a standard two-sample Student’s t-test with unknown variances of the two data sets. Statistical significance was accepted if the P-value was <0.05.
Results and discussion
Dynamic plasma membrane tether force
A typical dynamic tether force plot exhibits three different regions with respect to time (Fig. 1): (1) tether formation process which starts from the onset of pulling, reaching the maximum tether force (Fmax), followed by a sudden reduction in force; (2) tether elongation, which begins after the reduction in Fmax and continues until the desired tether length is reached. We refer to the force value obtained at the end of tether elongation as Fl; and (3) tether force relaxation, which starts once the tether elongation is halted, and continues until the force reaches an equilibrium value (Feq).
The force profile shown in Fig. 1 was obtained from a cholesterol-depleted HEK cell by incubating the cells in DMEM containing 5 mM MβCD for 30 minutes. In this figure, Fmax was ≈240 pN, and then the tether force dropped to ≈100 pN. This sudden force drop after reaching the maximum force value indicates the separation of the plasma membrane from cytoskeleton.29 At the end of the tether elongation, the tether force reached a value of Fl ≈160 pN. Finally, at the end of the relaxation, the Feq was ≈70 pN. We sometimes observed a secondary spike during the tether formation. This type of response may be due to additional membrane pulled off from the cell after the initial tether formation.29
Plasma membrane tether equilibrium forces (Feq)
30 The application of an external pulling force on lipid vesicles and living cell membranes can result in tether formation, depending on the value of the pulling force and the adhesion strength to the substrate.31 When a tether is formed and elongated, the stretched membrane induces lateral tension within the cell body plasma membrane that draws more membrane into the tether. The tether equilibrium force is a measure of the tension in the plasma membrane tether balanced against that within the cell body, and represents a zero net flow of membrane components into the tether.32
The mean±s.d. values of Feq for control HEK cells were 39±12 pN (n=11) (Fig. 2). The respective mean±s.d. value of the membrane cholesterol concentration for control cells is 7.5±0.8 pmol/μg of protein. Mean value of Feq increased in response to lowering the membrane cholesterol content, and decreased upon elevation of the membrane cholesterol in cells with intact F-actin. Specifically, the Feq value significantly increased to 66±16 (n=10) and 74±17 (n=11) (P<0.05) when cells were incubated in DMEM containing 3 and 5 mM MβCD for cholesterol depletion, respectively. The respective membrane cholesterol concentrations are 6.6±0.3 and 5.7±0.8 pmol/μg of protein when cells were incubated in DMEM containing 3 and 5 mM MβCD. In response to incubating the cells with intact F-actin in DMEM containing 3 and 5 mM cholesterol-MβCD for cholesterol enrichment, Feq significantly decreased to 25±8 (n=8) and 19.5±5 (n=6), respectively (P<0.05), where the respective membrane cholesterol concentrations are 14.5±1.9 and 17.3±0.6 pmol/μg of protein.
Fig. 2.

Plasma membrane tether equilibrium forces versus plasma membrane cholesterol concentration for HEK cells with intact and disrupted F-actin.
The fact that the equilibrium forces does not reach zero is indicative of a resistance to membrane flow from the cell body into the tether.24 Higher equilibrium forces are associated with more resistance to membrane flow, whereas lower tether equilibrium forces suggest lower resistance. The resistance could be in the form of plasma membrane-cytoskeleton adhesion and our further observations of significant decrease in Feq upon F-actin disruption supports this hypothesis.
In order to study the effects of cell cytoskeleton on tether equilibrium force, experiments were repeated in the presence of Latrunculin A, which affects the polymerization of F-actin. Specifically a 1:1 molar complex between Latrunculin A and G-actin forms, which lowers the available amount of free G-actin and disrupts the equilibrium between G- and F-actin.33
In control cells, the tether equilibrium forces significantly decreased from 39±12 to 24±7 pN (n=13) upon F-actin disruption (P<0.05). This reduction in Feq suggests the dissociation of the plasma membrane from the cytoskeleton following application of Latrunculin A as illustrated previously with other cells,34-36 and subsequently more flow of the membrane from the cell body into the tether. Similarly, disruption of F-actin in cells incubated in DMEM containing 5 mM MβCD for cholesterol depletion resulted in a significant decrease in Feq from 74±17 to 26±4 pN (n=7) compared to cells with intact F-actin receiving the same cholesterol depletion (P<0.05). The mean±s.d. values of Feq obtained after F-actin disruption for cells incubated in 5 mM MβCD-cholesterol for cholesterol enrichment were 17±2 pN (n=6). Since there was no statistically significant change in Feq between intact and F-actin disrupted cells under cholesterol enriched condition, cholesterol enrichment may have already had a weakening effect on the plasma membrane-cytoskeleton adhesion.
Plasma membrane tether diameter
In Fig. 3, we present images of the bead-tether-cell assembly for intact F-actin and F-actin disrupted cells with and without cholesterol manipulation. Cells were incubated in DMEM containing 5 mM cholesterol-MβCD and 5 mM MβCD for cholesterol enrichment and cholesterol depletion, respectively.
Fig. 3.
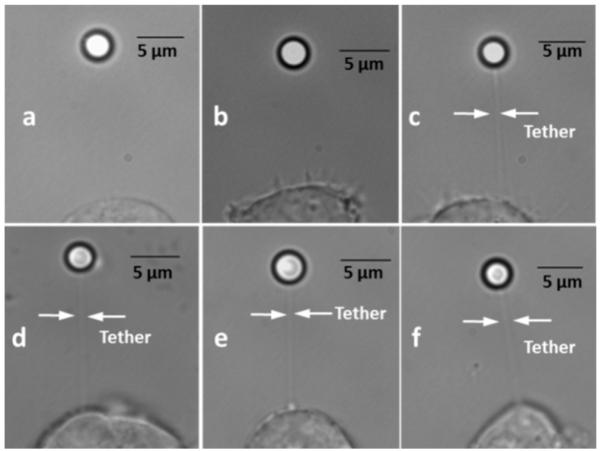
Bright-field photomicrographs of HEK cell–membrane tether–bead assembly for cells with intact F-actin (a, b, c) and disrupted F-actin (d, e, f). The (b, e) images represent non-cholesterol manipulated cells. The (a, d) images represent the photomicrographs under cholesterol depletion (5.7 pmol/μg protein), and (c, f) represent the cholesterol enrichment condition (17.3 pmol/μg protein).
The mean±s.d. values of tether diameter (dtether) were 290±40 nm for control HEK cells (n=5) and significantly increased to 640±90 nm (n=7) in response to cholesterol enrichment (P<0.05). Under cholesterol depleted conditions, tethers were not optically resolvable since their diameters were below the optical resolution limit of the imaging system. Disruption of the F-actin significantly changed dtether in both control cells and cholesterol-manipulated cells. Specifically, the mean±s.d. values of dtether in control cells and cholesterol enriched cells increased to 732±76 nm (n=8) and 890±72 nm (n=5) upon disruption of F-actin, respectively. Membrane tethers were visible with the diameter of 720±92 nm (n=5) in F-actin disrupted and cholesterol depleted cells.
Measurements of tether diameter provide information on the amount of membrane which is liberated from the cell into the tether. The amount of the membrane flow can be modulated by membrane-cytoskeleton interactions in a manner that tighter interactions can cause less membrane to be liberated, resulting in thinner tethers, whereas looser interactions are associated with formation of thicker tethers. The strength of the interactions between the membrane and the cytoskeleton may be manifested in different cell types. For example, the reported diameter of tethers in neuronal growth cones,37 and human mesehnchymal stem cells38 are 420 and 400 nm, respectively, whereas tethers formed from OHCs-known by their firm membrane-cytoskeleton attachment- are not-visible by bright field microscopy.39
In the present study, we show that the membrane tether diameter varies with cholesterol content. Tethers formed from HEK cells became invisible-below the optical diffraction limit of the imaging system-upon cholesterol depletion. However, cholesterol enrichment resulted in a statistically significant increase in the tether diameter by 2.2-fold. The decreasing trend in tether diameters upon cholesterol depletion, and an increasing trend upon enrichment suggest stronger adhesion between the membrane and cytoskeleton in the depleted condition, and weaker adhesion upon enrichment conditions. Moreover, our tether diameter analysis revealed that increases in the equilibrium forces under cholesterol depleted condition were accompanied by decreases in tether diameters. Similarly, the lower equilibrium forces in cholesterol enriched cells were associated with larger tether diameters. We have observed a similar correlation between tether diameter and tether equilibrium force in whole cell voltage-clamped HEK cells39. In those experiments, HEK cells with greater tether diameters had a smaller equilibrium tether force than OHCs with smaller tether diameters.
Membrane bending modulus
To understand the effects of membrane cholesterol concentration on membrane bending modulus, we estimated the bending modulus (B) based on the following equation:37, 40, 41
| (1) |
where dtether is tether diameter. This equation is derived with the assumption of equilibrium condition in the system, in which the tether length and tether radius both are at their equilibrium values.42 We use Feq and the tether diameter values once force relaxation is reached to satisfy the equilibrium condition.
Using Feq≈39 pN and dtether≈290 nm, we estimate the mean value of B to be ≈9×10⁻¹⁹ J for control HEK cells. Reported values of B for biological membranes are in the range of 10−20-10−18 J 30, 43, 44, and our estimation lies within this range. Under cholesterol enrichment conditions and at the upper extreme of membrane cholesterol concentration, the bending modulus is estimated to be ≈9.9×10⁻¹⁹ J. Although tethers were not optically resolvable under cholesterol depleted conditions, we estimate B at ≈ 8.8×10⁻¹⁹ J at the lower extreme of membrane cholesterol concentration, assuming a tether diameter of 150 nm (i.e., a diameter at optical resolution limit). The results show that B is almost independent upon the cholesterol concentration within the cholesterol concentration range examined.
Plasma membrane-cytoskeleton adhesion energy per unit area (W)
The plasma membrane-cytoskeleton adhesion energy per unit area (W) is a measure of membrane-cytoskeleton adhesion strength, and can be measured once the membrane tether equilibrium force and the tether diameter are known. We measured W by the following equation:45, 46
| (2) |
Given Feq≈39 pN and dtether≈290 nm, we estimate W to be ≈21×10−18 J/μm2 for control HEK cells (Fig. 4). This value is close to ≈30 ×10−18 J/μm2 reported for neutrophils,47, 48 and 40 ×10−18 J/μm2 for molluscan neurons.49 Enriching the cholesterol content of the membrane decreased W by 75% to 5×10⁻¹⁸ J/μm2 while cholesterol depletion increased it to ≈70×10−18 J/μm2 (both at the extreme cholesterol concentrations). Higher values of W upon cholesterol depletion indicate stronger membrane-cytoskeleton adhesion under cholesterol depleted conditions, while lower W values in response to cholesterol enrichment indicate weaker plasma membrane-cytoskeleton adhesion.
Fig. 4.

Plasma membrane-cytoskeleton adhesion energy per unit area versus membrane cholesterol concentration for HEK cells with intact and disrupted F-actin cells. Inset shows plasma membrane tether diameter estimates for HEK cells with intact and disrupted F-actin versus membrane cholesterol concentration in pMol/μg protein.
Multi-speed tether pulling: tether effective viscosity (ηeff)
In Fig. 5, we present the membrane tether force measured in response to the multi-speed pulling protocol. Total elongation time and total tether length were 20 seconds and 41 μm, respectively.
Fig. 5.

Typical temporal plasma membrane tether force plot for a HEK cell in response to multi-speed pulling protocol. This plot is for a HEK cell incubated in 5 mM MβCD-cholesterol for 30 minutes in order to elevate the membrane cholesterol content. The initial negative value of the force before the beginning of tether pulling results from the cell pushing the bead in a direction opposite to that of the stage movement. Inset shows single exponential curve fit to the 3rd segment of membrane tether force profile. R2=0.95 for this pulling rate, and >0.89 for other pulling rates (data not shown).
During each pulling interval, the membrane tether force increased exponentially and approached a specific steady-state value (Fss). The exponential increase in membrane tether force at an increasing pulling rate was first reported in our previous publication.29 We fit the data for different pulling rates to exponential functions and obtained an estimate of Fss for each pulling rate. The inset in Fig. 5 presents the curve fitting result to the measured forces for pulling rate of 3 μm/s. Values of Fss at each pulling rate were subsequently used to determine the effective viscosity (ηeff) of the membrane tether as:37
| (3) |
where Vpull is pulling rate, Fss(0) is the steady-state force at zero pulling rate, and ηeff is the membrane tether effective viscosity.
In Fig. 6A, we present illustrative values of Fss as a function of Vpull based on the data shown in Fig. 5. There is a linear relationship between Fss and Vpull in the range of the utilized pulling rates where the slope of the line is divided by 2π to estimate ηeff. The mean±s.d. values of ηeff for control HEK cells were 2.6±1 pN.s/μm (n=13). Higher membrane cholesterol content increased ηeff, while lowering the membrane cholesterol content showed a tendency to reduce ηeff. Specifically, the mean±s.d. values of ηeff were 3.2±0.85 (n=7) and 3.6±0.73 pN.s/μm (n=10) for cells incubated in DMEM containing 3 and 5 mM cholesterol-MβCD for cholesterol enrichment, respectively. The mean±s.d. value of ηeff was 2.24±0.44 pN.s/μm (n=8) for cells incubated in DMEM containing 3 mM MβCD for cholesterol depletion (Fig. 6B). The measured 3.6±0.73 value of ηeff in cholesterol enriched cells was significantly different from those of control cells and cholesterol depleted cells (P<0.05). We could not determine ηeff under cholesterol depletion when cells were incubated in DMEM containing 5 mM MβCD since those tethers were broken at lengths greater than 25 μm and pulling velocities higher than 3 μm/s. Values of ηeff reported in this paper are in the range for OHCs (2.39-5.25 pN.s/μm),29 neutrophils (1.8 pN.s/μm),50 and endothelial cells (0.5 pN.s/μm).19 These values are orders of magnitude higher than those reported for lipid vesicles which lack a “cytoskeleton”. For example, values of 5 to 13 ×10−3 pN.s/μm for vesicles from egg phosphatidylcholine diluted in hexane,51, 52 and 0.071 pN.s/μm for bilayer vesicles made from a 1:1 mixture of bovine brain sphingomyelin and cholesterol have been reported.53 The mean±s.d. value of ηeff in F-actin disrupted control cells was 2.54±0.92 pN.s/μm (n=11). Similar to control cells, disruption of F-actin did not result in a significant change in the values of ηeff when compared under the same cholesterol manipulation (Fig. 6B).The observation that ηeff is unchanged in response to F-actin disruption supports the observation that there is no F-actin in the tethers in our experiments (supporting information).
Fig. 6.

(A) Steady-state membrane tether forces linearly fit to their corresponding pulling rates for the membrane force plot shown in Fig. 5. (B) Membrane tether effective viscosities versus membrane cholesterol concentrations for HEK cells with intact and disrupted F-actin.
The tether effective viscosity represents the overall viscosity from three viscous sources, surface viscosity in each monolayer and the viscous slip between each of the monolayers. The third component of effective viscosity is viscous slip of the inner monolayer membrane over the cytoskeleton. Our tether equilibrium force measurements indicate weaker plasma membrane-cytoskeleton adhesion in F-actin disrupted cells. The unchanged effective viscosity upon F-actin disruption suggests that surface viscosity in each monolayer and the viscous slip between each of the monolayers have greater impact than the viscous slip of inner monolayer over the cytoskeleton at least within cholesterol concentration range examined.
Our observations are consistent with previous plasma membrane tether pulling studies on neuronal growth cones in which the apparent membrane tensions were significantly decreased upon disruption of F-actin with Cytochalasins B and D, whereas effective membrane viscosity was not significantly decreased in those measurements.37 The authors suggest that cytochalasins could weaken the associations of integral membrane proteins with the cytoskeleton, specifically β1 integrins in neuronal growth cones.54 Also, the application of Latrunculin A resulted in unchanged membrane effective viscosity in human brain tumor cells,35 consistent with our observations in HEK cells.
Lipid flow from cell body plasma membrane into the tether
It has been shown that gradient of surface tension between two vesicles connected by a lipid nanotube results in a two-step transport within the connecting tether.55 In the early stage, the surface tension gradient establishes rapidly along the tube giving rise to a Marangoni transport of lipids through the tether while the tube radius remains constant. This stage is followed by a slower stage where the tether progressively equilibrates its shape until it reaches an equilibrium radius. In our experiments, the plasma membrane tether force relaxation (REL region in Fig. 1) also shows a biphasic nature representing two time constants, consistent with the observations on lipid vesicles nanotubes, and our previous reports with living cell plasma membranes in HEK cells25 and OHCs.24 A single exponent decay does not fit the rapid force reduction occurring at the first stage of force relaxation whereas a bi-exponent model fits the complete force relaxation profile (Fig. 7). Between the two force relaxation time constants obtained by bi-exponent model, the shorter relaxation time constant (τshort) reflects the Marangoni transport and lipid reorganization within the tether occuring at the beginning of force relaxation once the elongation is stopped. We estimated τshort as 1.2±0.45 s for normal cells, and it remained unchanged by cholesterol modulation, indicating that cholesterol did not alter this process in our experiments within cholesterol concentration range examined. The longer relaxation time constant (τlong) represents the rate at which membrane tether equilibrates its radius wherein the membrane components flow from the cell into the tether in response to the tension gradient induced by tether force within the living cell body,24 lipid vesicles,55 and the vesicles partially drawn into a pipette.56 Our measurements show a significant effect of cholesterol on τlong, indicating the important role of cholesterol on tether radius relaxation. Specifically, the mean±s.d. values of τlong were estimated as 11.5±1.3 s (n=12) for control cells, close to the value reported on HEK cells previously25; 15.5±2.5 s (n=14) for cholesterol enriched; and 8.3±1.2 s (n=7) for cholesterol depleted cells, at extreme cholesterol concentrations examined.
Fig. 7.

Two-stage plasma membrane tether force relaxation, the first rapid force relaxation followed by a longer one. The force plot is fit to a single and bi-exponential force decays.
The tether force relaxation analysis of living cell plasma membranes, as in this study and our previous reports24, 25, represent greater values of both times constants compared to those for lipid vesicles.55 We suggest the difference could be due to the contribution of plasma membrane-cytoskeleton interactions in living cells, which are absent in lipid vesicles. Our measurements in this study are done at a specified tether length (20 μm), and the resulting time constants may increase at longer tethers since more time is needed for establishment of surface tension gradient and lipid flow along longer tethers.55
We analyzed the changes in tether length (dL) during force relaxation through analysis of REL region in Fig. 1. The reduction in tether force from Fl to Feq during the force relaxation is indicative of the displacement of the trapped bead; and hence, a change in tether length. The actual tether length at the end of force relaxation is L+dL, where L is the initial tether length (20 μm, in single-speed pull protocol). The force drop from Fl to Feq during relaxation was converted to bead displacement utilizing the force-QPD output voltage, and QPD output voltage-bead displacement relationships. The mean±s.d. values of dL were 262±160 nm (n=14) for control cells and significantly decreased to 82±45 nm (n=10) (P<0.05) in response to incubation of the cells in DMEM containing 5 mM MβCD for cholesterol depletion. Cholesterol enrichment significantly increased the dL values to 454±250 nm (n=10) (P<0.05) for the cells incubated in DMEM containing 5 mM cholesterol-MβCD. The increase in the tether length (dL) during force relaxation is an indication of membrane flow into the tether from the cell or rearrangements of components within the tether. The magnitude of dL suggests a significant effect of cholesterol on this parameter. Specifically, the higher dL values associated with cholesterol enrichment condition suggest less plasma membrane-cytoskeleton adhesion, and hence, more membrane liberation from the cell into the tether. Similarly, lower dL values under cholesterol depletion conditions suggest higher plasma membrane-cytoskeleton adhesion. These findings support the observed thinner membrane tethers and thicker tethers under cholesterol depletion and enrichment, respectively.
The variations in τlong with cholesterol content are consistent with those in ηeff which is a measure of the rate at which the membrane can flow and undergo deformations. The longer time constants upon cholesterol enrichment indicate lower deformation rates and flow rates, and are consistent with higher ηeff values. Values of ηeff increased under cholesterol enrichment in our measurements. Comparing with previous studies, increase in ηeff upon cholesterol enrichment with cholesterol-MβCD were reported for monkey kidney fibroblast cells (COS-7)57 and human red blood cells.58 In those studies, no changes in viscosity were reported upon cholesterol depletion using MβCD.
Membrane tether stiffness estimation
In Fig. 8A, we show static tether force values as a function of tether length for three different cases: (a) control cells; (b) cells incubated in DMEM containing 3 and 5 mM concentration of MβCD to induce cholesterol depletion; and (c) cells incubated in 3 and 5 mM concentration of MβCD-cholesterol to induce cholesterol enrichment. Each discrete point indicates the mean value of static tether force from a sample size of 10-15.
Fig. 8.

(A) Static membrane tether forces as a function of tether length for control HEK cells and cells under cholesterol depletion and cholesterol enrichment conditions. The numbers on each force plot indicate the corresponding membrane cholesterol concentration (pMol/μg protein). (B) Plasma membrane tether stiffness (k) in HEK cells estimated using static forces shown in (A) versus membrane cholesterol concentration. (C) Plasma membrane tether stiffness in HEK cells estimated using force relaxation-corrected method (krc) versus membrane cholesterol concentrations.
In each case, the forces are higher at longer tether lengths. We follow our previously reported method and use the slope of each tether force-tether length plot as an estimation of tether stiffness (k)29. Higher k was associated with cholesterol depleted cells, while cholesterol enriched cells had lower k as compared with control cells. Specifically, the mean±s.d. values of k for control cells were 1.2±0.19 pN/μm. The mean±s.d. values of k significantly increased to 2.37±0.15 and 3.24±0.10 pN/μm for cells incubated in DMEM containing 3 and 5 mM MβCD, and significantly decreased to 0.51±0.07 and 0.28±0.01 pN/μm in response to incubation of the cells in 3 and 5 mM cholesterol-MβCD, respectively (P<0.05) (Fig. 8B).
We point out that our estimated values of k, based on the data presented in Fig. 8A, do not take into account the effects of force relaxation that begins after tether elongation is halted. To understand the effects of force relaxation, we utilized an alternative approach based on the values of Feq to estimate the tether stiffness, using dL. The actual tether lengths at the end of force relaxation and their corresponding Feq were subsequently used to estimate the tether stiffness as Feq/L+dL. We refer to this alternative method of estimating k as relaxation-corrected method, and designate the corresponding tether stiffness as krc. The mean±s.d. values of krc were 1.39±0.65 pN/μm (n=12) for control cells (Fig. 8C). Cholesterol depletion significantly increased the mean±s.d. values of krc to 3.04±0.90 (n=5) and 3.75±0.80 (n=10) pN/μm, and cholesterol enrichment significantly decreased them to 0.98±0.56 (n=9) and 0.60±0.40 (n=8) pN/μm at the same cholesterol concentrations as k values are estimated (P<0.05). Both k and krc estimations indicate the same trends: higher tether stiffness upon cholesterol depletion, and lower stiffness under cholesterol enrichment conditions. The values of tether stiffness measured for HEK cells in our experiments are in the range of the values reported for OHCs 29 and jurkat cells.59 The respective values of tether stiffness are 3.7 and 1.6 pN/μm for OHCs lateral wall and jurkat cells, respectively. We summarize the quantitative results obtained in this study in Table 1.
Table 1A.
Values of the quantified metrics obtained in this study for control experiments as well as measurements performed under different membrane cholesterol modulation conditions.
|
Experiment/
Incubation condition |
Membrane cholesterol concentration (pmol/μg protein) |
Feq (pN) |
ηeff (pN.s/μm) |
k (pN/μm) |
τlong (s) |
|---|---|---|---|---|---|
| 5mM MβCD | 5.7±0.8* | 73.8±16.7* | Not determined | 3.2±0.1* | 8.3±1.2* |
| Control | 7.5±0.8 | 38.8±11.7 | 2.6±1 | 1.2±0.2 | 11.5±1.3 |
| Cholesterol enrichment/ 5mM MβCD-cholesterol |
17.3±0.6* | 19.5±5* | 3.6±0.7* | 0.3* | 15.5±2.5* |
Indicates significant difference with control experiments 5 (p<0.05).
In a recent study, the plasma membrane contact stiffness decreased upon cholesterol depletion in NIH-3T3 fibroblasts, measured by a nano-indentation technique which applies local harmonically oscillating indention forces into the cellular outermost layers (20 nm depth) above the cytoskeleton in fixed cells.20 While applying tensile forces on living cell plasma membrane and pulling it away from the cytoskeleton, we measured higher membrane stiffness upon cholesterol depletion. The difference between these two observations could be due to different physics of the experiments (tensile versus compressive forces).
Plasma membrane cholesterol content and relevance to hearing
Filipin labeling of the lateral wall of OHCs revealed a lowering of membrane cholesterol content during cell maturation.7 Our previous OHC mechanical measurements on the plasma membrane of lateral wall showed tether equilibrium forces of 73.4±5.1 pN,24 membrane effective viscosity as 1.7±0.58 pN.s/μm,23 and lateral wall plasma tether stiffness as 3.71 pN/μm.29 Comparing them with our results here for HEK cells, the OHC plasma membrane mechanical properties exhibit values indicative of a membrane that is depleted in cholesterol. Consistently, the membrane tethers in OHCs are not resolvable by optical microscopy,21 similar to the case of tethers pulled from HEK cells upon cholesterol depletion. This suggests that the plasma membrane of the lateral wall of OHCs behave as a membrane with relative low level of cholesterol in membrane. The findings of tendency to lower effective viscosities and faster time course of force relaxation under cholesterol depletion condition in HEK cell membranes suggest more rapid mechanical response of the membrane in response to an external force. These results are consistent with our recent observations, which showed an increase in electromotile response of the cochlear amplifier upon depletion of cochlear cholesterol content in guinea pigs.21
Conclusions
We have studied the effects of membrane cholesterol content on mechanical properties of the plasma membrane of a living cell with an optical tweezers force sensor. We found cholesterol depletion strengthens the plasma membrane cytoskeleton adhesion whereas cholesterol enrichment weakens the adhesion. Also, our results indicated that cholesterol depletion and cholesterol enrichment induced opposing effects on variety of mechanical properties of the membrane. Disrupting F-actin cytoskeletal filament diminished the observed disparity in the mechanical properties of the plasma membrane and membrane-cytoskeleton adhesion with cholesterol concentration. This suggests the dominant effect of cytoskeleton on plasma membrane mechanics. The dynamics of lipid flow from the cell body plasma membrane suggests there is more membrane flow into the tether under cholesterol enrichment relative to cholesterol depletion. Viscosity measurements show higher viscosities upon cholesterol enrichment and lower ones upon depletion, consistent with higher time course of lipid flow into the tether measured under cholesterol enrichment and lower rates by depletion. Our investigations help to interpret the mechanical aspect of some cholesterol dependent biological processes at membrane and cellular level, such as the effects of cholesterol on hearing.
Supplementary Material
Table 1B.
Percent changes in the obtained values of membrane tether diameter and tether-diameter dependent metrics compared to control experiments.
| Experiment/Incubation condition |
Membrane cholesterol concentration (pmol/μg protein) |
dtether (nm) |
W (×10−18) J/μm2 |
B (×10−18) J |
|---|---|---|---|---|
| Cholesterol depletion/5mM MβCD | 5.7±0.8* | Not visible | +228% | −2% |
| Cholesterol enrichment/5mM MβCD-cholesterol | 17.3±0.6* | −76%* | +120%* | +10% |
Indicates significant difference with control experiments (p<0.05). +/− signs represent increase and decrease in the values compared to control experiments, respectively.
Notes and references
- 1.Alberts B, Johnson A, Lewis J, Raff M, Roberts K, Walter P. Molecular biology of the cell. 4th edition Garland Science; New York: 2002. [Google Scholar]
- 2.Emmelot P. mammalian cell membranes. Vol. 2. Butterworths; London: 1977. [Google Scholar]
- 3.Hinzpeter A, Fritsch J, Borot F, Trudel S. p., Vieu D-L, Brouillard F, Baudouin-Legros M, Clain J. r. m., Edelman A, Ollero M. Membrane cholesterol content modulates CIC-2 gating and sensitivity to oxidative stress. J.Biol.Chem. 2007;282:2423–2432. doi: 10.1074/jbc.M608251200. [DOI] [PubMed] [Google Scholar]
- 4.Romanenko VG, Fang Y, Byfield F, Travis AJ, Vandenberg CA, Rothblat GH, Levitan I. Cholesterol sensitivity and lipid raft targeting of Kir2.1 channels. Biophys. J. 2004;87:3850–3861. doi: 10.1529/biophysj.104.043273. [DOI] [PMC free article] [PubMed] [Google Scholar]
- 5.Pucadyil TJ, Chattopadhyay A. Role of cholesterol in the function and organization of G-protein coupled receptor. Prog. Lip. Res. 2006;45:295–333. doi: 10.1016/j.plipres.2006.02.002. [DOI] [PubMed] [Google Scholar]
- 6.Cooper G. The cell: a molecular approach. 2nd edn Sinauer Associates; Sunderland: 2000. [Google Scholar]
- 7.Rajagopalan L, Greeson JN, Xia A, Liu H, Sturm A, Raphael RM, Davidson AL, Oghalai JS, Pereira FA, Brownell WE. Tuning of the outer hair cell motor by membrane cholesterol. J. Biol.Chem. 2007;282:36659–36670. doi: 10.1074/jbc.M705078200. [DOI] [PMC free article] [PubMed] [Google Scholar]
- 8.Simons K, Ikonen E. Functional rafts in cell membranes. Nature. 1997;387:569–572. doi: 10.1038/42408. [DOI] [PubMed] [Google Scholar]
- 9.Silvius JR. Role of cholesterol in lipd raft formation: lessons from lipid model systems. Biochim. Biophys. Acta (BBA)-Biomembranes. 2003;1610:174–183. doi: 10.1016/s0005-2736(03)00016-6. [DOI] [PubMed] [Google Scholar]
- 10.McMullen TPW, Lewis RNAH, McElhaney RN. Cholesterol-phospholipid interactions, the liquid-ordered phase and lipid rafts in model and biological membranes. Curr. Opinion Colloid Interface Sci. 2004;8:459–468. [Google Scholar]
- 11.Gracia RS, Bezlyepkina N, Knorr RL, Lipowsky R, Dimova R. Effects of cholesterol on the rigidity of saturated and unsaturated membranes: fluctuations and electrodeformation analysis of giant vesicles. Soft Matter. 2010;6:1472–1482. [Google Scholar]
- 12.Pan J, Mills TT, Tristram-Nagle S, Nagle JF. Cholesterol perturbs lipid bilayers nonuniversally. Phys. Rev. Lett. 2008;100:198103. doi: 10.1103/PhysRevLett.100.198103. [DOI] [PMC free article] [PubMed] [Google Scholar]
- 13.Pan J, Tristram-Nagle S, Nagle JF. Effect of cholesterol on structural and mechanical properties of membranes depends on lipid chain saturation. Phys. Rev. E. 2009;80:021931. doi: 10.1103/PhysRevE.80.021931. [DOI] [PMC free article] [PubMed] [Google Scholar]
- 14.Needham D, Nunn RS. Elastic deformation and failure of lipid bilayer membranes containing cholesterol. Biophys. J. 1990;58:997–1009. doi: 10.1016/S0006-3495(90)82444-9. [DOI] [PMC free article] [PubMed] [Google Scholar]
- 15.Fletcher DA, Mullins RD. Cell mechanics and the cytoskeleton. Nature. 2010;463:485–492. doi: 10.1038/nature08908. [DOI] [PMC free article] [PubMed] [Google Scholar]
- 16.Edmondson KE, Denney WS, Diamond SL. Neutrophil-bead collision assay: pharmacologically induced changes in membrane mechanics regulate the PSGL-1/P-selectin adhesion lifetime. Biophys. J. 2005;89:3603–3614. doi: 10.1529/biophysj.105.066134. [DOI] [PMC free article] [PubMed] [Google Scholar]
- 17.Oh H, Mohler ER, Tian A, Baumgart T, Diamond SL. Membrane cholesterol is a biomechanical regulator of neutrophil adhesion. Arterioscle. Thromb. Vasc. Biol. 2009;29:1290–1297. doi: 10.1161/ATVBAHA.109.189571. [DOI] [PMC free article] [PubMed] [Google Scholar]
- 18.Byfield FJ, Aranda-Espinoza H, Romanenko VG, Rothblat GH, Levitan I. Cholesterol depletion increases membrane stiffness of aortic endothelial cells. Biophys. J. 2004;87:3336–3343. doi: 10.1529/biophysj.104.040634. [DOI] [PMC free article] [PubMed] [Google Scholar]
- 19.Sun M, Northup N, Marga F, Huber T, Byfield FJ, Levitan I, Forgacs G. The effects of cholesterol on membrane-cytoskeleton adhesion. J. Cell Sci. 2007;120:2223–2231. doi: 10.1242/jcs.001370. [DOI] [PubMed] [Google Scholar]
- 20.Yang Y-T, Liao J-D, Lin C-CK, Chang C-T, Wang S-H, Ju M-S. Characterization of cholesterol-depleted or -restored cell membranes by depth-sensing nano-indentation. Soft Matter. 2011;8:682–687. [Google Scholar]
- 21.Brownell W, Jacob S, Hakizimana P, Ulfendahl M, Fridberger A. Membrane cholesterol modulates cochlear electromechanics. Pflügers Arc. Eur. J. Physiol., Pflügers. 2011;461:677–686. doi: 10.1007/s00424-011-0942-5. [DOI] [PMC free article] [PubMed] [Google Scholar]
- 22.Sfondouris J, Rajagopalan L, Pereira FA, Brownell WE. Membrane composition modulates prestin-associated charge movement. J. Biol.Chem. 2008;283:22473–22481. doi: 10.1074/jbc.M803722200. [DOI] [PMC free article] [PubMed] [Google Scholar]
- 23.Ermilov SA, Murdock DR, El-Daye D, Brownell WE, Anvari B. Effects of salycilate on plasma membrane mechanic. J. Neurophysiol. 2005;94:2105–2110. doi: 10.1152/jn.00414.2005. [DOI] [PubMed] [Google Scholar]
- 24.Murdock DR, Ermilov SA, Spector AA, Popel AS, Brownell WE, Anvari B. Effects of chlorpromazine on mechanical properties of the outer hair cell plasma membrane. Biophys. J. 2005;89:4090–4095. doi: 10.1529/biophysj.105.069872. [DOI] [PMC free article] [PubMed] [Google Scholar]
- 25.Ermilov SA, Murdock DR, Qian F, Brownell WE, Anvari B. Studies of plasma membrane mechanics and plasma membrane-cytoskeleton interactions using optical tweezers and fluorescence imaging. J. Biomech. 2007;40:476–480. doi: 10.1016/j.jbiomech.2005.12.006. [DOI] [PubMed] [Google Scholar]
- 26.Zidovetzki R, Levitan I. Use of cyclodextrins to manipulate plasma membrane cholesterol content: Evidence, misconceptions and control strategies. Biochimi Biophys. Acta (BBA)-Biomembranes. 2007;1768:1311–1324. doi: 10.1016/j.bbamem.2007.03.026. [DOI] [PMC free article] [PubMed] [Google Scholar]
- 27.Spector I, Shochet NR, Blasberger D, Kashman Y. Latrunculins—novel marine macrolides that disrupt microfilament organization and affect cell growth: I Comparison with Cytochalasin D. Cell Motil. Cytoskeleton. 1989;13:127–144. doi: 10.1002/cm.970130302. [DOI] [PubMed] [Google Scholar]
- 28.Happel J, Brenner H. Low Reynolds Number Hydrodynamicswith Special Applications to Particulate Media. Prentice-Hall; Englewoo Cliffs, NJ: 1965. p. 327. [Google Scholar]
- 29.Li Z, Anvari B, Takashima M, Brecht P, Torres JH, Brownell WE. Membrane tether formation from outer hair cells with optical tweezers. Biophys. J. 2002;82:1386–1395. doi: 10.1016/S0006-3495(02)75493-3. [DOI] [PMC free article] [PubMed] [Google Scholar]
- 30.Pontes B, Viana NB, Salgado LT, Farina M, Neto VÂM, Nussenzveig HM. Cell cytoskeleton and tether extraction. Biophys. J. 2011;101:43–52. doi: 10.1016/j.bpj.2011.05.044. [DOI] [PMC free article] [PubMed] [Google Scholar]
- 31.Smith AS, Sackmann E, Seifert U. Pulling tethers from adhered vesicles. Phys Rev Lett. 2004;92:208101. doi: 10.1103/PhysRevLett.92.208101. [DOI] [PubMed] [Google Scholar]
- 32.Jan Bukman D, Hua Yao J, Wortis M. Stability of cylindrical vesicles under axial tension. Phys Rev. E. 1996;54:5463–5468. doi: 10.1103/physreve.54.5463. [DOI] [PubMed] [Google Scholar]
- 33.Coue M, Brenner SL, Spector I, Korn ED. Inhibition of actin polymerization by Latranculin. FEBS Letters. 1987;213:316–318. doi: 10.1016/0014-5793(87)81513-2. [DOI] [PubMed] [Google Scholar]
- 34.Majstoravich S, Zhang J, Nicholson-Dykstra S, Linder S, Friedrich W, Siminovitch KA, Higgs HN. Lymphocyte microvilli are dynamic, actin-dependent structures that do not require Wiskott-Aldrich syndrome protein (WASp) for their morphology. Blood. 2004;104:1396–1403. doi: 10.1182/blood-2004-02-0437. [DOI] [PubMed] [Google Scholar]
- 35.Basarab GH, Mingzhai S, Francoise M, Michel G, Gabor F. Eukaryotic membrane tethers revisited using magnetic tweezers. Phys. Biol. 2007;4:67–78. doi: 10.1088/1478-3975/4/2/001. [DOI] [PubMed] [Google Scholar]
- 36.Evans E, Heinrich V, Leung A, Kinoshita K. Nano- to microscale dynamics of P-Selectin detachment from leukocyte interfaces. I. Membrane separation from the cytoskeleton. Biophys. J. 2005;88:2288–2298. doi: 10.1529/biophysj.104.051698. [DOI] [PMC free article] [PubMed] [Google Scholar]
- 37.Hochmuth FM, Shao JY, Dai J, Sheetz MP. Deformation and flow of membrane into tethers extracted from neuronal growth cones. Biophys. J. 1996;70:358–369. doi: 10.1016/S0006-3495(96)79577-2. [DOI] [PMC free article] [PubMed] [Google Scholar]
- 38.Titushkin I, Cho M. Distinct membrane mechanical properties of human mesenchymal stem cells determined using laser optical tweezers. Biophys. J. 2006;90:2582–2591. doi: 10.1529/biophysj.105.073775. [DOI] [PMC free article] [PubMed] [Google Scholar]
- 39.Brownell WE, Qian F, Anvari B. Cell membrane tethers generate mechanical force in response to electrical stimulation. Biophys. J. 2010;99:845–852. doi: 10.1016/j.bpj.2010.05.025. [DOI] [PMC free article] [PubMed] [Google Scholar]
- 40.Dai J, Ting-Beall HP, Sheetz MP. The secretion-coupled endocytosis correlates with membrane tension changes in RBL 2H3 cells. J. Gen. Physiol. 1997;110:1–10. doi: 10.1085/jgp.110.1.1. [DOI] [PMC free article] [PubMed] [Google Scholar]
- 41.Dai J, Sheetz MP. Membrane tether formation from blebbing cells. Biophys. J. 1999;77:3363–3370. doi: 10.1016/S0006-3495(99)77168-7. [DOI] [PMC free article] [PubMed] [Google Scholar]
- 42.Derenyi I, Julicher F, Prost J. Formation and interaction of membrane tubes. Phys. Rev. Lett. 2002;88:238101. doi: 10.1103/PhysRevLett.88.238101. [DOI] [PubMed] [Google Scholar]
- 43.Derényi I, Koster G, van Duijn MM, Czövek A, Dogterom M, Prost J, Linke H, Månsson A. Membrane nanotubes. Lect. Notes Phys. Springer; Berlin / Heidelberg: 2007. pp. 141–159. [Google Scholar]
- 44.Neto JC, Agero U, Gazzinelli RT, Mesquita ON. Measuring optical and mechanical properties of a living cell with defocusing microscopy. Biophys. J. 2006;91:1108–1115. doi: 10.1529/biophysj.105.073783. [DOI] [PMC free article] [PubMed] [Google Scholar]
- 45.Hochmuth FM, Marcus WD. Membrane tethers formed from blood cells with available area and determination of their adhesion energy. Biophys. J. 2002;82:2964–2969. doi: 10.1016/S0006-3495(02)75637-3. [DOI] [PMC free article] [PubMed] [Google Scholar]
- 46.Hwang CW, Waugh RE. Energy of dissociation of lipid bilayer from the membrane skeleton of red blood cell. Biophys. J. 1997;72:2669–2678. doi: 10.1016/S0006-3495(97)78910-0. [DOI] [PMC free article] [PubMed] [Google Scholar]
- 47.Evans E, Kukan B. Passive material behavior of granulocytes based on large deformation and recovery after deformation tests. Blood. 1984;64:1028–1035. [PubMed] [Google Scholar]
- 48.Needham D, Hochmuth RM. A sensitive measure of surface stress in the resting neutrophil. Biophys. J. 1992;61:1664–1670. doi: 10.1016/S0006-3495(92)81970-7. [DOI] [PMC free article] [PubMed] [Google Scholar]
- 49.Raucher D, Sheetz MP. Characteristics of a membrane reservoir buffering membrane tension. Biophys. J. 1999;77:1992–2002. doi: 10.1016/S0006-3495(99)77040-2. [DOI] [PMC free article] [PubMed] [Google Scholar]
- 50.Shao J, Hochmuth RM. Micropipette suction for measuring piconewton forces of adhesion and tether formation from neurtophil membranes. Biophys. J. 1996;71:2892–2901. doi: 10.1016/S0006-3495(96)79486-9. [DOI] [PMC free article] [PubMed] [Google Scholar]
- 51.Waugh RE. Surface viscosity measurements from large bilayer vesicle tether formation: I. Analysis. Biophys. J. 1982a;38:19–27. doi: 10.1016/S0006-3495(82)84526-8. [DOI] [PMC free article] [PubMed] [Google Scholar]
- 52.Waugh RE. Surface viscosity measurements from large bilayer vesicle tether formation: II. Experiments. Biophys. J. 1982b;38:29–37. doi: 10.1016/S0006-3495(82)84527-X. [DOI] [PMC free article] [PubMed] [Google Scholar]
- 53.Evans EA, Yeung A. Hidden dynamics in rapid changes of bilayer shape. Chem. Phys. Lipids. 1994;73:39–56. [Google Scholar]
- 54.Schmidt CE, Dai J, Lauffenburger DA, Sheetz MP, Horwitz AF. Integrin-cytoskeletal interactions in neuronal growth cones. J. Neurosci. 1995;15:3400–3407. doi: 10.1523/JNEUROSCI.15-05-03400.1995. [DOI] [PMC free article] [PubMed] [Google Scholar]
- 55.Dommersnes PG, Orwar O, Brochard-Wyart F, Joanny JF. Marangoni transport in lipid nanotubes. EPL. 2005;70:271–277. [Google Scholar]
- 56.Hochmuth FM, Evans E. Extensional flow of erythrocyte membrane from cell body to elastic tether: I. Analysis. Biophys. J. 1982;39:71–81. doi: 10.1016/S0006-3495(82)84492-5. [DOI] [PMC free article] [PubMed] [Google Scholar]
- 57.Goodwin J. Shawn, Drake KR, Remmert CL, Kenworthy AK. Ras diffusion is sensitive to plasma membrane viscosity. Biophys. J. 2005;89:1398–1410. doi: 10.1529/biophysj.104.055640. [DOI] [PMC free article] [PubMed] [Google Scholar]
- 58.Cooper RA. Influence of increased membrane cholesterol on membrane fluidity and cell function in human red blood cells. J Supramol. Struct. 1978;8:413–430. doi: 10.1002/jss.400080404. [DOI] [PubMed] [Google Scholar]
- 59.Schmitz J, Benoit M, Gottschalk K-E. Local viscoelasticity of membrane tethers and its importance for cell adhesion. Biophys. J. 2008;95:1448–1459. doi: 10.1529/biophysj.107.124289. [DOI] [PMC free article] [PubMed] [Google Scholar]
- 60.Levic S, Yamoah EN. Plasticity in membrane cholesterol contributes toward electrical maturation of hearing. J. Biol.Chem. 2011;286:5768–73. doi: 10.1074/jbc.M110.186486. [DOI] [PMC free article] [PubMed] [Google Scholar]
- 61.Purcell EK, Liu L, Thomas PV, Duncan R. Keith. Cholesterol influences voltage-gated calcium channels and BK-type potassium channels in auditory hair cells. PLos One. 2011;6:e26289. doi: 10.1371/journal.pone.0026289. [DOI] [PMC free article] [PubMed] [Google Scholar]
Associated Data
This section collects any data citations, data availability statements, or supplementary materials included in this article.