

ID2 is an inhibitor of DNA binding that is known to be highly unstable. This study describes the cloning, expression and purification of ID2 for crystallization, culminating in the collection of diffraction data.
Keywords: ID2, inhibitor of DNA binding, helix–loop–helix domain, homodimer
Abstract
The ID proteins are named for their role as inhibitors of DNA binding and differentiation. They contain a helix–loop–helix (HLH) domain but lack a basic DNA-binding domain. In complex with basic HLH (bHLH) transcription factors, gene expression is regulated by DNA-binding inactivation. Although the HLH domain is highly conserved and shares a similar topology, the IDs preferentially bind class I bHLH-group members such as E47 (TCF3) but not the class III bHLH member Myc. A structure of an ID protein could potentially shed light on its mechanism. Owing to their short half-lives in vivo and reported in vitro instability, this paper describes the strategies that went into expressing sufficient soluble and stable ID2 to finally obtain diffraction-quality crystals. A 2.1 Å resolution data set was collected from a crystal belonging to space group P3121 with unit-cell parameters a = b = 51.622, c = 111.474 Å, α = β = 90, γ = 120° that was obtained by hanging-drop vapour diffusion in a precipitant solution consisting of 0.1 M MES pH 6.5, 2.0 M potassium acetate. The solvent content was consistent with the presence of one or two molecules in the asymmetric unit.
1. Introduction
ID proteins are a class of transcription regulators that play key roles in development and cell-cycle progression (Iavarone & Lasorella, 2004 ▶; Zebedee & Hara, 2001 ▶). Conversely, deregulation of IDs has been shown to promote tumorigenesis (Benezra et al., 2001 ▶; Lasorella et al., 2001 ▶; Zebedee & Hara, 2001 ▶).
Humans express four ID proteins, namely ID1, ID2, ID3 and ID4 (Benezra et al., 1990 ▶; Sun et al., 1991 ▶; Biggs et al., 1992 ▶; Riechmann et al., 1994 ▶; Christy et al., 1991 ▶). Recently, the NMR structure of human ID3 was deposited in the PDB as entry 2lfh (Northeast Structural Genomics Consortium, unpublished work). Multiple alignment by LALIGN (Huang & Miller, 1991 ▶) of the protein sequences of ID2 (residues 1–82) and ID3 (residues 1–77) showed that they have 51% sequence identity. Truncating to just the HLH region based on the boundary from the ID3 NMR structure (residues 42–82) showed 62% identity to ID2 (residues 30–77).
In general the IDs bind bHLH transcription factors, but ID2 in particular has been shown to additionally bind pRb (retinoblastoma), a tumour suppressor that is a non-bHLH protein (Iavarone et al., 1994 ▶). The structure of ID2 could potentially aid in understanding how this protein family functions to regulate transcription and could serve as a model for the design of compounds to disrupt the ID2–pRb interaction.
When ID2 was first cloned, the authors noted that it did not homodimerize well (Sun et al., 1991 ▶). Others have reported the ID2 homodimer to be insoluble and to tend to aggregate, especially at high concentrations (Colombo & Cabrele, 2006 ▶). Most in vitro studies used ID proteins that retained solubility tags or were produced at low concentrations for biochemical studies. The challenge was to express sufficient soluble ID2 that was stable at high concentrations in order to conduct crystallization trials.
The ID2 constructs described here were created in order to study the mechanism of dimerization as well as the interaction with pRb, both of which require only the HLH domain (Ellenberger et al., 1994 ▶; Ma et al., 1994 ▶; Iavarone et al., 1994 ▶). Based on the previously published properties of ID2, the constructs were truncated at residue 82 to increase the chance of stability and solubility for crystallization. However, this was not sufficient for stability and solubility. It was a cloning artifact that enhanced these properties, as is discussed in a later section.
2. Materials and methods
2.1. Cloning
Several ID2 (NCBI accession No. NM_002166) constructs were cloned from full-length cDNA (a gift from Scripps) using Gateway cloning technology (Invitrogen) as per the manufacturer’s instructions. The constructs were ID2-HLH, which mostly contained the HLH domain (residues 24–82; 6830 Da), and a longer form, ID2-N-HLH, which contained the full N-terminus (residues 1–82; 9329 Da). The forward primers used for PCR amplification, which included attB sites (lower case) for recombination (lower case, underlined) into the entry clone as well as a tobacco etch virus (TEV) protease cleavage site (lower case, bold) at the N-terminal end of ID2, were 5′-ggggacaagtttgtacaaaaaagcaggct tc gaaaacctgtattttcagggcCGGAGCAAAACCCCTGTGGACGAC-3′ and 5′-ggggacaagtttgtacaaaaaagcaggct tc g aaaacctgtattttcagggcATGAAAGCCTTCAGTCCCGTGAGG-3′ for ID2-HLH and ID2-N-HLH, respectively. The reverse primer for both was 5′-ggggaccactttgtacaagaaagctgggttTTAGATGCGAGTCCAGGGCGATCTGCA-3′. BP reactions (Invitrogen) using the PCR products were recombined with vector pDONR221 to create an entry clone, which was subsequently subcloned into several expression vectors via the Gateway LR reaction (Invitrogen). The optimized expression vector was pDEST565 containing an N-terminal 6×His-GST tag. Inserts were confirmed by sequencing (first base). Cloning artifacts include the TEV-cleaved residual glycine at the start of the N-terminus and the 14-amino-acid polypeptide at the C-terminus that will be discussed in a later section.
2.2. Protein expression and purification
The pDEST565-TEV-ID2 expression plasmid was transformed into One Shot competent Escherichia coli BL21 (DE3) cells (Invitrogen). The E. coli cells were cultured in 5 l Luria broth (LB) containing 100 µg ml−1 ampicillin in a shaker incubator at 310 K until an OD600 of 0.7 was reached. The cultures were induced with 0.2 mM IPTG and allowed to grow at 290 K for 18 h. The cells were harvested by ultracentrifugation at 10 000 rev min−1 for 10 min at 277 K. The pellets were resuspended in cold lysis buffer (50 mM Tris–HCl pH 8.0, 300 mM NaCl, 30 mM imidazole) and ultrasonicated for 8 min at 30% amplitude (2 s on, 2 s off) on ice. The supernatant was filtered through a 0.22 µm membrane after ultracentrifugation for 2 h at 18 000 rev min−1 and 277 K to remove any cell debris in preparation for purification.
All protein-purification steps were performed on an ÄKTAxpress system. The first step involved affinity chromatography using nickel beads (5 ml HisTrap FF columns from GE Healthcare) equilibrated in lysis buffer to capture all 6×His-tagged fusion proteins from the crude lysate. The peak fractions (buffer: 50 mM Tris–HCl pH 8.0, 300 mM NaCl, 300 mM imidazole) were immediately desalted in 50 mM Tris–HCl pH 8.0, 100 mM NaCl buffer using a HiPrep 26/10 desalting column (GE Healthcare). The protein solution was mixed with TEV protease at a protease:protein ratio of 1:100 at 277 K overnight. Ion-exchange chromatography (6 ml Resource S; GE Healthcare) was performed on the cleaved protein mixture using an increasing salt gradient up to 1 M NaCl to separate the fusion tag from the protein. To remove any residual tag, the eluted protein fractions were pooled and run using a slow gradient through a 1 ml HisTrap HP column (GE Healthcare); the unbound fractions were collected, pooled and buffer-exchanged (50 mM Tris–HCl pH 8.0, 100 mM NaCl) while being concentrated using a membrane-based concentrator with a 3000 Da molecular-weight cutoff (Vivaspin, Sartorius). The Bradford (Quick Start, Bio-Rad) assay was used to quantitate protein concentration as per the manufacturer’s instructions. 20 µl aliquots of ID2-HLH (11 mg ml−1) and ID2-N-HLH (7 mg ml−1) at 90% purity or greater were stored at 193 K.
2.3. Crystallization
Initial screens were performed in 96-well format by sitting-drop vapour diffusion using an automated liquid dispenser (Innovadyne); the drops consisted of 200 nl protein solution and 200 nl reservoir solution and were equilibrated against 50 µl reservoir solution. Screening kits from Qiagen and Hampton Research were used and the best crystals were found in The Cations Suite from Qiagen at salt concentrations of 2.0 M or more for both constructs. The best conditions (Nos. 80 and 33) were optimized for temperature (277, 291 and 298 K), pH (5.5–8.0 in steps of 0.5) and salt concentration (2.0–4.5 M in steps of 0.5 M) manually by hanging-drop vapour diffusion using 1 µl protein solution in 50 mM Tris–HCl pH 8.0, 100 mM NaCl mixed with 1 µl precipitant solution and equilibrated against 500 µl reservoir solution.
Microseeding was required to optimize the crystal size for ID2-HLH. A seed stock was created using a drop consisting of crystals crushed in 60 µl mother liquor and centrifuged for 10 min at 13 000 rev min−1. Serial dilutions of 1:10, 1:100, 1:1000 and 1:10 000 were prepared from the seed stock. Hanging drops were set up for each dilution using 1 µl diluted stock solution, 1 µl mother liquor and 1 µl protein solution.
Crystals were flash-cooled in liquid nitrogen prior to data collection.
2.4. X-ray data collection and processing
Crystals from the initial screens were tested for diffraction on a PLATINUM135 CCD detector with focused Cu Kα radiation from an X8 PROTEUM rotating-anode generator (Bruker AXS) controlled by PROTEUM2 software (Sheldrick, 2008 ▶). Manually set-up ID2-HLH crystals resulted in a native data set to only 3.0 Å resolution on the GM/CA-CAT beamline 23-ID-D equipped with a MAR 300 CCD detector at Argonne National Laboratory. However, a higher resolution (2.1 Å) native data set (two merged data sets) for ID2-N-HLH was obtained on beamline X29 equipped with an ADSC Q315r detector at Brookhaven National Laboratory using a wavelength of 1.08090 Å. All experiments were performed under standard cryogenic conditions (100 K). Both data sets were indexed, integrated, merged and scaled with HKL-2000 (Otwinowski & Minor, 1997 ▶). Data-collection statistics for the 2.1 Å resolution structure are given in Table 1 ▶.
Table 1. Data-collection statistics for ID2-N-HLH.
Values in parentheses are for the last resolution shell.
| Detector | ADSC unsupported Q315 CCD |
| Wavelength (Å) | 1.0809 |
| Crystal-to-detector distance (mm) | 240 |
| Rotation per image (°) | 1 and 2 |
| No. of images | 180 and 90 [270 when merged] |
| Space group | P3121 |
| Resolution range (Å) | 50–2.1 (2.18–2.10) |
| Unit-cell parameters (Å, °) | a = b = 51.622, c = 111.474, α = β = 90, γ = 120 |
| Total No. of reflections | 125386 |
| No. of unique reflections | 10569 |
| Completeness (%) | 100 (100) |
| Multiplicity | 11.9 (10.2) |
| Average I/σ(I) | 40.6 (4.2) |
| R merge † (%) | 5.8 (57) |
R
merge = 
 , where Ii(hkl) and 〈I(hkl)〉 are the intensity of measurement i and the mean intensity for the reflection with indices hkl, respectively.
2.5. Electrophoretic mobility-shift assay
An electrophoretic mobility-shift assay (EMSA) was performed on ID2-N-HLH as described previously (Hara et al., 1997 ▶) with some modifications. Single-stranded forward and reverse 5′-Cy5-labelled probes for the E-box-containing MCK promoter sequence 5′-GGATCCCCCCAACACCTGCTGCCTGA (Sigma, Proligo; the E-box is shown in bold) were annealed in a Bio-Rad thermocycler. The same batch of ID2-N-HLH as used for crystallization was used; a sample was slowly thawed from 193 to 277 K by placing the sample at 243 K for 2 h and then transferring it to ice to thaw fully. Purified E47 (residues 545–606) was used alone and in combination with ID2-N-HLH after serial dilution and was incubated for 10 min at room temperature in binding buffer (20 mM Tris–HCl pH 8.0, 50 mM KCl, 1 mM DTT, 1 mM EDTA, 10% glycerol, 0.1 mg ml−1 BSA). 2 µM Cy5-labelled probe was added for an additional 15 min at room temperature to a final reaction volume of 20 µl. Samples were electrophoresed on a 6% Tris–glycine native polyacrylamide gel in 1× Tris–glycine buffer (25 mM Tris pH 8.3, 192 mM glycine) at 277 K for 130 min at 300 V and were imaged using a Typhoon phosphorimager (Amersham Biosciences).
3. Results and discussion
3.1. Cloning and expression
In order to alleviate instability issues, constructs were created based on the known properties of ID2. Previous experiments found that the HLH domain alone was sufficient for dimerization (Ellenberger et al., 1994 ▶; Ma et al., 1994 ▶), but that additional residues surrounding it were required for stability (Liu et al., 2000 ▶). Beyond this boundary, the sequence diverges save for traces of similarity, one of which is a canonical death-box (D-box; RxxLxxxN) motif that is conserved in all but ID3. The D-box targets ID2 for degradation and is located C-terminal to the HLH at residues 100–107 (Lasorella et al., 2006 ▶).
The domain-prediction site Pfam (protein-family database; Finn et al., 2010 ▶) and The Simple Modular Architecture Research Tool (SMART; Schultz et al., 1998 ▶) were used to determine the HLH region of ID2. Combining both predictions, the HLH region ranged from residues 28 to 81.
Secondary-structure studies of synthetic ID2 by circular dichroism showed that the N- and C-termini were made up of random coils and that an extended C-terminus beyond the HLH rendered ID2 unstable (Colombo & Cabrele, 2006 ▶). The NMR structure of ID3 consisting of residues 27–83 partially confirmed this observation for the N-terminus, with only the HLH region (residues 42–82) being folded.
The C-terminus of ID2 has been shown to be important for subcellular localization. Constructs containing residues 102–119 were shown to be important for cytoplasmic localization, with a putative nuclear export signal (NES) at residues 106–115, while constructs containing residues 1–101 were mostly localized to the nucleus (Kurooka & Yokota, 2005 ▶). However, the authors do not discount other localization mechanisms of ID2 such as passive diffusion (Ghil et al., 2002 ▶; Mattaj & Englmeier, 1998 ▶) owing to its small size as well as a chaperone mechanism when bound to bHLH partners such as E47 (Deed et al., 1996 ▶).
Since there are currently no reports of the C-terminus being involved in dimerization or interaction with pRb, it was decided to incorporate information based on the CD studies, domain predictions and the D-box element to create the ID2 constructs. Hence, the constructs were all truncated at residue 82. The first construct (ID2-N-HLH) contained the full N-terminal region to add stability to the HLH, while the second construct (ID2-HLH) mainly contained the HLH residues 24–82. Unfortunately, both constructs precipitated immediately upon removal of the solubility tag (6×His-GST). It was a simple cloning error in the reverse primer (indicated in bold underlined upper case in the primer in §2.1) that gave rise to a short C-terminal polypeptide (LKPSFLVQSGDIAS) that aided in stabilizing ID2-HLH without compromising its activity in vitro. 20 µl purified protein was thawed, left at room temperature and sampled by SDS–PAGE over the course of 6 d. The gel showed no noticeable aggregation and the sample appeared to be unchanged over the 6 d (Fig. 1 ▶, lanes 2 and 3).
Figure 1.
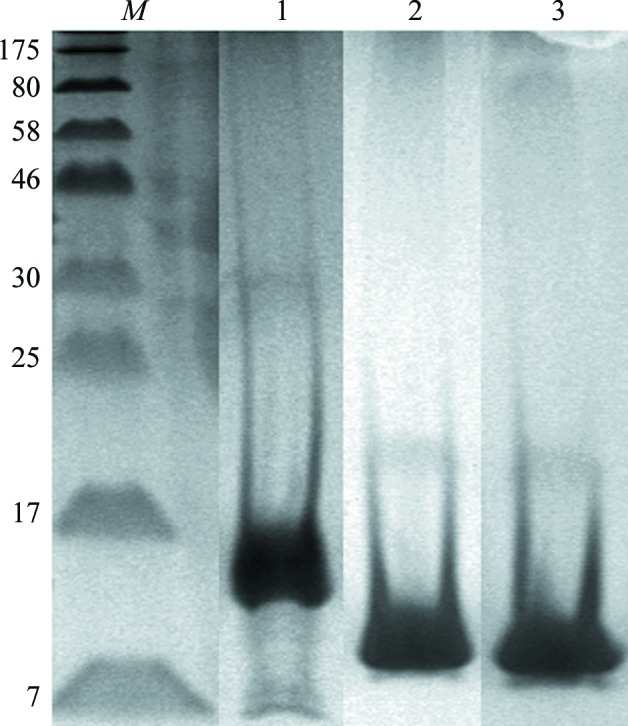
12% SDS–PAGE showing purified ID2. Lane M, molecular-weight markers (labelled in kDa); lane 1, ID2-N-HLH; lane 2, ID2-HLH at day 1; lane 3, ID2-HLH at day 6.
Similarly, ID2-N-HLH had the same problem of precipitating as soon as the solubility tag was removed, so the polypeptide was cloned at the same position as ID2-HLH. Again, the polypeptide proved to stabilize the protein and these constructs were used to proceed with expression optimization.
Small-scale (5 ml) expression tests in E. coli using different broths (Luria and Terrific broths) induced at different temperatures (303, 298 and 290 K) with varying concentrations of IPTG (0.2 mM–1 M) were performed. Optimal expression conditions were found using Luria broth induced with 0.2 mM IPTG for 18 h at 290 K; yields typically ranged between 1.5 and 2 mg pure ID2 per litre of bacterial culture.
Further cloning experiments to identify the shortest length of the C-terminal polypeptide required for stability found that seven residues were sufficient (data not shown). However, the crystals and the diffraction data collected were for the construct with all 14 residues.
In addition, other ID2 constructs were created to test whether using different lengths of the C-terminal region of ID2 would aid in stabilizing the HLH domain, as had been suggested by previous studies (Lasorella et al., 2006 ▶). Unfortunately, none of them were sufficiently stable and they could not be used for crystallization trials. They were residues 1–134 (full length; unstable), residues 1–99 (unstable at high concentrations), residues 1–89 (unstable) and residues 1–106 (unstable) (data not shown).
3.2. Protein purification
ID2 was purified at 277 K to avoid degradation. Affinity chromatography followed by ion-exchange chromatography, desalting and a final round of reverse affinity chromatography was the standard procedure for purification. SDS–PAGE confirmed a single protein band (Fig. 1 ▶) of the expected size after the final purification step. The identity of the band was confirmed by mass spectrometry to be human ID2. The purified proteins were concentrated to 11 mg ml−1 for ID2-HLH and 7 mg ml−1 for ID2-N-HLH without any degradation or precipitation.
Competitive EMSA experiments were conducted to test for protein activity. Purified E47, a transcription factor and a known binding partner, was combined with ID2 in the presence of an E47-binding E-box-containing probe. Keeping the amount of E47 and DNA constant, ID2 showed increasing inhibition with concentration. This was consistent with previous experiments (Han et al., 2009 ▶) and confirmed that purification and the presence of the C-terminal polypeptide did not affect the in vitro activity of the protein. The results for ID2-N-HLH are shown in Fig. 2 ▶.
Figure 2.

6% native gel showing the inhibition of E47 bound to a 26-mer E-box-containing probe by increasing concentrations of ID2-N-HLH. Lane 1, 2 µM Cy5-dsDNA; lanes 2–6, 0.5 µM E47 + DNA; lane 3, 2.5 µM ID2-N-HLH; lane 4, 1 µM ID2; lane 5, 0.5 µM ID2; lane 6, 0.25 µM ID2.
3.3. Crystallization
Optimized crystallization conditions for ID2-N-HLH were found to be 0.1 M MES pH 6.5, 2.0 M potassium acetate; those for ID2-HLH were 0.1 M MES pH 6.5, 2.5 M lithium acetate. The best crystals were found to grow at 291 K over a period of 4–7 d.
ID2-HLH crystals were difficult to harvest owing to the formation of spider-shaped rods that were clumped together (Fig. 3 ▶). In order to obtain sufficiently large crystals from which a single rod could be broken off, microseeding at a 1:1000 dilution was used to form larger crystals.
Figure 3.
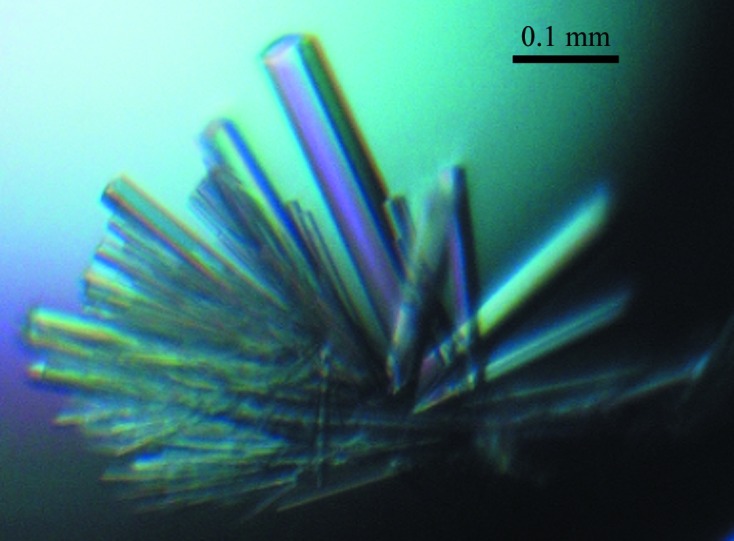
ID2-HLH crystal from microseeding at 1:1000 dilution. Owing to the nature of the crystal, it was difficult to harvest and the best diffraction attained was 3.0 Å resolution.
In contrast, ID2-N-HLH gave single rod-shaped crystals (Fig. 4 ▶) which were optimal in the initial condition. Both sets of crystals were of diffraction quality (∼3–6 Å resolution) under cryogenic conditions (100 K) and did not exhibit ice rings without the use of a cryoprotectant; they were thus flash-cooled, stored in liquid nitrogen and sent to a synchrotron-radiation facility for data collection.
Figure 4.

Single rod-shaped crystals of ID2-N-HLH with sharp edges grown at 291 K diffracted to 2.1 Å resolution.
3.4. Data collection
A 3.0 Å resolution data set was collected for ID2-HLH and was indexed in space group P212121, with unit-cell parameters a = 68.052, b = 86.803, c = 93.638 Å, α = β = γ = 90.00°. Using an adjusted molecular weight (8330.7 Da) that includes the 140-amino-acid C-terminal polypeptide and the TEV cloning artifact (glycine), the Matthews coefficient was calculated to be 2.77 Å3 Da−1, corresponding to 56% solvent content and suggesting the presence of six molecules (three dimers) in the asymmetric unit. A self-rotation function using MOLREP from the CCP4 suite (Murshudov et al., 2011 ▶; Winn et al., 2011 ▶) clearly showed the presence of twofold and threefold molecular symmetry consistent with three dimers.
A higher resolution data set (2.1 Å) was collected for ID2-N-HLH. This crystal belonged to space group P3121. Again using an adjusted molecular weight (10 829.6 Da), the Matthews coefficient was calculated to be 1.98 Å3 Da−1 with 38% solvent content, suggesting the presence of two molecules (one dimer) in the asymmetric unit, or 3.96 Å3 Da−1 with 69% solvent content, suggesting the presence of one molecule (a monomer) in the asymmetric unit. Table 1 ▶ reports the data-collection statistics for this crystal.
The 2.1 Å resolution ID2-N-HLH data set will be used for molecular-replacement (MR) trials using the most highly homologous models in the PDB. Potential candidates would be the NMR structure of ID3 (PDB entry 2lfh; 60% identity; Northeast Structural Genomics Consortium, unpublished work) and the structure of NeuroD1 (PDB entry 2ql2, chain B; 30% identity; Longo et al., 2008 ▶). In the event that the initial MR is unsuccessful, selenomethionine-derivatized ID2-HLH could also be employed.
Acknowledgments
This work was supported by the Agency for Science, Technology and Research (A*STAR) in Singapore. We are grateful to Dr Robert Robinson (IMCB, Singapore) for the use of the Innovadyne robot and the X8 PROTEUM X-ray diffraction system. We thank Howard Robinson (BNL) for National Synchrotron Light Source and Michael S. McCormick for Advanced Photon Source beam time and data collection. Both synchrotron light sources are supported by the US Department of Energy, Office of Science and Office of Basic Energy Sciences. We also acknowledge B. Moovarkumudalvan for help with initial data processing. We are grateful to Dominic Esposito for generously providing the pDEST565 vectors.
References
- Benezra, R., Davis, R. L., Lockshon, D., Turner, D. L. & Weintraub, H. (1990). Cell, 61, 49–59. [DOI] [PubMed]
- Benezra, R., Rafii, S. & Lyden, D. (2001). Oncogene, 20, 8334–8341. [DOI] [PubMed]
- Biggs, J., Murphy, E. V. & Israel, M. A. (1992). Proc. Natl Acad. Sci. USA, 89, 1512–1516. [DOI] [PMC free article] [PubMed]
- Christy, B. A., Sanders, L. K., Lau, L. F., Copeland, N. G., Jenkins, N. A. & Nathans, D. (1991). Proc. Natl Acad. Sci. USA, 88, 1815–1819. [DOI] [PMC free article] [PubMed]
- Colombo, N. & Cabrele, C. (2006). J. Pept. Sci. 12, 550–558. [DOI] [PubMed]
- Deed, R. W., Armitage, S. & Norton, J. D. (1996). J. Biol. Chem. 271, 23603–23606. [DOI] [PubMed]
- Ellenberger, T., Fass, D., Arnaud, M. & Harrison, S. C. (1994). Genes Dev. 8, 970–980. [DOI] [PubMed]
- Finn, R. D., Mistry, J., Tate, J., Coggill, P., Heger, A., Pollington, J. E., Gavin, O. L., Gunasekaran, P., Ceric, G., Forslund, K., Holm, L., Sonnhammer, E. L., Eddy, S. R. & Bateman, A. (2010). Nucleic Acids Res. 38, D211–D222. [DOI] [PMC free article] [PubMed]
- Ghil, S.-H., Jeon, Y.-J. & Suh-Kim, H. (2002). Exp. Mol. Med. 34, 367–373. [DOI] [PubMed]
- Han, W., Wu, Z., Zhao, Y., Meng, Y., Si, Y., Yang, J., Fu, X. & Yu, L. (2009). Nucleic Acids Res. 37, 3996–4009. [DOI] [PMC free article] [PubMed]
- Hara, E., Hall, M. & Peters, G. (1997). EMBO J. 16, 332–342. [DOI] [PMC free article] [PubMed]
- Huang, X. & Miller, W. (1991). Adv. Appl. Math. 12, 337–357.
- Iavarone, A., Garg, P., Lasorella, A., Hsu, J. & Israel, M. A. (1994). Genes Dev. 8, 1270–1284. [DOI] [PubMed]
- Iavarone, A. & Lasorella, A. (2004). Cancer Lett. 204, 189–196. [DOI] [PubMed]
- Kurooka, H. & Yokota, Y. (2005). J. Biol. Chem. 280, 4313–4320. [DOI] [PubMed]
- Lasorella, A., Stegmüller, J., Guardavaccaro, D., Liu, G., Carro, M. S., Rothschild, G., de la Torre-Ubieta, L., Pagano, M., Bonni, A. & Iavarone, A. (2006). Nature (London), 442, 471–474. [DOI] [PubMed]
- Lasorella, A., Uo, T. & Iavarone, A. (2001). Oncogene, 20, 8326–8333. [DOI] [PubMed]
- Liu, J., Shi, W. & Warburton, D. (2000). Biochem. Biophys. Res. Commun. 273, 1042–1047. [DOI] [PubMed]
- Longo, A., Guanga, G. P. & Rose, R. B. (2008). Biochemistry, 47, 218–229. [DOI] [PubMed]
- Ma, P. C. M., Rould, M. A., Weintraub, H. & Pabo, C. O. (1994). Cell, 77, 451–459. [DOI] [PubMed]
- Mattaj, I. W. & Englmeier, L. (1998). Annu. Rev. Biochem. 67, 265–306. [DOI] [PubMed]
- Murshudov, G. N., Skubák, P., Lebedev, A. A., Pannu, N. S., Steiner, R. A., Nicholls, R. A., Winn, M. D., Long, F. & Vagin, A. A. (2011). Acta Cryst. D67, 355–367. [DOI] [PMC free article] [PubMed]
- Otwinowski, Z. & Minor, W. (1997). Methods Enzymol. 276, 307–326. [DOI] [PubMed]
- Riechmann, V., van Crüchten, I. & Sablitzky, F. (1994). Nucleic Acids Res. 22, 749–755. [DOI] [PMC free article] [PubMed]
- Schultz, J., Milpetz, F., Bork, P. & Ponting, C. P. (1998). Proc. Natl Acad. Sci. USA, 95, 5857–5864. [DOI] [PMC free article] [PubMed]
- Sheldrick, G. M. (2008). Acta Cryst. A64, 112–122. [DOI] [PubMed]
- Sun, X.-H., Copeland, N. G., Jenkins, N. A. & Baltimore, D. (1991). Mol. Cell. Biol. 11, 5603–5611. [DOI] [PMC free article] [PubMed]
- Winn, M. D. et al. (2011). Acta Cryst. D67, 235–242.
- Zebedee, Z. & Hara, E. (2001). Oncogene, 20, 8317–8325. [DOI] [PubMed]