Native and Hg-derivative diffraction data from human α-l-iduronidase crystals were collected to 2.3 and 3.1 Å resolution, respectively. SIRAS phasing gave a high-quality electron-density map.
Keywords: mucopolysaccharidosis type I, enzyme replacement therapy, SIRAS
Abstract
Human lysosomal α-l-iduronidase, whose deficiency causes mucopolysaccharidosis type I, was crystallized using sodium/potassium tartrate and polyethylene glycol 3350 as a precipitant. Using synchrotron radiation, a native data set was collected from a single crystal at 100 K to 2.3 Å resolution. The crystal belonged to space group R3 with unit-cell dimensions of a = b = 259.22, c = 71.83 Å. To obtain the phase information, mercury-derivative crystals were prepared and a single-wavelength anomalous dispersion (SAD) data set was collected at the Hg peak wavelength. Phase calculation with the single isomorphous replacement with anomalous scattering (SIRAS) method successfully yielded an interpretable electron-density map.
1. Introduction
Human α-l-iduronidase (hIDUA, EC: 3.2.1.76, UniProt ID: P35475) is a lysosomal enzyme that cleaves terminal α-iduronic acid residues from glycosaminoglycan, heparan sulfate and dermatan sulfate. The mature form of hIDUA has 626 amino acids (28–653) with molecular mass of 69 908 Da and includes six potential N-glycosylation sites. A deficiency of hIDUA causes one of the lysosomal storage diseases, mucopolysaccharidosis type I (MPS I). Patients with MPS I develop mental retardation, gross facial features, an enlarged and deformed skull, a small stature, corneal opacities, hepatosplenomegaly, valvular heart defects, thick skin, joint contractures and hernias. MPS I is classified into three subtypes based on its severity: Hurler (severe type), Hurler/Scheie (intermediate type) and Scheie (mild type) syndrome (Neufeld & Muenzer, 1989 ▶). Recently, enzyme replacement therapy for MPS I using recombinant hIDUA was introduced in clinical medicine (Kakkis et al., 2001 ▶). Although many patients have been successfully treated with the recombinant enzyme, little improvement of brain and bone disorders is obtained. Thus, elucidation of the molecular mechanism of MPS I and a new therapeutic approach based on the new information are eagerly awaited.
Human α-l-iduronidase is classified into glycoside hydrolase family 39 (GH39) in the CAZy database (Henrissat & Davies, 1997 ▶). To date, the only experimentally determined structure of the GH39 family is that of bacterial β-xylosidase (XynB). Furthermore, a homology model of hIDUA constructed from Thermoanaerobacterium saccharolyticum XynB (PDB code 1px8; Yang et al., 2004 ▶) has been reported. However, the sequence homology between hIDUA and T. saccharolyticum XynB is quite low (28.4% similarity) and thus the reliability of the model is not high. Furthermore, the amino-acid chain length of hIDUA is about 130 amino acids longer at the C-terminus than that of XynB (full length of 500 amino acids); therefore, the homology model is missing the C-terminal end of hIDUA (523–653), which includes eight point mutation sites reported in MPS I patients (Kang & Stevens, 2009 ▶).
So far, many mutations of the IDUA gene have been identified in MPS I patients (Scott et al., 1995 ▶; Matte et al., 2003 ▶; Yogalingam et al., 2004 ▶). However, the details of the linkage between the mutations and MPS I symptoms remain unknown because of the lack of a precise three-dimensional structure of hIDUA. To elucidate the molecular pathology of MPS I and to develop new structure-based drugs for this disease, we crystallized recombinant hIDUA and collected X-ray diffraction data to 2.3 Å resolution. Further, we prepared mercury-derivative crystals and successfully obtained a high-quality electron-density map through SIRAS (single isomorphous replacement with anomalous scattering) phasing.
2. Materials and methods
2.1. Protein preparation and crystallization
Recombinant hIDUA, expressed in Chinese hamster ovary (CHO) cells, was purchased from Genzyme Japan (marketed as Aldurazyme). The hIDUA was further purified on a Superdex 200 10/300 column (GE Healthcare) equilibrated with phosphate-buffered saline. The hIDUA-containing fractions, eluted at 14.5–15.5 ml, were pooled and concentrated with an Amicon Ultra (Millipore) with a pore size of 30 kDa, which resulted in an 8.0 mg ml−1 protein solution.
Initial crystallization screening was performed by hanging-drop vapour diffusion using Index and Crystal Screen 2 (Hampton Research), with drops consisting of 0.8 µl protein solution and 0.8 µl reservoir solution. The crystallization plates were kept at 288 K.
2.2. Preparation of heavy-atom derivatives
A heavy-atom derivative screening was carried out using Heavy Atom Screen Hg (Hampton Research). We prepared a number of 50 mM heavy-atom solutions, and then took 0.5 µl of each one and mixed it with 8 µl of a cryoprotectant solution, which resulted in a 3 mM heavy-atom solution. We transferred the crystal to a 2 µl drop of a heavy-atom solution and then the drop was vapour diffused against the reservoir solution for 12 h at 288 K. To obtain the high-quality data, we prepared an Hg derivative by co-crystallization as follows: 0.8 µl of the protein solution (4 mg ml−1) was mixed with 0.8 µl of the heavy-atom solution [0.2 M K/Na tartrate, 20%(w/v) PEG 3350, 2 mM ethylmercuric phosphate and 5%(v/v) glycerol], followed by microseeding and vapour diffusion against 0.4 ml of the reservoir solution [0.2 M K/Na tartrate, 20%(w/v) PEG 3350 and 5%(v/v) glycerol].
2.3. X-ray data collection
Prior to data collection, crystals were picked up and dipped in a cryoprotectant solution [0.1 M MES–Na, pH 6.5, 18%(w/v) PEG 3350, 0.18 M Na/K tartrate and 15%(v/v) glycerol] for 10 s, flash-cooled with liquid nitrogen and then stored until data collection. The native data set was collected on beamline NW12A at the Photon Factory Advanced Ring (Tsukuba, Japan) using an ADSC Q210r detector with a crystal-to-detector distance of 246.2 mm and a wavelength of 1.0000 Å. We collected 180 frames with an oscillation angle of 1.2° and an exposure time of 3 s per frame. We kept the crystal at 100 K during data collection with a liquid nitrogen gas stream. The mercury-derivative crystal data set was collected on BL-17A at the Photon Factory (Tsukuba, Japan) using an ADSC Q315r detector with a wavelength of 1.0084 Å. The peak wavelength for the Hg L III edge was determined by XAFS (X-ray absorption fine structure) measurement before the data collection. The crystal-to-detector distance was 448.5 mm, with an oscillation range of 1.2° per image, covering a total oscillation range of 360°. The diffraction data were processed with HKL-2000 (Otwinowski & Minor, 1997 ▶), and merged and scaled against the native data.
2.4. SIRAS phasing
Phases were calculated by the SIRAS method including a heavy-atom search with SHELXD (Sheldrick, 2010 ▶), followed by phasing with SHARP (de La Fortelle & Bricogne, 1997 ▶) and density modification with SOLOMON (Abrahams & Leslie, 1996 ▶). All calculations were performed automatically using an autoSHARP package (Vonrhein et al., 2007 ▶). The data-collection and phasing statistics are summarized in Table 1 ▶.
Table 1. Statistics of diffraction data collection and SIRAS phasing.
Values in parentheses are for the highest-resolution shell. FOM = figure of merit
| Crystal | Native | Hg peak |
|---|---|---|
| Data collection | ||
| Space group | R3 | R3 |
| Unit-cell parameters (Å) | a = 259.22 | a = 259.23 |
| b = 259.22 | b = 259.23 | |
| c = 71.83 | c = 71.68 | |
| X-ray source | PF AR-NW12A | PF BL-17A |
| CCD detector | ADSC Q210r | ADSC Q315r |
| Wavelength (Å) | 1.0000 | 1.0084 |
| Resolution (Å) | 40–2.3 (2.37–2.3) | 30–3.1 (3.21–3.10) |
| No. of observed reflections | 515171 | 375513 |
| No. of unique reflections | 78102 | 32378 |
| Multiplicity | 6.6 (4.4) | 11.6 (11.5) |
| Completeness (%) | 97.4 (80.6) | 100 (100) |
| 〈I〉/〈σ(I)〉 | 13.2 (3.0) | 24.2 (12.3) |
| R merge † (%) | 10.2 (46.8) | 9.2 (22.8) |
| Crystal mosaicity (°) | 0.377 | 0.482 |
| SIRAS phasing | ||
| Resolution (Å) | 30–3.1 | |
| No. of heavy atoms in asymmetric unit | 4 | |
| Phasing power (iso/ano) | 0.632/0.590 | |
| 〈FOM〉 (initial/after SOLOMON) | 0.294/0.947 | |
| Asymmetric unit content | 2 subunits |

 , where I
i(hkl) is the intensity of the ith measurement of reflection hkl and 〈I
i(hkl)〉 is the average value of I
i(hkl) for all i measurements.
3. Results and discussion
3.1. Crystallization of hIDUA
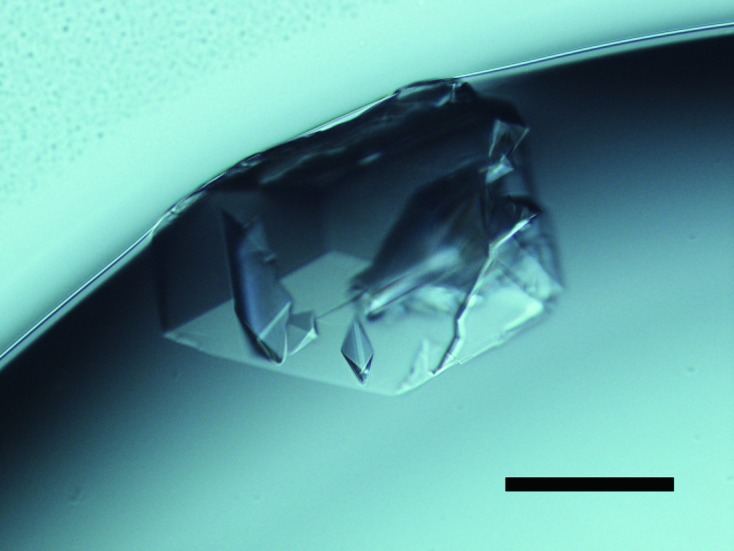
We successfully obtained a wedge-shaped crystal using Index No. 86 [0.2 M K/Na tartrate and 20%(w/v) PEG 3350] as the precipitant in 2–3 d. Next, in order to improve the crystal, we performed additive screening by adding 10% of each solution in the Crystal Screen 2 kit. Finally, the best crystals were grown with the conditions consisting of 90% of Index No. 86 and 10% of Crystal Screen 2 No. 26 [18%(w/v) PEG 3350, 0.18 M K/Na tartrate, 3%(w/v) PEG MME 5000, 0.02 M ammonium sulfate and 0.01 M MES–Na, pH 6.5] (Fig. 1 ▶).
Figure 1.

Crystal of hIDUA grown from 18%(w/v) PEG 3350, 0.18 M K/Na, tartrate, 3%(w/v) PEG MME 5000, 0.02 M ammonium sulfate and 0.01 M MES–Na, pH 6.5, at 288 K. Scale bar represents 0.1 mm.
Prior to our study, Ruth et al. (2000 ▶) performed a crystallization study on recombinant human IDUA expressed in CHO cells; they could not produce good-quality crystals, only spherulites of semi-crystalline protein, when using PEG 8K and phosphate as precipitants. We suppose that the different results are partly due to the fact that Index was not marketed in 2000. In this study, we also observed round semi-crystalline particles with several PEG 3350 conditions such as Index Nos. 87 to 92.
3.2. X-ray data collection
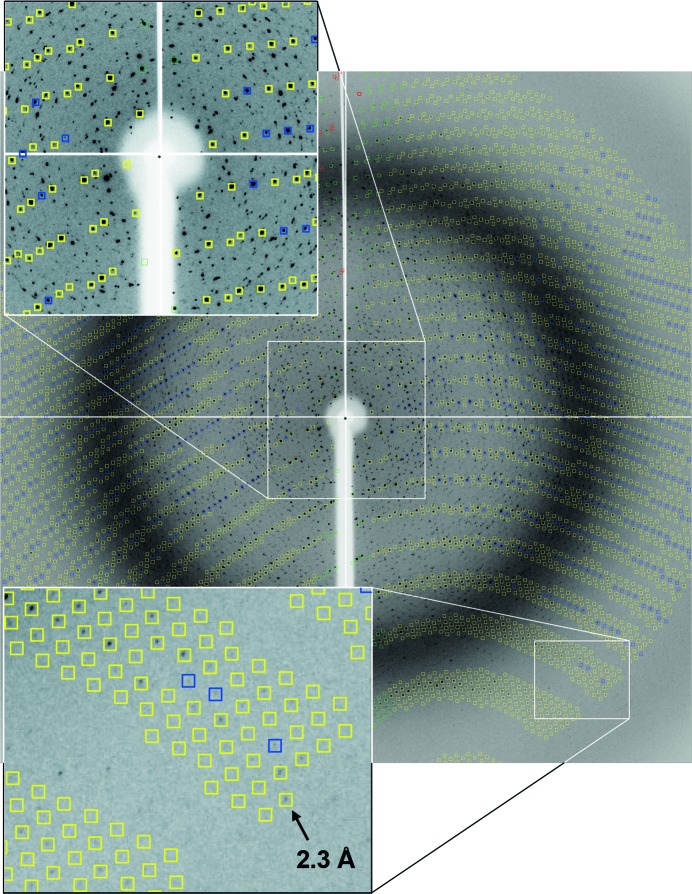
The best crystal data set was collected at the Photon Factory on beamline AR-NW12A at a wavelength of 1.0000 Å and diffracted to a maximum resolution of 2.3 Å. Although the crystal had small clusters on its surface and weak diffraction spots from the clusters were observed (Fig. 2 ▶), the major crystal was large enough for us to process it with a good value of R merge (10.2%), and no twinning was detected. The crystal belongs to space group R3 with cell parameters of a = b = 259.22, c = 71.83 Å.
Figure 2.
Representative X-ray diffraction image of native hIDUA collected with an oscillation angle of 1.2° and an exposure time of 3.0 s. Although many unassigned diffraction spots of small clusters were observed at lower resolution, the crystal diffracted up to 2.3 Å resolution.
3.3. Heavy-atom search and SIRAS phasing
Human IDUA belongs to the GH39 family in the CAZy classification (Henrissat & Davies, 1997 ▶). To date, only the crystal structure of bacterial β-xylosidase (XynB), which belongs to the same family, has been reported (Yang et al., 2004 ▶; Czjzek et al., 2005 ▶). Furthermore, Rempel et al. (2005 ▶) constructed a homology model of hIDUA (PDB code 1y24) based on the T. saccharolyticum XynB structure. First, we tried to solve the structure by molecular replacement with XynB or the homology model of IDUA, but no distinct solutions were obtained.
Next, we started heavy-atom-derivative screening. We tested Heavy Atom Screen Hg (Hampton Research), finding that ethylmercuric phosphate (EMP) bound to the protein and was suitable for phase determination. In order to collect high-quality heavy-atom data, we prepared Hg-derivative crystals by co-crystallization instead of soaking, because the crystals were so fragile that they tended to be damaged during the soaking operation.
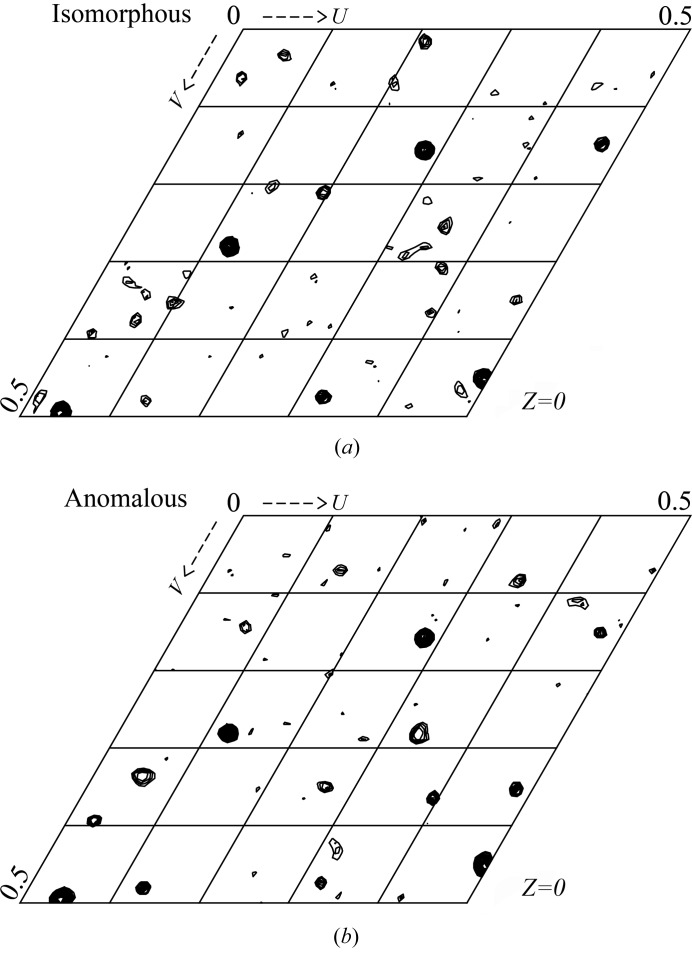
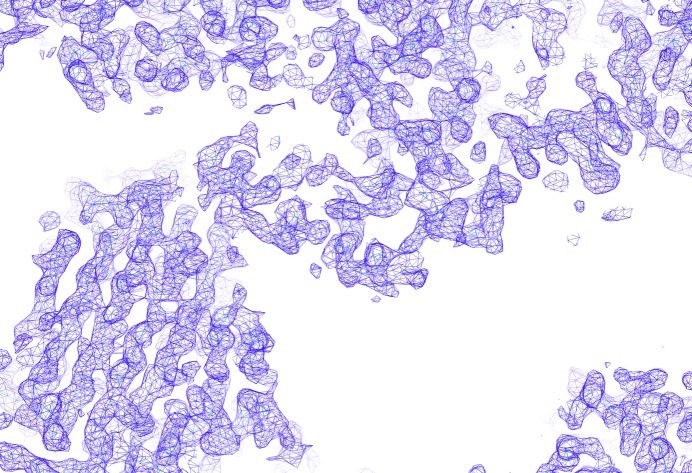
We collected a full data set (to a resolution of 3.1 Å) for an Hg-derivative crystal with the peak wavelength for the Hg L III edge (λ = 1.0084 Å) on PF BL-17A. The data were merged and scaled to the native data, followed by initial phasing calculation with the SIRAS method. We could observe distinct peaks in the Harker sections of both isomorphous and anomalous Patterson maps (Fig. 3 ▶), and a subsequent heavy-atom search indicated four mercury atoms per asymmetric unit. After the density modification, we had a high-quality interpretable map (Fig. 4 ▶). According to the optimal solvent content estimation by autoSHARP (Vonrhein et al., 2007 ▶), there are two subunits per asymmetric unit, with a solvent content of 55% and a V M value of 3.31 Å3 Da−1 (Matthews, 1968 ▶). The refinement of the hIDUA structure is now underway. The details of the structure and a catalytic description of hIDUA will be published elsewhere.
Figure 3.
The Harker sections (Z = 0) of (a) isomorphous and (b) anomalous difference Patterson maps (contoured at 1.75σ), with the highest peak σ of 10.8σ and 12.1σ, respectively. The maps were calculated within the resolution range of 25–5 Å.
Figure 4.
Experimental electron-density map (contoured at 1σ) calculated from the SIRAS phase after solvent flattening. The figure was prepared with Coot (Emsley et al., 2010 ▶).
Acknowledgments
We thank the beamline staff at the Photon Factory for supporting the data collection under proposal Nos. 2009 G074 and 2011 G135. This work was partly supported by Grants-in-Aid for Young Scientists (grant No. 20770085) and Scientific Research (grant No. 23570139) from the Ministry of Education, Culture, Sports, Science and Technology, Japan, to NM.
References
- Abrahams, J. P. & Leslie, A. G. W. (1996). Acta Cryst. D52, 30–42. [DOI] [PubMed]
- Czjzek, M., Ben David, A., Bravman, T., Shoham, G., Henrissat, B. & Shoham, Y. (2005). J. Mol. Biol. 353, 838–846. [DOI] [PubMed]
- Emsley, P., Lohkamp, B., Scott, W. G. & Cowtan, K. (2010). Acta Cryst. D66, 486–501. [DOI] [PMC free article] [PubMed]
- Henrissat, B. & Davies, G. (1997). Curr. Opin. Struct. Biol. 7, 637–644. [DOI] [PubMed]
- Kakkis, E. D., Muenzer, J., Tiller, G. E., Waber, L., Belmont, J., Passage, M., Izykowski, B., Phillips, J., Doroshow, R., Walot, I., Hoft, R. & Neufeld, E. F. (2001). N. Engl. J. Med. 344, 182–188. [DOI] [PubMed]
- Kang, T. S. & Stevens, R. C. (2009). Hum. Mutat. 30, 1591–1610. [DOI] [PubMed]
- La Fortelle, E. de & Bricogne, G. (1997). Methods Enzymol. 276, 472–494. [DOI] [PubMed]
- Matte, U., Yogalingam, G., Brooks, D., Leistner, S., Schwartz, I., Lima, L., Norato, D. Y., Brum, J. M., Beesley, C., Winchester, B., Giugliani, R. & Hopwood, J. J. (2003). Mol. Genet. Metab. 78, 37–43. [DOI] [PubMed]
- Matthews, B. W. (1968). J. Mol. Biol. 33, 491–497. [DOI] [PubMed]
- Neufeld, E. F. & Muenzer, J. (1989). The Metabolic Basis of Inherited Disease, edited by C. R. Scriver, M. C. Beaudet, W. S. Sly & D. Valle, pp. 1565–1587. New York: McGraw-Hill.
- Otwinowski, Z. & Minor, W. (1997). Methods Enzymol. 276, 307–326. [DOI] [PubMed]
- Rempel, B. P., Clarke, L. A. & Withers, S. G. (2005). Mol. Genet. Metab. 85, 28–37. [DOI] [PubMed]
- Ruth, L., Eisenberg, D. & Neufeld, E. F. (2000). Acta Cryst. D56, 524–528. [DOI] [PubMed]
- Scott, H. S., Bunge, S., Gal, A., Clarke, L. A., Morris, C. P. & Hopwood, J. J. (1995). Hum. Mutat. 6, 288–302. [DOI] [PubMed]
- Sheldrick, G. M. (2010). Acta Cryst. D66, 479–485. [DOI] [PMC free article] [PubMed]
- Vonrhein, C., Blanc, E., Roversi, P. & Bricogne, G. (2007). Methods Mol. Biol. 364, 215–230. [DOI] [PubMed]
- Yang, J. K., Yoon, H. J., Ahn, H. J., Lee, B. I., Pedelacq, J. D., Liong, E. C., Berendzen, J., Laivenieks, M., Vieille, C., Zeikus, G. J., Vocadlo, D. J., Withers, S. G. & Suh, S. W. (2004). J. Mol. Biol. 335, 155–165. [DOI] [PubMed]
- Yogalingam, G., Guo, X. H., Muller, V. J., Brooks, D. A., Clements, P. R., Kakkis, E. D. & Hopwood, J. J. (2004). Hum. Mutat. 24, 199–207. [DOI] [PubMed]


