

Abstract
A strategy based on fluorescence resonance energy transfer (FRET) to transform a red-emitting fluorophore into a ratiometric indicator for mitochondrial ZnII is demonstrated.
The proper functions of zinc(II)-dependent biomolecules are sensitively affected by the availability of zinc(II).1–4 Therefore, homeostasis of zinc(II)–the ability to adjust zinc(II) distribution and to mediate zinc(II) transport on demand–is critical in maintaining the well-being of organisms.5 The disruption of zinc(II) homeostasis leads to diseases,6 ranging from developmental disorders to neurodegenerative diseases.7
Motivated by the challenge of determining the distribution and dynamics of zinc(II) in living specimens, significant efforts have been put forth to quantify and to image free, or mobile zinc(II)8 in vivo and in vitro.9–11 Fluorescence-based methods have received considerable attention due to its adequately high spatial and temporal resolutions and the rapidly growing sophistication and accessibility of fluorescence microscopes. 12,13 To complement fluorescence microscopy, fluorescent indicators for zinc(II) are created based on innovative applications of metal coordination-dependent excited state relaxation processes of fluorophores.14 Various excited state occurrences, such as internal charge transfer, photo-induced electron transfer, excited state proton transfer, and fluorescence resonance energy transfer (FRET), have been integrated into fluorescent indicators targeting zinc(II).15
The remaining challenges in the area of zinc(II) indicator development include the following two issues that this work aims to address. (1) High spatial resolution is one of the most distinctive advantages of fluorescence microscopy over other imaging methods.10,16 Therefore, fluorescent indicators with defined subcellular localization properties would maximize the impact of fluorescence microscopy in imaging applications. Thus far, only a few synthetic indicators are reported to target organellar zinc(II).17,18 Genetically encoded indicators for organellar zinc(II) based on a similar strategy for engineering calcium(II) sensor Cameleon have also appeared.19–21
(2) Fluorescent indicators with red emission (λem close to or > 600 nm) are desirable partly because their spectral windows lie outside the range of autofluorescence of biological specimens. The development of red-emitting indicators for zinc(II) has been based on the functionalization of a fluorophore structure with a zinc(II) coordinating ligand.22–28 This practice has largely been a trial-and-error process in which the effects of functionalization on the photophysical properties of the fluorophore are hardly predictable. In this work, we present a general strategy to transform a red fluorophore into an indicator that targets mitochondrial zinc(II).
The designed molecule consists of a FRET donor–acceptor pair and a mitochondrial targeting moiety (Fig. 1). The FRET donor is a charge-transfer type fluorophore which binds zinc(II) to result in a bathochromic shift of emission. The spectral overlap between donor and acceptor grows upon zinc(II) coordination, thus enhancing the efficiency of FRET. To deliver the probe selectively to mitochondria, a lipophilic triphenylphosphonium (TPP) moiety, which is a known mitochondrial targeting functionality,29 is attached through an alkyl chain to the indicator. A handful of mitochondrial targeting fluorescent indicators have been constructed using the TPP-tagging strategy,30 including a case of indicator for zinc(II) by Cho et al. which was published while this manuscript was in preparation.18
Fig. 1.
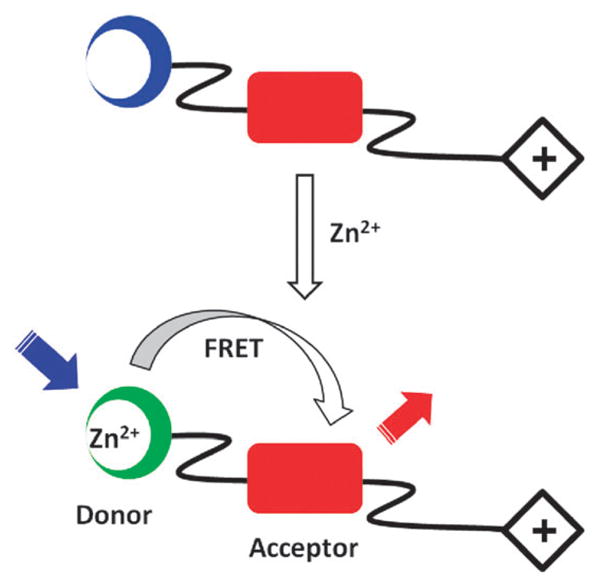
Strategy for transforming a red fluorophore (red rectangle) into a zinc(II) indictor via zinc(II)-induced FRET. Blue and green circles represent free and bound FRET-donor. Blue and red arrows represent blue excitation and red emission, respectively. Diamond “+” on the right: a lipophilic mitochondrial-targeting cation.
In this work, 5-(4-methoxystyryl)-5′-methyl-2,2′-bipyridine (1)31 and diamino-substituted naphthalenediimide (NDI, red in Fig. 2)32 were selected as the FRET donor and acceptor, respectively (Fig. 2). The charge-transfer excited state of compound 1 can be stabilized via metal coordination at the bipy site.31,33 Consequently, upon addition of zinc(II) to a solution of 1, its emission spectrum undergoes a bathochromic shift (from blue to green in Fig. S1, ESI†) to enable a significant spectral overlap between the emission of zinc(II)-bound 1 and the S0→S1 absorption band of NDI dye 2 (Fig. S1, ESI†). NDI was chosen as the acceptor due to its synthetic versatility, where each of the four sides of NDI can be functionalized individually, and its tunable fluorescence properties.34 When 1 and 2 are covalently assembled to afford compound 4, the efficiency of intramolecular FRET in 4 is expected to be a function of zinc(II) concentration.
Fig. 2.

Structures of zinc(II) indicators (4, 5) and model systems (1–3).
The syntheses of the separate FRET donor and acceptor systems (1–3) and indicators for zinc(II) (4, 5) are described in the ESI.† Absorption spectrum of indicator 4 in CH3CN consists of two bands over 300 nm (Fig. 3a, blue trace). The band centered at 346 nm corresponds to the absorption of the bipy-containing FRET donor moiety, which we term the D band. The band centered at 600 nm corresponds to the NDI moiety which is termed the A band. Upon addition of increasing amount of ZnCl2, as a result of zinc(II) coordination at the bipy moiety, the charge-transfer D band undergoes a bathochromic shift from 346 nm to 370 nm. The A band, meanwhile, experiences a slight hypochromic shift.
Fig. 3.

(a) Absorption spectra for the titration of 4 (3.0 μM) with ZnCl2 (0–18 μM) in CH3CN. (b) Fluorescence spectral change of 4 (3.0 μM) with different concentrations of ZnCl2 (0–18 μM) in CH3CN (λex 400 nm).
The fluorescence titration profile of 4 with ZnCl2 upon excitation at 400 nm is shown in Fig. 3b. The spectrum of 4 exhibits a weak emission at 630 nm. This signal may have arisen from the direct excitation of the NDI component. Upon addition of increasing amount of ZnCl2 from 0–18 μM, the emission at 630 nm intensifies, and reaches saturation with 12-fold enhancement in integrated intensity (see Table S1 of the ESI for spectroscopic data†). However, when NDI is directly excited at 600 nm, the intensity is not affected much by the variation of zinc(II) concentration ([Zn2+]) (Fig. S3, ESI†). These observations are consistent with the involvement of a zinc(II)-modulated intramolecular excitation energy transfer process. Furthermore, the differed sensitivity to excitation wavelength of 4 offers an opportunity to correlate [Zn2+] and fluorescence change ratiometrically.35 As shown in Fig. S4, ESI,† the ratio of integrated fluorescence upon excitation at 400 and 600 nm is sensitively dependent on [Zn2+]. This correlation is independent of the concentration of indicator 4 in the linear portion of the calibration curve.
The sensitized excitation of the NDI moiety in 4 when excited at 400 nm is supported by the observation of the following control experiment. ZnCl2 was titrated into a mixture of compounds 1 and 2 of equal concentration (2.5 μM) while the emission spectra were collected upon excitation at 400 nm. Only a weak band of NDI was seen at the beginning of the titration which was quickly overwhelmed by the growing green emission from [Zn(1)]2+ (Fig. S5, ESI†). In compound 4 however, the excitation energy of the zinc(II)-bound donor portion, which is equivalent to [Zn(1)]2+, is captured by the NDI acceptor, which emits instead to result in the observations in Fig. 3b.
The fluorescence dependence of 4 on the identity of metal ion was evaluated (Fig. S7, ESI†). The alkali and alkaline earth metal ions that are abundant in biological systems do not elicit a fluorescence response of 4. Although manganese(II) and lead(II) are known to bind bipy, they fail to alter the fluorescence of 4. Not surprisingly, cadmium(II) acts similarly to zinc(II) in resulting strong fluorescence from NDI, whereas iron(II) and copper(II) quench fluorescence. The observed metal ion selectivity can be understood based on the Irvin-Williams series and HSAB theory. Although cadmium(II), iron(II), and copper(II) are potential interfering ions, the applicability of 4 in microscopic imaging experiments shall not be significantly compromised due to the low abundances of these ions in biological specimens.
The titration experiments using indicator 4 were also carried out in an aqueous/organic mixed solvent (1 : 9 MOPS buffer (pH 7.2)/CH3CN). Compound 4 shows a 3-fold fluorescence enhancement on increasing [Zn2+] (Fig. S9, ESI†). Compared to the observations in CH3CN, the fluorescence is rather dim. The loss of fluorescence can be explained by the hydrogen bonding interaction between the protic solvent and the carbonyl groups on NDI, which provides a non-radiative deactivation pathway.32
The pKa of compound 1, which is also the ionophore of compound 4, is 4.6. The intensity of 1 exhibits little change in the range of pH 6.0–9.0 (Fig. S10, ESI†). By extension, the fluorescence of 4 and 5 would not be affected by the fluctuations of pH within the physiological range.
To equip the indicator with mitochondrial targeting capability, we installed the triphenylphosphonium (TPP) group on 2 and 4 to afford indicators 3 and 5, respectively. The colocalization properties of red-emitting 2–5 were studied using HeLa (S3) cells transfected with mCerulean3 TOMM-20, a cyan fluorescent protein (CFP) fused with a mitochondrial targeting sequence whose emission is shown in the green channel (Fig. 4A and D). Lacking the TPP group, compound 4 forms particulates intracellularly (Fig. 4E) which show poor colocalization with the CFP (Fig. 4F). The overall intracellular fluorescence intensity from compound 4 is low, which is consistent with the observed weak fluorescence of the NDI fluorophore in aqueous solutions. The TPP-containing 5 (Fig. 4B), on the other hand, localizes selectively in mitochondria (Fig. 4C) and displays a surprisingly strong intracellular fluorescence relative to that of 4. Similar contrast was observed between the model compounds 2 and 3 (Fig. S15, ESI†). The strong fluorescence of intracellular 5 may be attributed to the dispersion of the indicator molecules into the inner mitochondrial membrane29 or a relatively organic-like mitochondrial matrix. Further investigation to account for this observation is ongoing.
Fig. 4.

Confocal fluorescence images of living HeLa (S3) cells transfected with mCerulean3 TOMM-20 that were incubated with 5 (1.8 μM, A–C) and 4 (6.0 μM, D–F) for 30 min. Left: green channel, λex 405 nm, λem 425–475 nm; middle: red channel, λex 543 nm, λem 580–680 nm; right: merged image. Scale bar: 10 μm.
The ability of indicator 5 to report mitochondrial zinc(II) variation is demonstrated in Fig. 5. Upon excited at 405 nm, the addition of supplemental zinc(II) in the growth media (DMEM) leads to an increase in intramolecular fluorescence of 5 that largely localizes in mitochondria. The addition of compound 5 to the group of few synthetic indicators that target mitochondrial zinc(II)17,18,22 shall aid the characterization of mitochondrial zinc(II) which is intimately correlated to the chemistry of reactive oxygen species (ROS).36
Fig. 5.
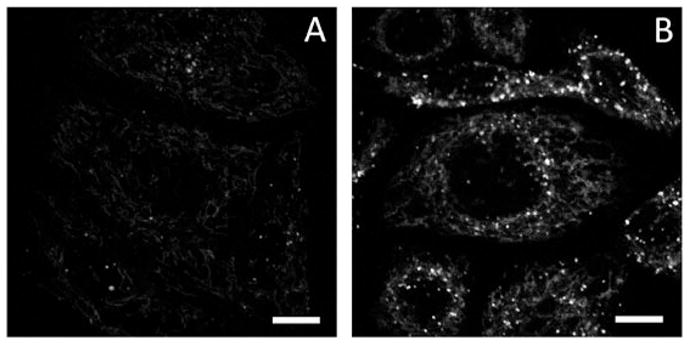
Fluorescence images ofHeLa (S3) cells incubated with compound 5 (1.8 μM). (A) No zinc(II) added, and (B) in the presence of 50 μMZnCl2. A 405 nm diode laser line was used for excitation. λem 580–680 nm. Scale bar: 10 μm. The DIC images are included in Fig. S16, ESI.†
In summary, the conversion of a red-emitting fluorophore to a zinc(II)-responding indicator using a FRET-based strategy is demonstrated. The diamino-substituted NDI dye, which has not drawn much attention in intracellular applications,28 performs well as the fluorophore in indicator 5. In addition to red-emitting, compound 5 offers attractive features including a large spectral separation between excitation and emission, little pH sensitivity within the physiological window, ratiometric imaging capability, and defined subcellular localization preference. The ongoing work includes the application of the reported FRET strategy to convert other red-emitting fluorophores into ion indicators, as well as strategy development for targeting other subcellular organelles.
Supplementary Material
Footnotes
Electronic supplementary information (ESI) available: Experimental procedures and additional spectra. See DOI: 10.1039/c1cc14580k
Contributor Information
Michael W. Davidson, Email: davidson@magnet.fsu.edu.
Lei Zhu, Email: lzhu@chem.fsu.edu.
Notes and references
- 1.Lippard SJ, Berg JM. Principles of Bioinorganic Chemistry. University Science Books; Mill Valley, CA: 1994. [Google Scholar]
- 2.Vallee BL, Falchuk KH. Psychological Reports. 1993;73:79. [Google Scholar]
- 3.Berg JM, Shi Y. Science. 1996;271:1081. doi: 10.1126/science.271.5252.1081. [DOI] [PubMed] [Google Scholar]
- 4.Lipscomb WN, Sträter N. Chem Rev. 1996;96:2375. doi: 10.1021/cr950042j. [DOI] [PubMed] [Google Scholar]
- 5.Maret W. BioMetals. 2001;14:187. [Google Scholar]
- 6.J Nutr. 2000;130:14715S–1483S. [Google Scholar]
- 7.Frederickson CJ, Koh JY, Bush AI. Nat Rev Neurosci. 2005;6:449. doi: 10.1038/nrn1671. [DOI] [PubMed] [Google Scholar]
- 8.Krężel A, Maret W. JBIC, J Biol Inorg Chem. 2006;11:1049. doi: 10.1007/s00775-006-0150-5. [DOI] [PubMed] [Google Scholar]
- 9.Que EL, Domaille DW, Chang CJ. Chem Rev. 2008;108:1517. doi: 10.1021/cr078203u. [DOI] [PubMed] [Google Scholar]
- 10.McRae R, Bagchi P, Sumalekshmy S, Fahrni CJ. Chem Rev. 2009;109:4780. doi: 10.1021/cr900223a. [DOI] [PMC free article] [PubMed] [Google Scholar]
- 11.Tomat E, Lippard SJ. Curr Opin Chem Biol. 2010;14:225. doi: 10.1016/j.cbpa.2009.12.010. [DOI] [PMC free article] [PubMed] [Google Scholar]
- 12.Nolan EM, Lippard SJ. Acc Chem Res. 2009;42:193. doi: 10.1021/ar8001409. [DOI] [PMC free article] [PubMed] [Google Scholar]
- 13.Xu Z, Yoon J, Spring DR. Chem Soc Rev. 2010;39:1996. doi: 10.1039/b916287a. [DOI] [PubMed] [Google Scholar]
- 14.de Silva AP, Gunaratne HQN, Gunnlaugsson T, Huxley AJM, McCoy CP, Rademacher JT, Rice TE. Chem Rev. 1997;97:1515. doi: 10.1021/cr960386p. [DOI] [PubMed] [Google Scholar]
- 15.Chang CJ, Lippard SJ. Met Ions Life Sci. 2006;1:321. [Google Scholar]
- 16.Fernández-Suárez M, Ting AY. Nat Rev Mol Cell Biol. 2008;9:929. doi: 10.1038/nrm2531. [DOI] [PubMed] [Google Scholar]
- 17.Tomat E, Nolan EM, Jaworski J, Lippard SJ. J Am Chem Soc. 2008;130:15776. doi: 10.1021/ja806634e. [DOI] [PMC free article] [PubMed] [Google Scholar]
- 18.Masanta G, Lim CS, Kim HJ, Han JH, Kim HM, Cho BR. J Am Chem Soc. 2011;133:5698. doi: 10.1021/ja200444t. [DOI] [PubMed] [Google Scholar]
- 19.Dittmer PJ, Miranda JG, Gorski JA, Palmer AE. J Biol Chem. 2009;284:16289. doi: 10.1074/jbc.M900501200. [DOI] [PMC free article] [PubMed] [Google Scholar]
- 20.Vinkenborg JL, Nicolson TJ, Bellomo EA, Koay MS, Rutter GA, Merkx M. Nat Methods. 2009;6:737. doi: 10.1038/nmeth.1368. [DOI] [PMC free article] [PubMed] [Google Scholar]
- 21.Qin Y, Dittmer PJ, Park JG, Jansen KB, Palmer AE. Proc Natl Acad Sci U S A. 2011;108:7351. doi: 10.1073/pnas.1015686108. [DOI] [PMC free article] [PubMed] [Google Scholar]
- 22.Sensi SL, Ton-That D, Weiss JH, Rothe A, Gee KR. Cell Calcium. 2003;34:281. doi: 10.1016/s0143-4160(03)00122-2. [DOI] [PubMed] [Google Scholar]
- 23.Kiyose K, Kojima H, Urano Y, Nagano T. J Am Chem Soc. 2006;128:6548. doi: 10.1021/ja060399c. [DOI] [PubMed] [Google Scholar]
- 24.Tang B, Huang H, Xu K, Tong L, Yang G, Liu X, An L. Chem Commun. 2006:3609–3611. doi: 10.1039/b606809j. [DOI] [PubMed] [Google Scholar]
- 25.Atilgan S, Ozdemir T, Akkaya EU. Org Lett. 2008;10:4065. doi: 10.1021/ol801554t. [DOI] [PubMed] [Google Scholar]
- 26.Xue L, Liu C, Jiang H. Chem Commun. 2009:1061. doi: 10.1039/b814501f. [DOI] [PubMed] [Google Scholar]
- 27.Du P, Lippard SJ. Inorg Chem. 2010;49:10753. doi: 10.1021/ic101569a. [DOI] [PMC free article] [PubMed] [Google Scholar]
- 28.Lu X, Zhu W, Xie Y, Li X, Gao Y, Li F, Tian H. Chem–Eur J. 2010;16:8355. doi: 10.1002/chem.201000461. [DOI] [PubMed] [Google Scholar]
- 29.Murphy MP, Smith RAJ. Annu Rev Pharmacol. 2007;47:629. doi: 10.1146/annurev.pharmtox.47.120505.105110. [DOI] [PubMed] [Google Scholar]
- 30.Dickinson BC, Chang CJ. J Am Chem Soc. 2008;130:9638. doi: 10.1021/ja802355u. [DOI] [PMC free article] [PubMed] [Google Scholar]
- 31.Younes AH, Zhang L, Clark RJ, Zhu L. J Org Chem. 2009;74:8761. doi: 10.1021/jo901889y. [DOI] [PubMed] [Google Scholar]
- 32.Würthner F, Ahmed S, Thalacker C, Debaerdemaeker T. Chem–Eur J. 2002;8:4742. doi: 10.1002/1521-3765(20021018)8:20<4742::AID-CHEM4742>3.0.CO;2-L. [DOI] [PubMed] [Google Scholar]
- 33.Wandell RJ, Younes AH, Zhu L. New J Chem. 2010;34:2176. [Google Scholar]
- 34.Thalacker C, Röger C, Würthner F. J Org Chem. 2006;71:8098. doi: 10.1021/jo0612269. [DOI] [PubMed] [Google Scholar]
- 35.Carol P, Sreejith S, Ajayaghosh A. Chem–Asian J. 2007;2:338. doi: 10.1002/asia.200600370. [DOI] [PubMed] [Google Scholar]
- 36.Sensi SL, Ton-That D, Sullivan PG, Jonas EA, Gee KR, Kaczmarek LK, Weiss JH. Proc Natl Acad Sci U S A. 2003;100:6157. doi: 10.1073/pnas.1031598100. [DOI] [PMC free article] [PubMed] [Google Scholar]
Associated Data
This section collects any data citations, data availability statements, or supplementary materials included in this article.