Abstract
The receptive fields of on- and off-centre parasol cell mosaics independently tile the retina to ensure efficient sampling of visual space. A recent theoretical model represented the on- and off-centre mosaics by noisy hexagonal lattices of slightly different density. When the two lattices are overlaid, long-range Moiré interference patterns are generated. These Moiré interference patterns have been suggested to drive the formation of highly structured orientation maps in visual cortex. Here we show that noisy hexagonal lattices do not capture the spatial statistics of parasol cell mosaics. An alternative model based upon local exclusion zones, termed the pairwise interaction point process (PIPP) model, generates patterns that are statistically indistinguishable from parasol cell mosaics. A key difference between the PIPP model and the hexagonal lattice model is that the PIPP model does not generate Moiré interference patterns, and hence simulated orientation maps do not show any hexagonal structure. Finally, we estimate the spatial extent of spatial correlations in parasol cell mosaics to be only 200–350 μm, far less than that required to generate Moiré interference. We conclude that parasol cell mosaics are too disordered to drive the formation of highly structured orientation maps in visual cortex.
Keywords: Hexagonal lattices, Retinal mosaics, Receptive fields, Orientation selectivity, PIPP model
Introduction
Retinal neurons are spatially arranged in what are commonly termed “retinal mosaics” due to the way that their cell bodies and dendrites tile the retina (Wässle et al., 1981a,b). These non-random spatial distributions of somas and dendrites are thought to ensure that the visual world is efficiently processed and that non-random arrangements may help in the developmental process of wiring up the retina (Galli-Resta, 2002). These retinal mosaics are usually spatially independent, such that there are no spatial relationships between cell bodies of different type. This has been confirmed for a wide range of different neuronal types (Rockhill et al., 2000; Diggle et al., 2006; Eglen & Wong, 2008). In particular, the spatial positioning of the cell bodies of on- and off-centre beta retinal ganglion cells (RGCs) show no spatial relationship to each other, beyond that constrained by cell bodies not overlapping (Eglen et al., 2005).
These anatomical studies of RGC arrays have demonstrated little support for the idea of an underlying regular, crystalline, structure. Recently, however, multi-electrode recordings have shown that the functional receptive fields of individual types of RGCs tile the retina (Gauthier et al., 2009) in a more regular fashion than either RGC cell bodies or dendritic trees. A recent modelling study (Paik & Ringach, 2011) proposes that these regular receptive field mosaics play a role in the development of highly structured orientation maps in visual cortex. Given a population of on-centre neurons arranged in a noisy hexagonal lattice, and likewise for the off-centre neurons, when the two lattices are overlaid, long-range Moiré interference patterns are generated. These hexagonal lattices, representing the RGC receptive field centres were used as input to a statistical model of wiring from the retina to the cortex (Soodak, 1987; Ringach, 2004, 2007), summarised in Figure 1. The long-range interference patterns were proposed to drive the generation of regular distributions of orientation pinwheels in visual cortex (Paik & Ringach, 2011, 2012). Such regular pinwheel distributions have been suggested to exist in a range of species (Paik & Ringach, 2011).
Figure 1.
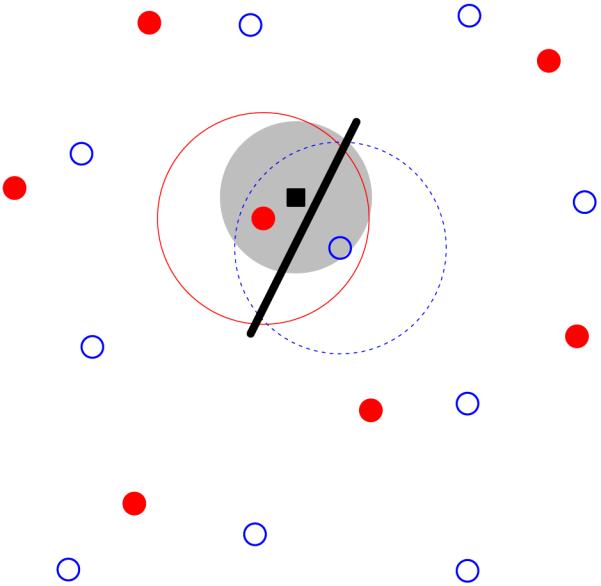
Overview of the statistical wiring model. The receptive field midpoints of on- and off-centre RGCs (filled red circles and open blue circles respectively) are arranged in semi-regular mosaics. A regular array of cortical neurons (one shown as black square) is overlaid on top of this population. A cortical unit receives input from RGCs whose receptive field centres are within a given range (large filled grey circle) of the cortical neuron, inversely proportional to the lateral distance from the cortical neuron. This cortical unit receives strong input from one on-centre and one off-centre RGC. These RGCs have Gaussian receptive field profiles (large circles surrounding the two RGCs); the cortical unit thus has an oriented receptive field summarised by the thick black line.
The long-range (> 1 mm) Moiré interference patterns generated by hexagonal lattices effectively suggest that there are long-range correlations in the positioning of the receptive fields of RGCs. Here we use statistical techniques to evaluate how well two competing models can account for the observed spatial distribution of receptive fields. In particular, we compare the hexagonal lattice model with that of a different model where neurons are positioned randomly subject only to exclusion zone constraints; these exclusion zone models have previously been shown to account for a wide range of patterns (Galli-Resta et al., 1997, 1999; Cellerino et al., 2000). We find that exclusion zone models, but not hexagonal lattice models, can quantitatively account for the observed distributions of receptive field centres. We show that the prediction that retinal mosaics drive the formation of regularly-spaced pinwheels in visual cortex critically depends on the long-range correlations generated by the hexagonal lattices. We also estimate the distance over which receptive field centres are correlated from the observed receptive fields. We find no evidence for long-range (> 250 μm) correlations in either observed data or exclusion zone models, and extensive (> 3 mm) correlations in the low noise hexagonal lattice models. We therefore conclude that parasol cell mosaics are too disordered to drive the formation of regular patterns of pinwheels.
Materials and Methods
Data sets
Two published data sets of primate parasol cells were analysed: (1) F07: on- and off-centre parasol cells (Fig. 3 of Field & Chichilnisky, 2007); (2) G09: on- and off-centre parasol cells (Fig. 2A, B of Gauthier et al., 2009)). The receptive field centre of each ganglion cell was calculated after thresholding the images. For field G09, the relative positioning of the on- and off-centre maps could be determined from their borders. No common border reference was available for field F07 as the receptive fields were recorded separately. One on-centre midget cell map was also analysed (Gauthier et al., 2009, Fig. 2C). This map has a higher density of receptive fields than the parasol cell maps, but several cells were missing from the map. We therefore restricted our analysis of this map to autocorrelation, which is robust to undersampling (Cook, 1996). For the analysis of retinal mosaics, each cell is represented by the midpoint of its receptive field.
Figure 2.
Spatial statistics of the observed off-centre receptive field mosaic (Gauthier et al., 2009) (column 1) and three different models (columns 2–4). A, Central region of the mosaics. Each point denotes one receptive field midpoint, and is surrounded by its Voronoi polygon. Scale bar: 250 μm. B, Autocorrelogram of the points in A, with annuli drawn 25 μm apart. C, The G function is the cumulative distribution of nearest-neighbour distances. For the models, the grey region shows the 95% confidence interval of distributions from each model, and the solid line reflects the data (also shown in column 1). D, L functions for data and models, drawn in the same format as for panel C. The dashed line indicates the expectation for CSR, L(t) = t. E, Topological disorder μ2 for 99 simulations (black dots) and for the data (horizontal line).
Simulations of retinal mosaics
We have used the hexagonal lattice model of Paik & Ringach (2011). For one mosaic, the lattice separation d is specified in μm. We have set d to generate the same number of points as observed in a given area (Table 1). Noise is added to the position of each point in the lattice by drawing samples from the bivariate Normal distribution where the standard deviation σ is expressed as a fraction of the lattice separation. When overlaying the on- and off-centre mosaics, one map can be rotated by angle θ relative to the other.
Table 1.
Parameter values for each parasol cell mosaic. The number of points and the area of each field was measured from the previous publications (Field & Chichilnisky 2007; Gauthier et al., 2009). RI denotes the nearest-neighbour regularity index (Wassle & Riemann, 1978). σlo and σhi are the low and high noise levels for the hexagonal lattice simulations.
| Hex lattice |
PIPP |
|||||||
|---|---|---|---|---|---|---|---|---|
| Field | N | Area (mm2) |
RI | d (μm) |
σlo | σhi | ϕ (μm) |
α |
| G09 ON | 89 | 1.90 | 8.9 | 157 | 0.12 | 0.23 | 130 | 14.5 |
| G09 OFF | 117 | 2.04 | 9.1 | 142 | 0.11 | 0.23 | 125 | 13.0 |
| F07 ON | 76 | 2.85 | 8.2 | 208 | 0.12 | 0.21 | 183 | 13.0 |
| F07 OFF | 60 | 2.07 | 11.1 | 200 | 0.11 | 0.24 | 162 | 20.0 |
The pairwise interaction point process (PIPP) model is simulated as before (Eglen et al., 2005). We assume statistical independence between the on- and off-centre mosaics as in principle receptive field midpoints from cells of different type can be the same. (This is to be compared with functional independence previously described for cell body mosaics (Eglen et al., 2005; Diggle et al., 2006).) This means that the on- and off-centre mosaics are simulated separately and then overlaid to produce a combined mosaic. To simulate one field, we specify the interaction function h(u) as:
| (1) |
where u is the distance between two points. The two parameters (α, ϕ) control the size of exclusion zone around each point and were chosen by trial-and-error to reproduce the observed spatial patterns. The parameters used for each map are listed in Table 1.
Analysis of retinal mosaics
Established methods were used to quantify the degree of patterning in the observed and simulated mosaics. We also analyse patterns of complete spatial randomness (CSR) as a control for these measures:
Voronoi polygons were computed for each point (Fortune, 1987).
- Topological disorder, μ2, (Kram et al., 2010) was quantified using:
where Pn is the probability of a Voronoi polygon having n edges. Only Voronoi polygons that did not overlap with the boundary of the sample window were used to estimate Pn. For a perfect hexagonal lattice, all Voronoi polygons will have 6 edges, and hence μ2 = 0. The larger the value of μ2, the more disordered the pattern. The expectation for CSR is μ2 = 1.78 (Tanemura, 2003). Autocorrelograms show the relative displacement between any pair of points within a field (Rodieck, 1991). The central portion of the autocorrelogram is typically empty, indicating exclusion zones around each point, so that no two points are too close to each other.
For each point in a mosaic, the distance to its nearest-neighbour was calculated. The G function is the cumulative distribution of these distances (Eglen et al., 2005). The steeper the curve, the more regular the pattern.
The L function is the (scaled) expectation of the number of points observed within a given distance of any point (Ripley, 1976; Eglen et al., 2005). For patterns with no spatial structure, we would expect L(t) = t. For regularly spaced patterns, we would expect L(t) < t for small values of t.
Statistical analysis
To evaluate the fit between observed mosaics and simulations, we have calculated Monte Carlo P values using established methods (Diggle, 1986; Eglen et al., 2005). Each model is run, using the same parameters but with different random numbers, 99 times. Each field (both observed and simulated) is then compared against the other 99 fields, and a measure T calculated. The 100 T values are sorted, and the rank of the T measure corresponding to the observed field is divided by 100 to calculate a P value. P values of 0.05 and smaller indicate that the model does not fit the observed data at the 5% significance level. The smallest P value calculated is thus 0.01 with 99 simulations. In addition for the L and G functions, we have drawn the 95% confidence levels from the simulations. Informally, if the measure from the observed mosaics (solid lines in Fig. 2) falls within the confidence intervals (dashed lines), then the model is a good fit to the observed mosaic.
For the topological disorder parameter, μ2, we plot, as dots, μ2,i for i = 2 … n + 1 simulated mosaics (here n = 99) along with μ2,1 of the observed field as a horizontal line. For a good fit between model and data, μ2,1 should fall within the distribution of simulated values. To compute the P value for μ2, we calculate Ti for observed and simulated fields:
The T values are then ranked as above to calculate the P value.
Assessing long-range spatial order in retinal mosaics
We used three techniques to estimate the extent of long-range order in retinal mosaics.
1. Kernel density estimates
Autocorrelograms can be smoothed with kernels; the resulting kernel density estimates (KDEs) can be visualised as images. We have calculated the KDEs of autocorrelograms using the quartic kernel with bandwidth h0 = 50 μm, with the R function kernel2d (Berman & Diggle, 1989; Rowlingson & Diggle, 1993). This method includes edge-correction factors to account for the finite extents of the fields being analysed.
2. Density recovery profiles
The density recovery profile (DRP) counts the density of points found in annuli of the autocorrelogram (Rodieck, 1991). The method includes a compensation factor f (Rodieck, 1991) to account for the problem that large annuli will often fall outside the sample window and so counts within each annulus will be lower than expected. The compensation factor f is valid for annuli up to half the size of the shortest edge of the rectangular sample window. The experimental fields analysed here are approximately 1 mm × 2 mm, so the DRP can be calculated only out to at most 0.5 mm.
As well as calculating the DRP for the experimental fields, we also calculate the DRP for 99 simulations of CSR with matching density to the experimental fields. The DRPs from the CSR fields are used to create 95% confidence intervals of the counts within each annulus to assess what range of values would be expected when there is no spatial structure in the mosaic.
3. Assessing structure within each DRP annulus
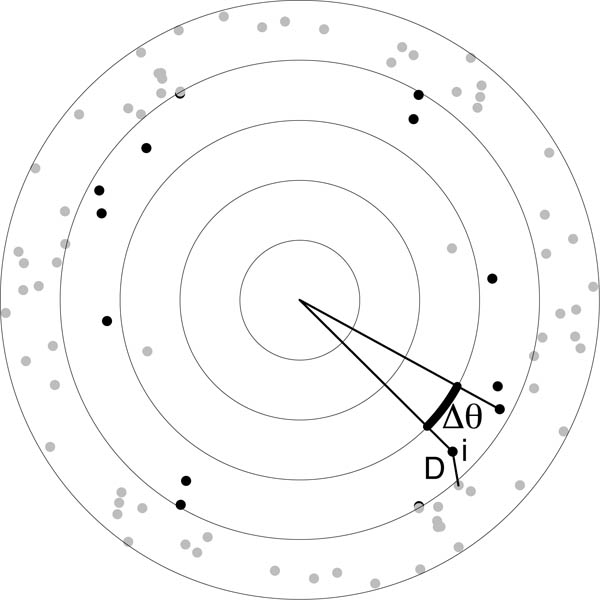
Spatial structure within the autocorrelogram might generate clustering (or repulsion) of points within an annulus of the DRP. By contrast, for points with no spatial structure we expect points to be randomly distributed within each annulus (except that each pair of points generates two entries in the autocorrelogram opposite each other within the same annulus). To assess this possibility, we defined two new measures for quantifying structure within an annulus (Fig. 8). We take each point within an annulus, and measure either the distance to the nearest neighbouring point (D) or the angular difference (Δθ) to the next counter-clockwise point within the annulus. For each annulus, we plot the cumulative distribution of D or Δθ for all points within the annulus. (For these calculations, unlike the DRP, there is no compensation factor, but edge effects are expected to be similar when analysing observed and simulated fields.)
Figure 8.
Measuring the structure within an annulus of the autocorrelogram. For each point i within an annulus (here the third, with its points highlighted in black), D is the distance to the nearest-neighbouring point; Δθ is the angular difference to the next counter-clockwise point within the annulus.
As well as computing the distribution of D and Δθ for autocorrelograms derived from observed fields, a PIPP simulation and a hexagonal lattice simulation, we plot the 95% confidence intervals of these measures for autocorrelograms of 99 simulations of CSR. These confidence intervals show the range of values expected when there is no spatial structure in the mosaic. Informally, if the distribution for a field falls within the confidence interval, we suggest there is no spatial structure of points within that annulus. This can be formalised into an empirical P value using the same formalism as for the G and L functions. P values of 0.05 or less indicate that the distribution of points is non-randomly distributed at the 5% significance level.
Statistical wiring model
We re-implemented the statistical wiring model for wiring the retina to visual cortex (Fig. 1). All details were taken from previous publications where possible (Ringach, 2004, 2007; Paik & Ringach, 2011). We simulated a 6 mm × 6 mm patch of retina, with cellular densities for the on- and off-centre RGCs matching field G09. The simulated cortex was 6 mm × 6 mm with neurons spaced 10 μm apart on a regular square grid. The retina and cortex were aligned to the same size in retinal coordinates so that each RGC had a corresponding preferred location in the cortex. After wiring the retina to the cortex, we shrunk the cortex by a cortical magnification factor of 0.715 because the cortex and retina are of different sizes, as per Paik & Ringach (2011). The receptive field of each RGC was modelled as a bivariate Gaussian with standard deviation σ = 60 μm.
Orientation selectivity indexes were computed for each cortical neuron (Ringach, 2007); a neuron was deemed orientation selective if its index exceeded 0.25. The orientation map was then smoothed with a Gaussian window (σ = 140 μm), and the autocorrelation of all oriented cortical units was then calculated and visualised as an image (Paik & Ringach, 2011). Regularly-spaced pinwheels are indicated by repeating peaks in the autocorrelation plot.
Computational environment
All simulations and data analysis were performed in the R programming language, version 2.13.1 (R Development Core Team, 2011), together with extra packages (Rowlingson & Diggle, 1993; Furrer et al., 2011; Genz & Azzalini, 2011). Data files and code are available upon request.
Results
Models of parasol cell mosaics
We first evaluated if the hexagonal lattice model can account for the spatial properties of parasol cell mosaics. We do this independently for on- and off-centre mosaics, and then combine the two mosaics into one larger population. We have used spatial statistics to quantitatively compare the observed and simulated mosaics. Figure 2 shows the results for the off-centre population from field G09.
Real mosaic
The first column of Figure 2 shows the analysis of the real mosaic. The points (Fig. 2a) represent the centres of individual off-centre parasol cells, overlaid with their Voronoi polygons. The points are regularly arranged and the autocorrelogram (Fig. 2B) shows a clear exclusion zone of around 100 μm. The G function (Fig. 2C) reports the cumulative distribution of nearest-neighbour distances, and shows that most nearest neighbours are 100–150 μm apart. Figure 2D shows the L function, which reports the (scaled) average number of points within a given distance of one neuron. The L function dips below the expectation for a population of points positioned randomly, supporting the notion of an exclusion zone. Finally, in Figure 2E we show the topological disorder, μ2, which measures the variability in the number of Voronoi edges surrounding each point. For the real field in Figure 2 μ2 = 0.68, indicating a quasi-regular population. The absolute values and profiles of these quantitative measures shown in panels C–E are not critical, but instead by calculating the same measures on simulated mosaics, we can then assess how well different models reproduce the observed mosaic.
Hexagonal lattice model
The second column of Figure 2 shows the results from using the hexagonal lattice model with the same noise level (σ = 0.11) as used previously (Paik & Ringach, 2011). The autocorrelogram of the simulated points (Fig. 2B, column 1 vs column 2) shows much more clustering of points than is observed for the real mosaic.
The grey region in Figure 2C, second column, indicates the 95% confidence interval of the G function, estimated from 99 runs of the hexagonal lattice with the same initial conditions, but using different random numbers in the simulation. We have then overlaid the G function (shown in column 1 of Fig. 2C) from the real mosaic for comparison. The G function for the observed field falls within the confidence interval of the simulations, indicating the model can reproduce this spatial property of the observed mosaic. This is confirmed with empirical P values (defined in Methods). P values of 0.05 and smaller indicate that the model does not fit the data at the 5% significance level. Hence, according to the G function, the hexagonal lattice model generates a good fit to the data. This is to be expected, as the nearest-neighbour distribution was used to set the noise level (Paik & Ringach, 2011).
The confidence interval for the L functions from the hexagonal lattice model (Fig. 2D, column 2) show a different result, however. Beyond about 150 μm the L function for the hexagonal lattice model begins to oscillate relative to the real data, resulting in a poor fit (P=0.01). Finally, the values of topological disorder for the hexagonal lattice model are much smaller than the real field, again resulting in a poor fit (P=0.01). In summary, the hexagonal lattice model generates patterns similar to the observed mosaic according to only one out of three quantitative measures.
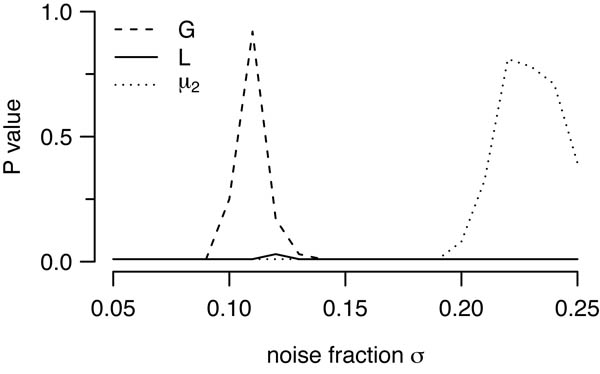
To attempt to improve fits for the hexagonal lattice model, we tried different values of its key parameter, σ, the noise level added to the lattice. As the model was generating patterns that were too regular compared to real mosaics, we tried larger noise levels (shown in Fig. 2, column 3). Increasing the noise level has the predicted effect of making the mosaics less regular, such that an exclusion zone is no longer visible in the autocorrelogram. This relative disorder is reflected in large discrepancies between model and observed mosaic for G and L functions (Fig. 2C, 2D, column 3). However, the increased disorder in the simulated fields generates larger values of μ2, such that μ2 for the real field falls within the distribution of simulated μ2 values. Additional simulations where we systematically varied noise levels (Fig. 3), or imposed a lower bound on the minimal distance allowed showed a similar trend; we could not find parameters such that there was a good fit between model and data according to all three quantitative measures. We therefore conclude that the hexagonal lattice model, as proposed by (Paik & Ringach, 2011), cannot quantitatively account for the spatial distribution of the receptive fields of parasol cells.
Figure 3.
Effect of varying noise fraction (in the hexagonal lattice model upon goodness of fit P values between model and the G09 off field. For a given noise level, we ran 99 simulations and evaluated the goodness of fit between model and simulations for three quantitative measures as in Figure 2. Low noise levels produced good fits for the G function, whereas good fits according to the μ2 measure required high noise levels. By contrast, no noise level could generate a suitable fit according to the L function.
PIPP model
We therefore turned to a different model of retinal mosaic formation, assuming that cells simply position themselves such that they do not come too close to each other. This idea of an exclusion zone surrounding each neuron was first shown to quantitatively account for the spatial position of cholinergic amacrine neurons in rat (Galli-Resta et al., 1997). It has since replicated a wide range of retinal mosaics (Eglen, 2006). Here we used the PIPP exclusion zone model, as we have previously shown that it generates mosaics that quantitatively match anatomical RGC mosaics in cat (Eglen et al., 2005). It has also been used in previous models of cortical orientation selectivity (Ringach, 2007). Starting from a random arrangement, points are repositioned randomly subject only to the constraint, determined by an interaction function (h(·), equation 1), that no two points come too close to each other.
The PIPP model requires two parameters (Table 1) to determine the shape of the exclusion zone around each cell. Figure 2 (column 4) shows the results of the PIPP model for one field. The autocorrelogram from a simulated mosaic appears similar to that from the real mosaic, which is confirmed by the non-significant P values from three quantitative measures (Fig. 2C,D,E, column 4; Table 2). Although the real value of μ2 is slightly higher than the median μ2 of simulations, it is well within the expected range, as confirmed by the high P value.
Table 2.
Goodness of fit P values for the hexagonal lattice (both low and high noise) and PIPP models for four parasol cell mosaics. P values of 0.05 or less are starred to denote significant difference between model and observed field.
| P value |
||||
|---|---|---|---|---|
| Field | Measure | Hexlo | Hexhi | PIPP |
| GO9 OFF | G | 0.90 | * 0.01 | 0.07 |
| L | *0.01 | * 0.01 | 0.21 | |
| μ2 | *0.01 | 1.00 | 0.52 | |
|
| ||||
| G09 ON | G | 0.51 | * 0.01 | 0.08 |
| L | *0.04 | * 0.01 | 0.19 | |
| μ2 | *0.01 | 0.91 | 0.42 | |
|
| ||||
| F07 OFF | G | 0.49 | * 0.01 | 0.12 |
| L | 0.15 | * 0.01 | 0.35 | |
| μ2 | *0.01 | 0.78 | 0.17 | |
|
| ||||
| F07 ON | G | 0.50 | * 0.01 | 0.30 |
| L | 0.09 | * 0.01 | 0.29 | |
| μ2 | * 0.01 | 0.98 | 0.52 | |
We have performed similar fits for the three other parasol mosaics that were available to us (G09 on-centre; F07 on-centre; F07 off-centre), and the resulting P values are reported in Table 2. For these three other fields, we found no suitable value of noise level in the hexagonal lattice model could generate a good fit, but that the PIPP model could also account for these fields. We conclude that the PIPP model, but not the noisy hexagonal lattice model, accounts for the spatial properties of parasol cell receptive field mosaics.
Midget cell mosaic
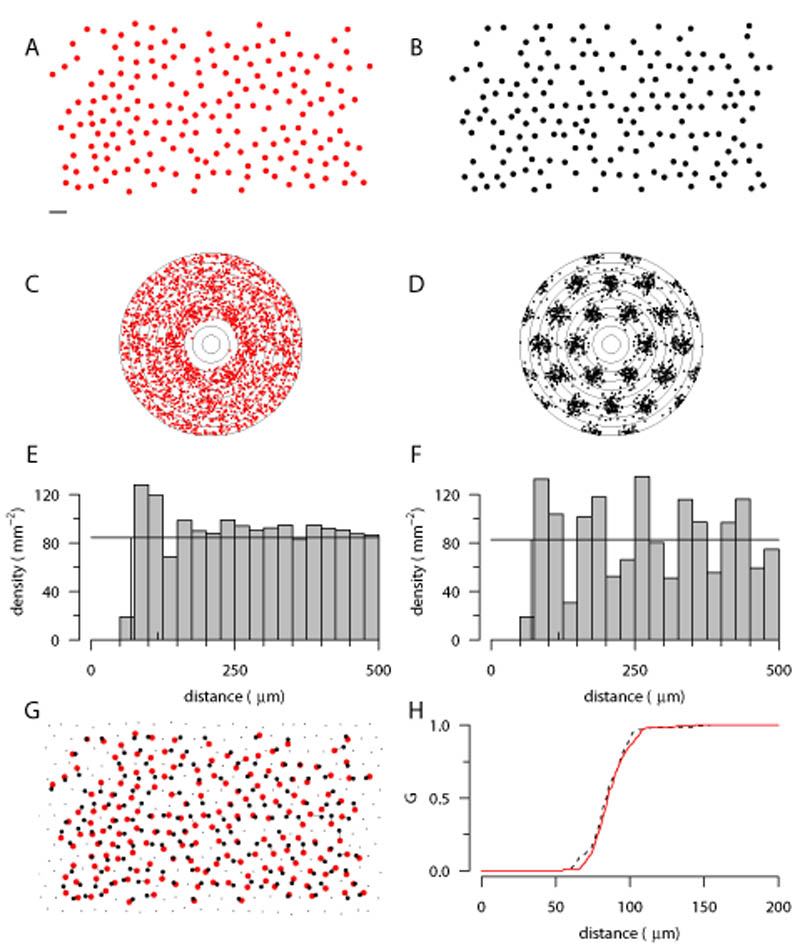
We have also analysed a denser, but incomplete, mosaic, that of the on-centre midget cells (Fig. 4A). Autocorrelation is robust to undersampling of retinal mosaics (Cook, 1996); Figure 2C shows a similar autocorrelogram to that of the parasol mosaics, with a slightly smaller exclusion zone due to the higher density of points. By contrast, the autocorrelogram of an undersampled low-noise hexagonal lattice (Fig. 2B, D) is much more regular, with strong clustering. The DRPs quantify the difference in the two autocorrelograms. The midget cells (Fig. 2E) have an exclusion zone around 75 μm, and after an increased density around 100 μm, the profile recovers to the mean density. By contrast, after the exclusion zone, the autocorrelogram of the hexagonal lattice shows prominent oscillations. Finally, despite the large differences in the correlograms (Fig. 2C vs 2D), the cumulative nearest-neighbour distribution (G) of the two patterns is similar (Fig. 2H). Hence, the G function alone (as used by Paik & Ringach, 2011) is inappropriate for assessing similarity between real and simulated fields.
Figure 4.
Analysis and modelling of on-centre midget mosaic. A, On-centre midget mosaic with several missing cells (Gauthier et al., 2009). Scale bar for A, B and G: 100 μm. B, Hexagonal lattice mosaic (d = 97 μm, σ = 0.12) with points deleted to match incomplete mosaic in A; see panel G for details. C,D, Autocorrelogram of mosaics in A and B, with 25 μm annuli. E,F, Density recovery profiles for the mosaics in panel A and B. G, The simulated mosaic in panel B was downsampled from a hexagonal lattice (small and large black dots) covering the extent of observed points (large red dots, taken from panel A). For each observed point, the nearest-neighbouring simulated point was found (large black dots connected by lines). Only the large black dots were analysed in panel B; small black dots were discarded. H, Despite differences in long-range structure, the cumulative distributions of nearest-neighbour distances of observed (solid red line) and simulated (dotted black line) points are similar.
Effect of retinal mosaics upon cortical orientation selectivity
One key difference between the two types of model is that hexagonal lattice models with low noise have an explicit long-range correlation structure whereas PIPP models do not. In the lattice model, the position of two neurons even several millimetres apart is likely to be highly correlated as they were originally positioned on a lattice with known spacing. By contrast, the PIPP model simply prevents two cells being too close to each other. For the parameters listed in Table 1, this typically means an exclusion zone around each cell of 100–200 μm. In the PIPP model there is therefore no explicit long-range correlation structure imposed upon receptive field positions.
What impact might this presence or absence of long-range correlation of receptive field positions have upon the model of orientation selectivity proposed by Paik & Ringach (2011)? The statistical wiring model (Fig. 1) simulates a array of cortical units that receive inputs from topographically appropriate retinal neurons. Each cortical neuron typically receives input from only a few on- and off-centre RGCs. The relative position of these retinal inputs directly determines the receptive field of the cortical neuron. Most receptive fields are oriented; cells with an orientation selectivity index over 0.25 were considered orientation selective and further analysed.
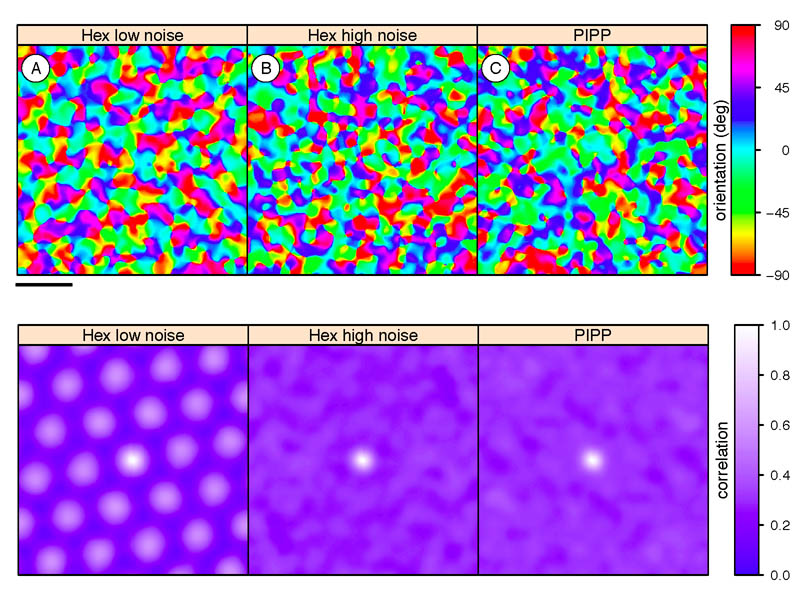
Assuming a hexagonal lattice model for retinal mosaics, the existence of a regular pinwheel organisation in orientation tuning maps requires long-range correlational structure, which generates Moiré interference patterns (Paik & Ringach, 2011). We have verified that hexagonal lattices with low noise can drive the formation of structured orientation columns (Fig. 5A) as shown by highly regular autocorrelational structure. However, if we increase the level of noise in the hexagonal lattice model to more realistic levels, any long-range structure is substantially weakened. Although individual cortical neurons are still orientation selective, the autocorrelation of orientation maps has just a single central peak, indicating no regularity in pinwheel positioning (Fig. 5B). Likewise, when we use mosaics simulated by the PIPP model, as expected, no regular pinwheel structure is observed (Fig. 5C).
Figure 5.
Cortical orientation preference maps (top row; scale bar is 1 mm on cortex) and their autocorrelation structure (bottom row; scale bar is 0.81 mm on cortex) generated by statistical wiring model. Hexagonally-spaced orientation maps are indicated by repeating peaks in the autocorrelation plot. A, The hexagonal lattice retinal mosaics with low noise (σ = 0.12) reproduces periodic cortical correlations as reported before (Paik & Ringach, 2011, Fig. 2C). B, C, With either high-noise (σ = 0.23) hexagonal lattices or PIPP mosaics, periodic cortical correlations are absent.
Hence, we conclude that regular pinwheel structure is critically dependent on the long-range correlations that are present in only the low-noise hexagonal lattice, but that these retinal mosaics are unrealistic. As we use more appropriate retinal mosaics, the regular pinwheel structure disappears.
Assessing long-range structure in retinal mosaics
Hexagonal lattices with low noise are inappropriate for capturing local (up to 250 μm) spatial statistics of receptive field mosaics. However, longer-range correlations might be present in the real receptive field mosaics to drive the formation of cortical orientation maps. To assess the extent of long-range structure, we have therefore used three complementary techniques.
Kernel density estimates
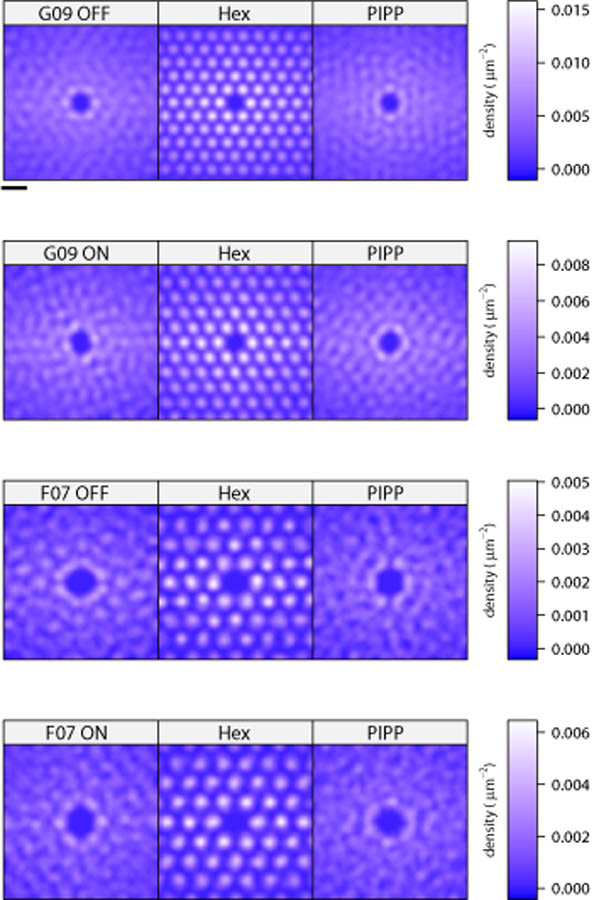
Paik and Ringach used KDEs of the autocorrelograms of receptive field centres to support the claim that there are long-range correlations in the real mosaics (e.g., Supplementary Figure 1 of Paik & Ringach, 2011). The KDE is a smoothed version of the autocorrelograms presented in Figure 2B, but typically calculated over longer distances, and estimates the local density of points at any given distance apart.
We have calculated the KDE for each autocorrelogram of the four real receptive field mosaics (Fig. 6, left column) along with the KDE of matching simulations from the low noise hexagonal lattice (middle column) and the PIPP model (right column). The KDEs are calculated out to 990 μm from the centre (over a square region of edge length 1400 μm). We set the bandwidth of the kernel used for smoothing to 50 μm, as it resulted in a KDE for the G09 off field similar to that shown by Paik & Ringach (2011). In each case, the KDE of the real field and the PIPP field are similar, whereas the hexagonal lattice models generate strong peaks and troughs in the KDE. (A feature common to all KDEs is that the density estimates are higher along the X direction than the Y direction; this is simply because fields are twice as wide as they are high.) These KDEs therefore support the notion that hexagonal lattices generate long-range (up to almost 1 mm) correlations, but that these long-range correlations are not observed in either the real data or in the PIPP model. Even though our KDE for off-centre field G09 (top-left image of Fig. 6) is qualitatively similar to that shown before (Supplementary Figure 1 of Paik & Ringach, 2011), we have come to a different conclusion because the earlier work did not compare the nature of KDEs under different simulated conditions.
Figure 6.
Kernel density estimates derived from autocorrelograms of each of the four observed fields, and for fields simulated by low noise hexagonal lattice and PIPP model of matching density. Scale bar at top is 200 μm.
Density recovery profiles
The KDEs qualitatively assess the degree of order in autocorrelograms. However, they do not quantify the degree of long-range correlational structure. To do this, we use the DRP (Rodieck, 1991), probably the most widely used tool for analysing autocorrelograms of retinal mosaics (Cook, 1996; Eglen, 2006). We compare the radial and angular structure of the autocorrelograms from real or simulated mosaics against autocorrelograms of patterns of CSR. This allows us to assess whether the autocorrelogram structure matches that of patterns where there are no correlations at any distance.
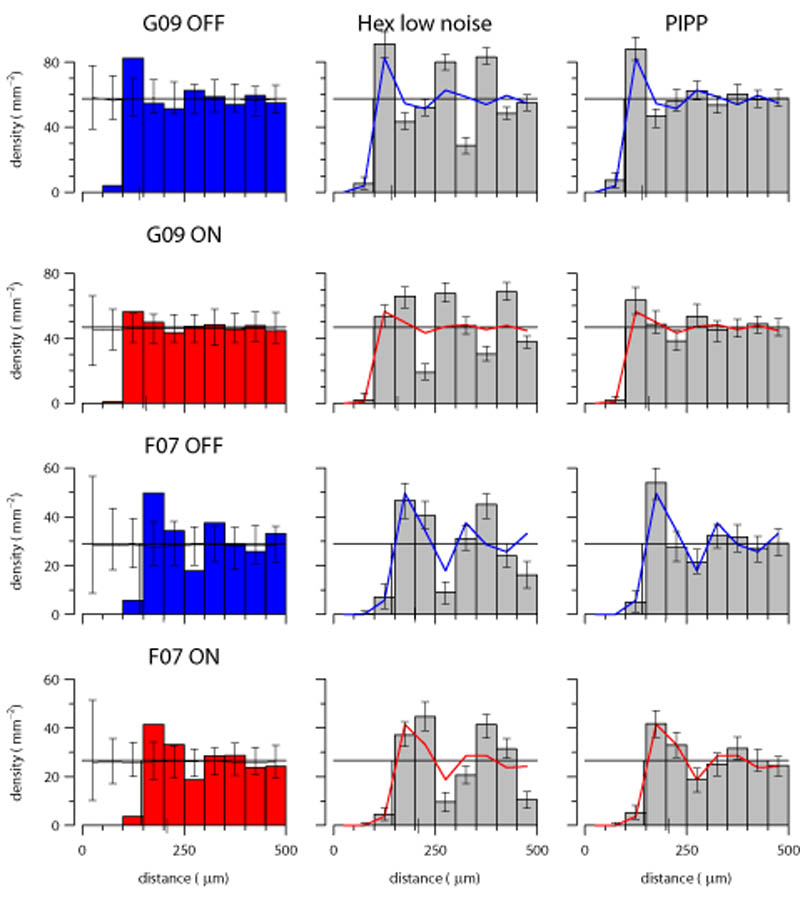
The DRPs for the four observed fields (Fig. 7, left column) all show a similar pattern: an initial exclusion zone out to around 100 μm, and then fluctuations around the mean density out to 500 μm, the maximum distance permitted by the correction factors (see methods). These fluctuations dampen down by around 200 μm (for field G09) or 350 μm (for field F07, which is of lower density than G09), when the fluctuations are within the 95% confidence intervals of DRPs from CSR simulations. Any radial variation in density of the autocorrelograms of the observed fields is thus not discernible from random by at most 350 μm.
Figure 7.
Density recovery profiles for observed data, low noise hexagonal lattice and PIPP model. Left column: The DRP for each observed field; error bars denote 95% confidence intervals of 99 CSR fields of same density as observed field. Solid horizontal line shows the mean density of the observed field. Middle column: Each DRP bar denotes the mean density for 99 simulations of the observed data in left column (shown as solid line); error bars denote 95% confidence intervals of the simulations. The lattice model displays large fluctuations in density at increasing distances, which are absent in the data. Right column: Same as middle column, but using the PIPP model. There is good agreement between observed data and PIPP simulations.
The DRPs for the low noise hexagonal lattices (Fig. 7, middle column) show significant differences to the DRPs from the observed fields out to the maximum extent measured. By contrast, the DRPs for the PIPP simulations agree with the DRPs for the observed fields (Fig. 7, right column).
Analysis of autocorrelation structure
The DRP measures radial structure of autocorrelograms, but ignores any angular variation in the positioning of points within an annulus. Significant variation of points within an annulus of the DRP might occur if there is strong clustering of points driven by long-range correlations. We have thus devised two new measures (D and Δθ; defined in Fig. 8 and methods) to quantify any structure within each DRP annulus.
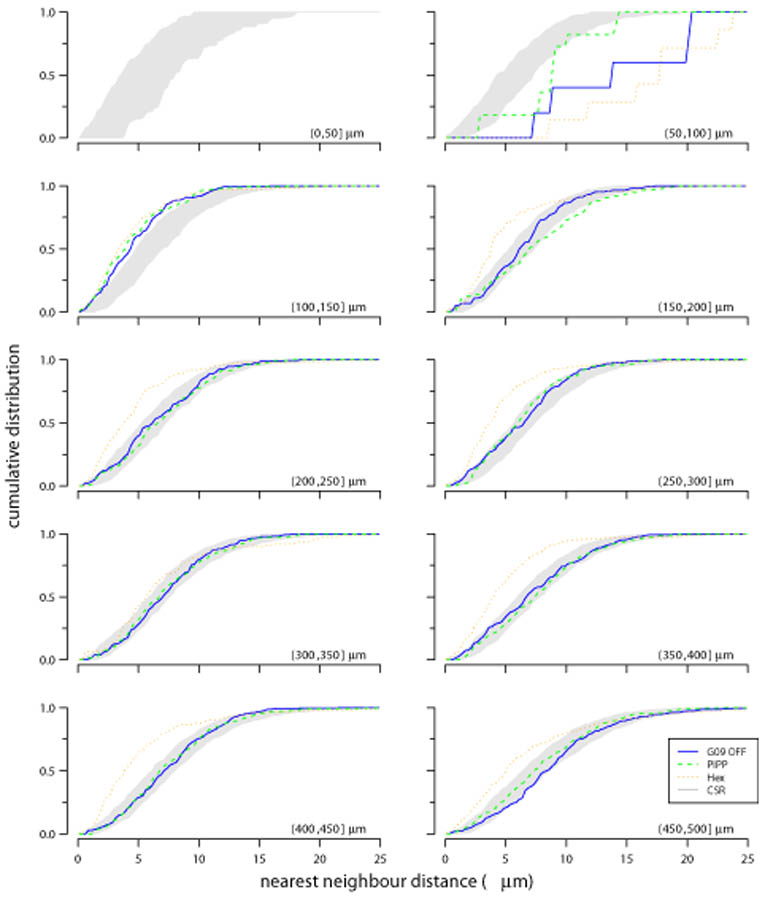
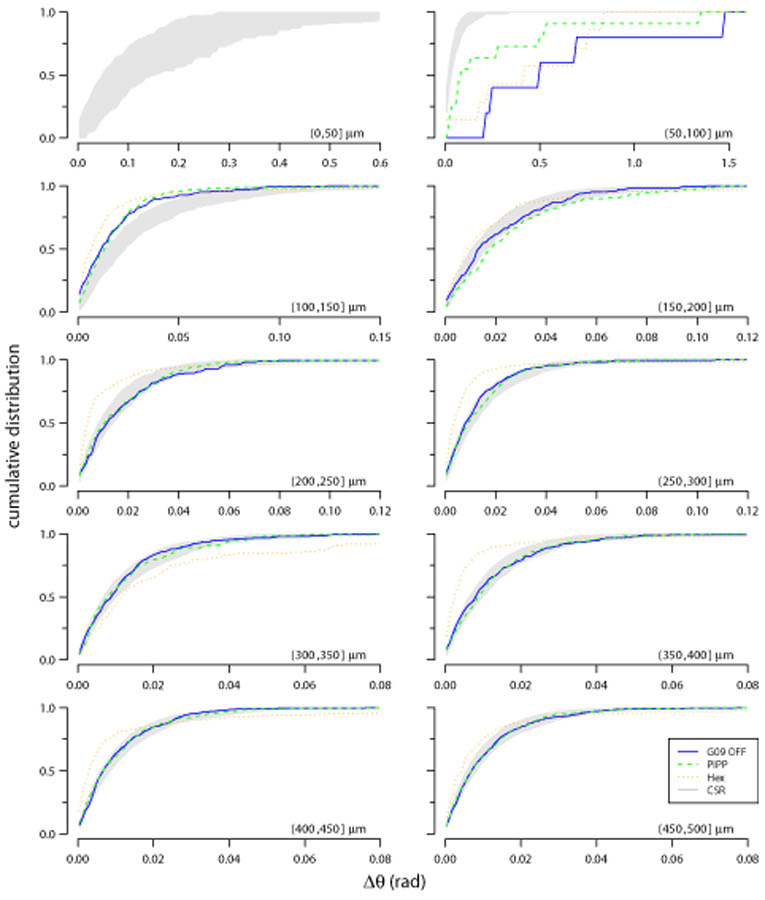
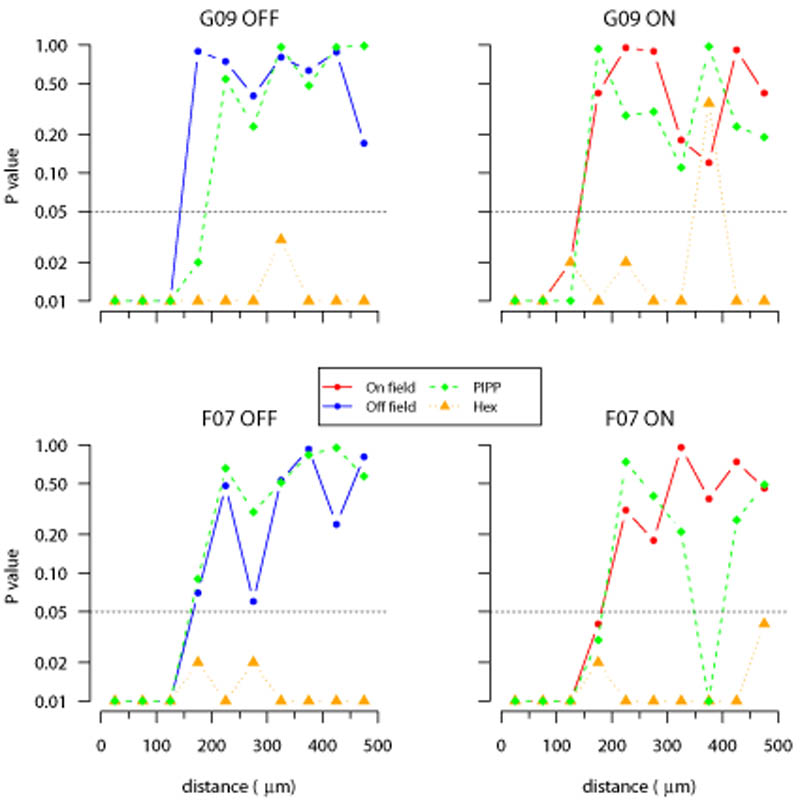
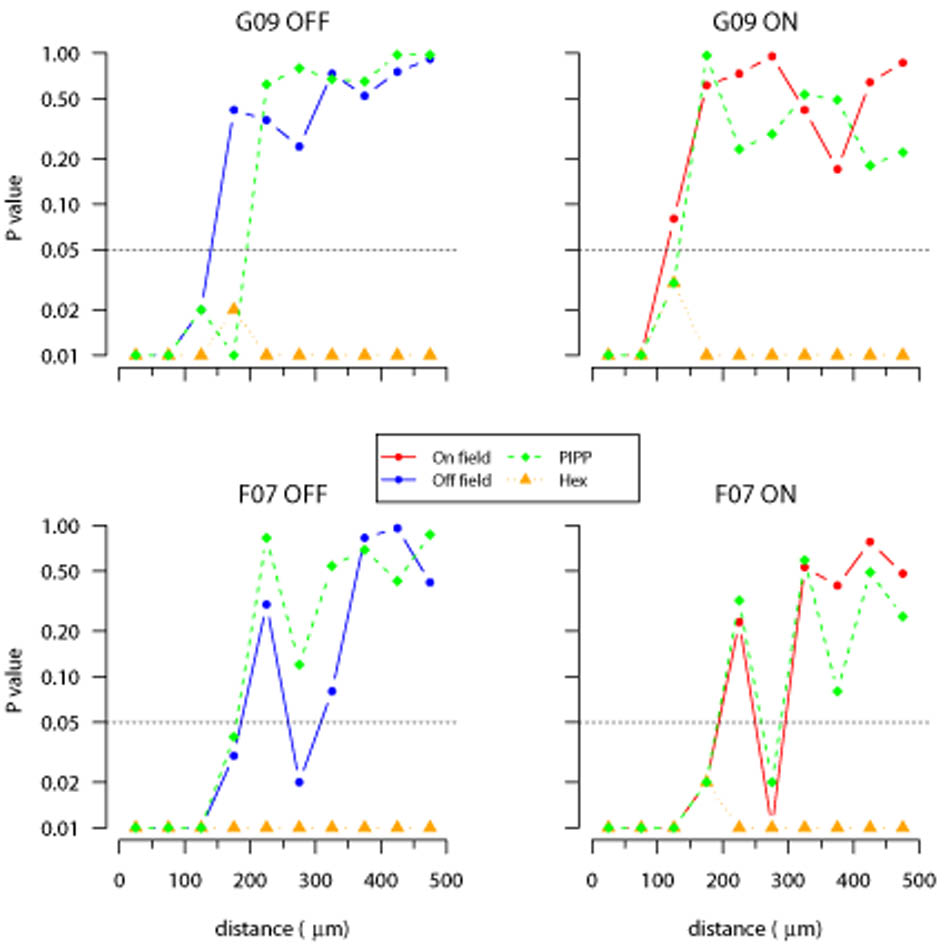
Figure 9 shows the cumulative distribution of nearest-neighbour distances (D) within each annulus of an autocorrelogram for the different patterns. The central circle is empty due to the exclusion zone within the observed and simulated spatial patterns. Up to 200 μm, all three spatial patterns diverge from CSR. This is expected due to the local exclusion zone (Fig. 2, 7). Beyond 200 μm, the curves for the observed field and the PIPP mosaic fall within the confidence interval for CSR patterns. This indicates that, according to this measure, points within annuli beyond 200 μm for both observed fields and PIPP have no spatial structure. By contrast, the low-noise hexagonal lattice model remains outside the CSR envelope. The curve for the low noise hexagonal lattice usually falls to the left of the envelope, indicating more clustering of points than would be expected by chance. This result does not depend on our choice of clustering measure (D); similar results were observed when measuring the distribution of angular differences (Δθ) within each annulus (Fig. 10).
Figure 9.
Evaluating structure within each annulus of autocorrelograms using D measure. Each plot shows the cumulative distribution of points within an annulus to their nearest-neighbour; each annulus is 50 μm wide, noted in the bottom right of each plot as (lower, upper]. The cumulative distribution is shown for observed data (solid blue line: G09 off), and simulations from either PIPP (dashed green line) or low noise hexagonal lattice (dotted orange line). The grey region shows the 95% confidence interval derived from 99 simulations of CSR. See Figures 11 and 12 for statistical evaluation of the fits between the CSR envelope and the observed and simulated fields.
Figure 10.
Evaluating structure within each annulus of autocorrelograms using Δθ measure. Each plot shows the cumulative distribution of the angular difference of points within an annulus to its counter-clockwise neighbour within the annulus. Plots shown in the same format as Figure 9.
Figures 11 and 12 quantify the goodness of fit between these distributions and the envelopes expected for autocorrelograms with no spatial structure for all four parasol mosaics. Irrespective of the measure used (D or Δθ), beyond 200 μm the structure within the annuli for the experimental data are not significantly different (with only 2 exceptions out of 48 annuli) to the autocorrelograms of CSR fields. The P value curves for the PIPP model show a similar trend to the observed fields. By contrast, the P values for the low-noise hexagonal lattice are almost always less than 0.05 beyond 200 μm, indicating that the hexagonal lattice model has more structure than that observed.
Figure 11.
Goodness of fit testing for nearest-neighbour distance distributions (D) in autocorrelograms. Each plot calculates the goodness-of-fit between the autocorrelogram of a field (observed, one PIPP simulation or one low noise hexagonal lattice simulation) and the envelope of 99 CSR simulations as quantified in Figure 9. An empirical P value is calculated independently for each annulus (50 μm wide) of the autocorrelogram out to a maximum of 500 μm. The y-axis is plotted on a logarithmic scale to emphasise whether the P value is 0.05 (dotted horizontal line) or less. P values of 0.05 or less indicate that the structure of the points within an annulus differs from that expected for random patterns at the 5% significance level.
Figure 12.
Goodness of fit testing for angular difference (Δθ) distributions in autocorrelograms. Plots shown in the same format as Figure 11.
Taking together the analysis of counts within each DRP annulus (Fig. 7) and the analysis of structure within each annulus of autocorrelograms (Fig. 11, 12), our estimate of the extent of spatial correlations within the observed fields is 200–350 μm.
Analysis of large simulated mosaics
The limited sample size of the observed fields (1mm × 2 mm) allows us to calculate the DRP out to at most 0.5 mm (Fig. 7). As larger observed fields are not yet available, we have instead used the simulations of larger fields (6mm × 6 mm) to investigate the nature of the DRPs over longer distances (Fig. 13) under different conditions. (These simulated fields were used as input to the cortical model summarised in Fig. 5).
Figure 13.
Density recovery profiles for 6 mm × 6 mm fields simulated to match the spatial statistics of off-centre (left column) and on-centre (right column) maps from field G09. Each DRP annulus was 50 μm, calculated out to the maximum distance (3 mm) allowed by the compensation factor, but is shown out to only 1.5 mm in B as the DRP remained flat beyond 1.5 mm.
For the low noise hexagonal lattice, periodic oscillations around the mean density persist out to 3 mm, the maximal value that we can test (Fig. 13A). For the PIPP model (Fig. 13B), after the exclusion zone, there is a peak (as seen in the G09 off field, Fig. 7 and midget field, Fig. 4E) and modest oscillations that attenuate around 250 μm. Such attenuated oscillations have previously been observed in DRPs of chick photoreceptor mosaics (Fig. 3C of Kram et al., 2010) and cat beta-cell mosaics (Zhan & Troy, 2000), and indicate regularity. After these oscillations, the DRP is flat, indicating no correlations beyond around 250 μm (Fig. 13B).
Correlational distances required for regular pinwheel formation
We estimate that spatial correlations in the experimentally observed fields (and PIPP model) extend to only about 200–350 μm, about 1–2 times d, the spacing of elements in the unjittered hexagonal lattice. This is less than the period of Moiré interference patterns dM = S × d (S = 4–16) predicted for pinwheel formation (Paik & Ringach, 2011), and much less than the correlational distances of up to 3 mm found in low noise hexagonal lattices (Fig. 13). We conclude that the arrays of receptive field centres of parasol cells do not contain sufficiently long-range correlational structure required by the Paik & Ringach (2011) model to seed pinwheel structure.
Discussion
We have analysed the spatial arrangement of receptive field centres of parasol cells to assess if they contain long-range correlational structure. Such long-range structure in receptive field centre positioning might drive the formation of structured orientation pinwheels in visual cortex (Paik & Ringach, 2011). We find that hexagonal lattices do not adequately account for the spatial statistics observed in all four real parasol cell mosaics that we analysed, as simulated lattices are too regular. An alternative model (PIPP), where each cell generates a local exclusion zone, provides better fits to the observed data. When more realistic simulated mosaics are input to the statistical wiring model, regularly-spaced pinwheels fail to develop, as the mosaics do not contain long-range correlations. Finally, we have estimated the extent to which receptive field centre positions are correlated to be only about 200–350 μm. Taken together, we believe that receptive field centre mosaics do not contain sufficiently long-range correlation structure to seed pinwheel structure in visual cortex.
Modelling retinal mosaics
The results from Figure 2 and Table 2 suggest to us that the hexagonal lattice model is too regular to account for receptive field positioning. Previous work modelling cell body mosaics with hexagonal lattices used higher levels of noise (Zhan & Troy, 2000). As more noise is added to the lattice for modelling receptive field centres, fits to some measures improve, but at the expense of worse fits to other measures.
Both hexagonal lattice and PIPP models are phenomenological rather than mechanistic (Eglen, 2012). This is a limitation of both models, but the focus here is on understanding the possible impact of such patterns, rather than how they develop. Despite this, there is a difference in the two models. The PIPP model uses local exclusion zones, typically up to 100–150 μm; no global order is imposed. Molecules (Kay et al., 2012) and mechanisms have been proposed to underlie such exclusion zones, including cell death and lateral migration of developing cell bodies (Reese & Galli-Resta, 2002). By contrast, hexagonal lattice models generate long-range correlations because there is a global pattern imposed on cells within an array. There is no evidence, to our knowledge, for such global pre-patterning of retinal mosaics.
We have focused in this paper on the analysis of parasol cell mosaics, as this is the population of primate RGCs for which there is most complete spatial information. We suggest however that midget cells have similar short-range organisation, based on analysis of an undersampled mosaic (Fig. 4). Together, parasol and midget cells account for the majority of RGCs that project to the lateral geniculate nucleus (Perry et al., 1984). We would expect the retinal mosaics of the remaining RGCs to follow similar local organisational principles. However, even if they did exhibit any longer-range organisation, its effect is likely to be quite small given they would comprise a minority of RGCs.
Orientation maps in different species
Paik & Ringach (2011) showed that the spacing between interference patterns is affected by the angle θ, which determines the orientation of one hexagonal lattice to the other. By varying θ, the statistical wiring model can generate maps that look smooth, as in cat, or with little order among neighbouring cortical neurons, as in mouse (Fig. 2 of Paik & Ringach, 2011). The value of θ is not directly measured, nor estimated, from the observed RGC mosaics, but is a free parameter of the hexagonal lattice model that can be varied to generate different patterns.
Within the framework of the statistical wiring model, we suggest an alternative mechanism by which orientation maps can vary (following Sirotin & Das, 2010). Smooth orientation maps can arise in high-density cortical maps (such as cat or primate) because neighbouring cortical neurons are likely to receive similar inputs. By contrast, lower density cortical maps (such as mouse) generate more salt-and-pepper style orientation maps because cortical inputs no longer sample similar inputs. When the density of cortical neurons was reduced 100 fold (to simulate that of a mouse cortex), neighbouring cortical neurons no longer shared similar orientation preferences (Hore, 2011).
Concerns with the statistical wiring model
Here we have focused on the nature of retinal mosaics used as input to the statistical wiring model. We have used the cortical model to read-out any long-range correlational structure in the retinal mosaics. Although we could replicate the finding that hexagonally-spaced pinwheels can emerge from a (low noise) hexagonal lattice, as expected these regular orientation maps do not form in the absence of retinal long-range correlations.
From a developmental perspective, however, we note several concerns with the statistical wiring model. Most critically, it assumes that the problem of wiring RGCs to the topographically-appropriate part of cortex has already been solved. The creation of topographically ordered projections involves many developmental processes (Huberman et al., 2008) each of which are likely to add significant levels of noise to the projections from retina to cortex, perturbing the relative spatial arrangement of retinal inputs. The statistical wiring model also does not describe any possible topographic rearrangements caused by the visual mapping passing through the lateral geniculate nucleus. Nor does it take any account of multiple types of RGC (Field & Chichilnisky, 2007) that independently tile visual space, and which could drive orientation selectivity. In particular, midget on- and off-centre cells (Fig. 4) are certainly arranged into mosaics at a higher density than parasol cells (Dacey & Petersen, 1992; Dacey, 1993). Assuming that the Paik and Ringach model were correct, parasol and midget cells would independently generate patterns on two different spatial scales due to the Moiré interference from the parasol and midget mosaics. This has not been observed. Understanding the development and mechanisms of orientation tuning in visual cortex has a long history, and given other mechanisms that have been proposed (Swindale, 1996), we find the statistical wiring hypothesis unlikely to be a dominant mechanism.
Aside from concerns with the statistical wiring model itself, there are other concerns surrounding the structure of orientation maps. Paik & Ringach (2011) present evidence that orientation pinwheels in four different species are hexagonally arranged. Preliminary analysis (Keil et al., 2012)1 suggests that the method used by Paik and Ringach to detect hexagonal structure is fairly insensitive, as the method also predicts hexagonality in control maps with no hexagonal structure (Schnabel et al., 2007). Alternative methods devised by Keil et al. show that the degree of hexagonal structure found in cortical orientation maps is indistinguishable from these control maps. Hence, not only is there little long-range order in retinal mosaics, cortical orientation maps are unlikely to be hexagonally-arranged.
More experimental data are required to examine if there is long-range spatial order in retinal mosaics. We anticipate that larger-scale multi-electrode arrays will soon record the receptive field layout of larger populations of neurons (Berdondini et al., 2009). Further technological developments might also allow us to compare the relative organisation of physiological and anatomical retinal mosaics. However, using quantitative spatial analysis and computational modelling we predict that spatial correlations in mosaics are too short ranged to drive regular pinwheel patterns in visual cortex.
Acknowledgments
This work was supported by an EPSRC studentship to VRAH, and a Wellcome Trust programme grant (083205/B/07/Z) to SJE. Thanks to Prof. William Harris, Dr Johannes Hjorth, Dr Wolfgang Keil, Dr Graeme Mitchison, Dr David Sterratt and Prof. David Willshaw for comments on this work.
Abbreviations
- CSR
complete spatial randomness
- DRP
density recovery profile
- KDE
kernel density estimate
- PIPP
pairwise interaction point process
- RGC
retinal ganglion cell
Footnotes
Keil, W., Schnabel, M., Coppola, D.M., Loewel, S., White, L.E., Kaschube, M. & Wolf, F. (2012) Orientation maps lack hexagonal order. Program No. 568.06 Presentation Abstract. 2012 Neuroscience Meeting Planner. New Orleans, LA: Society for Neuroscience.
References
- Berdondini L, Imfeld K, Maccione A, Tedesco M, Neukom S, Koudelka-Hep M, Martinoia S. Active pixel sensor array for high spatio-temporal resolution electrophysiological recordings from single cell to large scale neuronal networks. Lab on a Chip. 2009;9:2644–2651. doi: 10.1039/b907394a. [DOI] [PubMed] [Google Scholar]
- Berman M, Diggle PJ. Estimating weighted integrals of the second-order intensity of spatial point patterns. Journal of the Royal Statistical Society Series B. 1989;51:81–92. [Google Scholar]
- Cellerino A, Novelli E, Galli-Resta L. Retinal ganglion cells with NADPH-diaphorase activity in the chick form a regular mosaic with a strong dorsoventral asymmetry that can be modelled by a minimal spacing rule. European Journal of Neuroscience. 2000;12:613–620. doi: 10.1046/j.1460-9568.2000.00944.x. [DOI] [PubMed] [Google Scholar]
- Cook JE. Spatial properties of retinal mosaics: an empirical evaluation of some existing measures. Visual Neuroscience. 1996;13:15–30. doi: 10.1017/s0952523800007094. [DOI] [PubMed] [Google Scholar]
- Dacey DM. The mosaic of midget ganglion cells in the human retina. Journal of Neuroscience. 1993;13:5334–5355. doi: 10.1523/JNEUROSCI.13-12-05334.1993. [DOI] [PMC free article] [PubMed] [Google Scholar]
- Dacey DM, Petersen MR. Dendritic field size and morphology of midget and parasol ganglion cells of the human retina. Proceedings of the National Academy of Sciences of the U.S.A. 1992;89:9666–9670. doi: 10.1073/pnas.89.20.9666. [DOI] [PMC free article] [PubMed] [Google Scholar]
- Diggle PJ. Displaced amacrine cells in the retina of a rabbit: analysis of a bivariate spatial point pattern. Journal of Neuroscience Methods. 1986;18:115–125. doi: 10.1016/0165-0270(86)90115-9. [DOI] [PubMed] [Google Scholar]
- Diggle PJ, Eglen SJ, Troy JB. Modelling the bivariate spatial distribution of amacrine cells. In: Baddeley A, Gregori P, Mateu J, Stoica R, Stoyan D, editors. Case Studies in Spatial Point Process Modeling. Springer; New York: 2006. pp. 215–233. (volume 185 of Springer Lecture Notes in Statistics). [Google Scholar]
- Eglen SJ. Development of regular cellular spacing in the retina: theoretical models. Mathematical Medicine and Biology. 2006;23:79–99. doi: 10.1093/imammb/dql003. [DOI] [PubMed] [Google Scholar]
- Eglen SJ. Cellular spacing: analysis and modelling of retinal mosaics. In: Le Novére N, editor. Computational Systems Neurobiology. Springer; New York: 2012. pp. 365–385. chapter 12. [Google Scholar]
- Eglen SJ, Wong JCT. Spatial constraints underlying the retinal mosaics of two types of horizontal cells in cat and macaque. Visual Neuroscience. 2008;25:209–214. doi: 10.1017/S0952523808080176. [DOI] [PubMed] [Google Scholar]
- Eglen SJ, Diggle PJ, Troy JB. Homotypic constraints dominate positioning of on- and off-centre beta retinal ganglion cells. Visual Neuroscience. 2005;22:859–871. doi: 10.1017/S0952523805226147. [DOI] [PMC free article] [PubMed] [Google Scholar]
- Field GD, Chichilnisky EJ. Information processing in the primate retina: circuitry and coding. Annual Review of Neuroscience. 2007;30:1–30. doi: 10.1146/annurev.neuro.30.051606.094252. [DOI] [PubMed] [Google Scholar]
- Fortune SJ. A sweepline algorithm for Voronoi diagrams. Algorithmica. 1987;2:153–172. [Google Scholar]
- Furrer R, Nychka D, Sain S. fields: Tools for spatial data. 2011 R package version 6.6 http://CRAN.R-project.org/package=fields.
- Galli-Resta L. Putting neurons in the right places: local interactions in the genesis of retinal architecture. Trends in Neuroscience. 2002;25:638–643. doi: 10.1016/s0166-2236(02)02279-8. [DOI] [PubMed] [Google Scholar]
- Galli-Resta L, Resta G, Tan S-S, Reese BE. Mosaics of Islet-1-expressing amacrine cells assembled by short-range cellular interactions. Journal of Neuroscience. 1997;17:7831–7838. doi: 10.1523/JNEUROSCI.17-20-07831.1997. [DOI] [PMC free article] [PubMed] [Google Scholar]
- Galli-Resta L, Novelli E, Kryger Z, Jacobs GH, Reese BE. Modelling the mosaic organization of rod and cone photoreceptors with a minimal-spacing rule. European Journal of Neuroscience. 1999;11:1461–1469. doi: 10.1046/j.1460-9568.1999.00555.x. [DOI] [PubMed] [Google Scholar]
- Gauthier JL, Field GD, Sher A, Greschner M, Shlens J, Litke AM, Chichilnisky EJ. Receptive fields in primate retina are coordinated to sample visual space more uniformly. PLoS Biology. 2009;7:e1000063. doi: 10.1371/journal.pbio.1000063. [DOI] [PMC free article] [PubMed] [Google Scholar]
- Genz A, Azzalini A. mnormt: The multivariate normal and t distributions. 2011 R package version 1.4-3 http://CRAN.R-project.org/package=mnormt.
- Hore VRA. Do retinal ganglion cell mosaics generate pinwheel structure in the visual cortex? University of Cambridge; 2011. Master’s thesis. [Google Scholar]
- Huberman AD, Feller MB, Chapman B. Mechanisms underlying development of visual maps and receptive fields. Annual Review of Neuroscience. 2008;31:479–509. doi: 10.1146/annurev.neuro.31.060407.125533. [DOI] [PMC free article] [PubMed] [Google Scholar]
- Kay JN, Chu MW, Sanes JR. MEGF10 and MEGF11 mediate homotypic interactions required for mosaic spacing of retinal neurons. Nature. 2012;483:465–469. doi: 10.1038/nature10877. [DOI] [PMC free article] [PubMed] [Google Scholar]
- Kram YA, Mantey S, Corbo JC. Avian cone photoreceptors tile the retina as five independent, self-organizing mosaics. PloS One. 2010;5:e8992. doi: 10.1371/journal.pone.0008992. [DOI] [PMC free article] [PubMed] [Google Scholar]
- Paik S-B, Ringach DL. Retinal origin of orientation maps in visual cortex. Nature Neuroscience. 2011;14:919–925. doi: 10.1038/nn.2824. [DOI] [PMC free article] [PubMed] [Google Scholar]
- Paik S-B, Ringach DL. Link between orientation and retinotopic maps in primary visual cortex. Proceedings of the National Academy of Sciences of the U.S.A. 2012;109:7091–7096. doi: 10.1073/pnas.1118926109. [DOI] [PMC free article] [PubMed] [Google Scholar]
- Perry VH, Oehler R, Cowey A. Retinal ganglion cells that project to the dorsal lateral geniculate nucleus in the macaque monkey. Neuroscience. 1984;12:1101–1123. doi: 10.1016/0306-4522(84)90006-x. [DOI] [PubMed] [Google Scholar]
- R Development Core Team . R: A Language and Environment for Statistical Computing. R Foundation for Statistical Computing; Vienna, Austria: 2011. ISBN 3-900051-07-0. [Google Scholar]
- Reese BE, Galli-Resta L. The role of tangential dispersion in retinal mosaic formation. Progress in Retinal and Eye Research. 2002;21:153–168. doi: 10.1016/s1350-9462(01)00024-6. [DOI] [PubMed] [Google Scholar]
- Ringach DL. Haphazard wiring of simple receptive fields and orientation columns in visual cortex. Journal of Neurophysiology. 2004;92:468–476. doi: 10.1152/jn.01202.2003. [DOI] [PubMed] [Google Scholar]
- Ringach DL. On the origin of the functional architecture of the cortex. PLoS One. 2007;2:e251. doi: 10.1371/journal.pone.0000251. [DOI] [PMC free article] [PubMed] [Google Scholar]
- Ripley BD. The second-order analysis of stationary point processes. Journal of Applied Probability. 1976;13:255–266. [Google Scholar]
- Rockhill RL, Euler T, Masland RH. Spatial order within but not between types of retinal neurons. Proceedings of the National Academy of Sciences of the U.S.A. 2000;97:2303–2307. doi: 10.1073/pnas.030413497. [DOI] [PMC free article] [PubMed] [Google Scholar]
- Rodieck RW. The density recovery profile: a method for the analysis of points in the plane applicable to retinal studies. Visual Neuroscience. 1991;6:95–111. doi: 10.1017/s095252380001049x. [DOI] [PubMed] [Google Scholar]
- Rowlingson BS, Diggle PJ. SPLANCS: spatial point pattern analysis code in S-Plus. Computers and Geosciences. 1993;19:627–655. [Google Scholar]
- Schnabel M, Kaschube M, Löwel S, Wolf F. Random waves in the brain: Symmetries and defect generation in the visual cortex. European Physical Journal. 2007;145:137–157. [Google Scholar]
- Sirotin YB, Das A. Zooming in on mouse vision. Nature Neuroscience. 2010;13:1045–1046. doi: 10.1038/nn0910-1045. [DOI] [PMC free article] [PubMed] [Google Scholar]
- Soodak RE. The retinal ganglion cell mosaic defines orientation columns in striate cortex. Proceedings of the National Academy of Sciences of the U.S.A. 1987;84:3936–3940. doi: 10.1073/pnas.84.11.3936. [DOI] [PMC free article] [PubMed] [Google Scholar]
- Swindale NV. The development of topography in the visual cortex: a review of models. Network: Computation in Neural Systems. 1996;7:161–247. doi: 10.1088/0954-898X/7/2/002. [DOI] [PubMed] [Google Scholar]
- Tanemura M. Statistical distributions of Poisson Voronoi cells in two and three dimensions. Forma. 2003;18:221–247. [Google Scholar]
- Wässle H, Riemann HJ. The mosaic of nerve cells in the mammalian retina. Proceedings of the Royal Society of London Series B. 1978;200:441–461. doi: 10.1098/rspb.1978.0026. [DOI] [PubMed] [Google Scholar]
- Wässle H, Boycott BB, Illing RB. Morphology and mosaic of on-beta and off-beta cells in the cat retina and some functional considerations. Proceedings of the Royal Society of London Series B. 1981a;212:177–195. doi: 10.1098/rspb.1981.0033. [DOI] [PubMed] [Google Scholar]
- Wässle H, Peichl L, Boycott BB. Morphology and topography of on-alpha and off-alpha cells in the cat retina. Proceedings of the Royal Society of London Series B. 1981b;212:157–175. doi: 10.1098/rspb.1981.0032. [DOI] [PubMed] [Google Scholar]
- Zhan XJ, Troy JB. Modeling cat retinal beta-cell arrays. Visual Neuroscience. 2000;17:23–39. doi: 10.1017/s0952523800171032. [DOI] [PubMed] [Google Scholar]


