

Abstract
Purpose
Quantification of cardiac flow and ventricular volumes comprise essential goals of many congenital heart MRI examinations, often requiring acquisition of multiple two-dimensional phase contrast (2DPC) and bright blood cine SSFP planes. Scan prescription however, is lengthy and highly reliant on an imager well-versed in structural heart disease. Though also lengthy, 3D time-resolved phase-contrast (4DPC) MRI yields global flow patterns and is simpler to prescribe. We therefore sought to accelerate 4DPC and determine whether equivalent flow and volume measurements could be extracted.
Materials and Methods
4DPC was modified for higher acceleration with compressed-sensing. Custom software was developed to process 4DPC images. With IRB-approval and HIPAA-compliance, we studied 29 patients referred for congenital cardiac MRI, who underwent a routine clinical protocol including cine short-axis stack SSFP and 2DPC, followed by contrast-enhanced 4DPC. To compare quantitative measurements, Bland-Altman analysis, paired t-tests, and F-tests were used.
Results
Ventricular end-diastolic, end-systolic and stroke volumes obtained from 4DPC and SSFP were well-correlated (ρ=0.91–0.95, r2=0.83–0.90), with no statistically significant difference. Ejection fractions were well-correlated in a subpopulation that underwent higher-resolution compressed-sensing 4DPC (ρ=0.88, r2=0.77). 4DPC and 2DPC flow rates were also well-correlated (ρ=0.90, r2=0.82). Excluding ventricles with valvular insufficiency, cardiac outputs derived from outlet valve flow and stroke volumes were more consistent by 4DPC than by 2DPC and SSFP.
Conclusion
Combined parallel imaging and compressed sensing can be applied to 4DPC. With custom software, flow and ventricular volumes may be extracted with comparable accuracy to SSFP and 2DPC. Further, cardiac outputs were more consistent by 4DPC.
Introduction
The comprehensive analysis of cardiovascular flow and ventricular volumes by MRI is a highly operator-dependent examination, commonly performed with a combination of short-axis cine bright blood imaging (e.g. steady-state free-precession, SSFP) and 2D phase-contrast (2DPC) techniques. While 2DPC provides information regarding cardiac output, valvular regurgitation and flow, cine short-axis stack SSFP is the workhorse of ventricular volume and ejection fraction assessment. The accuracy of ventricular volume and ejection fraction measurements using MRI have been validated [1, 2], and SSFP is now widely used in practice as a clinical gold-standard [3, 4]. 2DPC has been similarly validated [5–7].
In the setting of congenital heart disease, MRI is often a challenging but essential study, yielding flow, ventricular volume, and anatomic data to guide management. However, an MRI protocol to determine flows and ventricular volumes generally consists of a series of sequential scan prescriptions, each relying on images from previous acquisitions. Not only is this time-consuming, but it also often requires direct oversight at the scanner by an experienced cardiovascular imager with detailed knowledge of structural heart disease. This is particularly true in pediatric patients with complex and varied native and post-surgical anatomy.
Three-dimensional time-resolved phase-contrast (4DPC) MRI is an evolving imaging technique that has potential to simultaneously acquire both flow and ventricular volumes in a single acquisition, without detailed knowledge of cardiac anatomy [7–9]. Analogous to CT imaging, this allows separation of the processes of image acquisition and interpretation, with associated advantages in clinical workflow. Until the recent implementation of undersampling methods, including parallel imaging, the clinical utility of 4DPC MRI has been largely limited by prohibitively long image acquisition times. In addition, for anatomic imaging, compressed sensing has recently been described to increase imaging speed or spatial resolution [10–13], and may be similarly applied to 4DPC. Once 4DPC images are acquired, it is then possible to obtain quantitative flow measurements with post-processing software. It has recently been confirmed that retrospective software interrogation can be used to obtain estimates of blood flow with equivalent or improved accuracy relative to 2DPC in clinical patient populations [14–16].
A 4DPC acquisition yields not only a temporally-resolved velocity field, but also concomitant magnitude images. This temporally-resolved anatomic data has garnered less attention, in part because a method for extracting ventricular volumes and ejection fractions from it has not yet been described. Further, the accuracy of such measurements relative to conventional cine bright blood imaging techniques, such as cine SSFP, is not yet known. To assess the potential for simultaneous flow and ventricular volume assessment with this approach, we describe (1) 4DPC with a combination of parallel imaging and compressed-sensing to obtain finer spatial resolution, (2) methods to extract ventricular volumes from 4D phase-contrast data, and (3) assess the accuracy of flow and ventricular volumes relative to 2DPC and short-axis stack cine SSFP.
Materials and methods
Patient population
With institutional review board approval and HIPAA compliance, we retrospectively identified two contiguous patient populations referred for cardiac MRI at our children’s hospital. We included patients who underwent conventional 2DPC of the aorta and pulmonary arteries, short-axis stack cine SSFP of the ventricles, and 4DPC MRI from March to September of 2009 and from March to December of 2010. The earlier group underwent 4DPC exams with one-dimensional k-space undersampling for a parallel imaging reconstruction (GRAPPA), while the latter underwent a higher resolution 4DPC technique described below. A total of 29 patients were found with adequate coverage of the heart for ventricular volume assessment. Patient demographics are summarized in table 1, with ages ranging from 10 months to 29 years (mean 8 years) and a range of body surface areas (Mosteller equation) from 0.45 m2 to 1.99 m2 (mean 0.92 m2). Heart rates were also varied, from 55–139 beats per minute (mean 82 bpm).
Table 1.
Summary of patient population characteristics and imaging parameters. In the later population, 4D spatial resolution was improved to obtain 3-fold smaller voxel volumes, while sacrificing some temporal resolution to preserve scan time. Statistically significant p-values are highlighted in gray.
| 2009 mean (range) |
2010 mean (range) |
t-test p |
||
|---|---|---|---|---|
|
| ||||
| Patients | Age (years) | 9.32 (3–29) | 6.76 (0.83–14) | 0.23 |
| Weight (kg) | 27.64 (11.79–79.4) | 24.98 (9.75–59) | 0.66 | |
| Height (cm) | 122.34 (96–180) | 116.61 (74–168) | 0.53 | |
| BSA (m2) | 0.95 (0.57–1.99) | 0.88 (0.45–1.66) | 0.62 | |
| HR (bpm) | 82 (55–112) | 81 (56–139) | 0.88 | |
|
| ||||
| 4DPC | Flip Angle | 15 (15–15) | 15 (15–15) | n/a |
| TR (ms) | 4.39 (3.65–4.82) | 4.79 (3.84–5.35) | 0.02 | |
| TE (ms) | 1.68 (1.34–1.92) | 1.81 (1.44–2.16) | 0.05 | |
| Row resolution (mm) | 1.41 (1.15–1.56) | 0.98 (0.78–1.25) | 1.2E-08 | |
| Column resolution (mm) | 1.85 (1.38–2.34) | 1.28 (1.04–1.67) | 3.8E-07 | |
| Slice resolution (mm) | 3.53 (3–4) | 2.51 (2–3.4) | 1.2E-05 | |
| Temporal resolution (ms) | 37 (29–64) | 64 (33–86) | 5.7E-04 | |
| venc (cm/s) | 270 (150–500) | 223 (150–300) | 0.09 | |
| Scan time | 9:32 (3:35–13:42) | 9:30 (6:46–14:58) | 0.97 | |
|
| ||||
| 2DPC | Flip Angle | 20 (20–20) | 20.71 (20–30) | 0.32 |
| TR (ms) | 5.42 (4.98–5.97) | 5.41 (4.96–5.96) | 0.92 | |
| TE (ms) | 2.86 (2.47–3.39) | 2.79 (2.46–3.16) | 0.48 | |
| NEX | 2.1 (1–4) | 2.57 (1–5) | 0.38 | |
| Row resolution (mm) | 0.92 (0.7–1.09) | 0.92 (0.78–1.25) | 0.94 | |
| Column resolution (mm) | 1.47 (1.12–1.75) | 1.47 (1.25–2) | 0.94 | |
| Slice resolution (mm) | 9.2 (8–10) | 9.86 (8–10) | 0.03 | |
| Temporal resolution (ms) | 82 (67–103) | 72 (44–98) | 0.05 | |
| venc (cm/s) | 193 (150–500) | 182 (150–300) | 0.55 | |
|
| ||||
| SAX | Flip Angle | 45 (45–45) | 45 (45–45) | n/a |
| TR (ms) | 3.83 (3.6–4.1) | 3.81 (2.94–4.09) | 0.78 | |
| TE (ms) | 1.67 (1.58–1.79) | 1.64 (0.98–1.78) | 0.54 | |
| NEX | 2.13 (1–3) | 2.36 (1–3) | 0.52 | |
| In-plane resolution (mm) | 1.13 (1.02–1.33) | 1.09 (1.02–1.25) | 0.29 | |
| Temporal resolution (ms) | 61 (33–81) | 53 (32–74) | 0.15 | |
|
| ||||
| Total | Scan time (excluding 4DPC) | 1:00 (0:38–1:25) | 0:58 (0:28–1:40) | 0.73 |
Image acquisition
All imaging was performed on a 1.5-T TwinSpeed MRI scanner with an eight-channel phased array cardiac coil (GE Healthcare, Milwaukee, WI), 150 T/ms maximum slew rate, 40 mT/min gradients, and vector ECG gating. The 4DPC acquisition was performed following contrast-enhanced angiography with intravenous contrast. In the former population, single or double-dose, gadobenate dimeglumine or gadopentetate dimeglumine was administered. In the latter population, single-dose gadofoveset was administered to provide enhanced signal-to-noise for higher acceleration.
2DPC MRI and SSFP scan planes were prescribed by board-certified radiologists with dedicated training in pediatric cardiovascular MRI. Acquisition parameters are summarized in Table 1, with spatial resolutions reflecting sampling frequency and field of view rather than reconstruction pixel size. Temporal resolutions are calculated as two times the product of the number of views per segment and repetition time (TR). 2DPC images were acquired with a GRE sequence (FastCard) with 4–10 views per segment depending on patient heart rate. Parallel-imaging was not employed. In patients capable of breath-holding, a single signal average (1 NEX) breath-hold acquisition was performed. Otherwise, a 2–5 signal-average free-breathing acquisition was used to reduce respiratory artifact. The velocity-encoding (venc) parameter was chosen by starting at 150 cm/s and iteratively increasing to avoid aliasing. Cine stack SSFP planes were acquired in short-axis with slice thickness of 6–8 mm, depending on patient size, and a flip angle of 45°. Single signal average breath-held acquisitions were similarly used in patients capable of breath-holding. Otherwise, 2–3 NEX free-breathing acquisitions were used.
4DPC MRI was performed using a SPGR-based sequence with tetrahedral flow-encoding. The early population underwent 4DPC with parallel imaging outer reduction factor of 2 in the phase encode direction [17, 18], reconstructed with generalized autocalibrating partially parallel acquisitions (GRAPPA) and zero-filling in the slice-direction by a factor of 2. To enable a higher acceleration, the later population underwent 4DPC with Poisson disc k-space undersampling with acceleration factors of 1.6×1.6 to 2.2×2.2. Images were reconstructed for each cardiac temporal phase separately with a combined autocalibrating parallel imaging compressed sensing algorithm (L1-SPIRiT) [10, 12, 19]. Zero-filling in the slice-direction was a factor of 2. Compressed-sensing was implemented to take advantage of per-slice 2D spatial sparsity. Respiratory-compensation was employed. Velocity-encoding parameters were selected to avoid aliasing and generally matched or exceeded the parameter used in 2D acquisitions. A flip angle of 15° and 2–4 tetrahedral encodes per segment were used. Acquisition times were similar in both populations, from 4 to 14 minutes (mean 9:32) for the early group and 7 to 15 minutes (mean 9:30) for the later group. Image reconstructions were performed with a GPGPU implementation of L1-SPIRIT on a 64-bit Linux workstation equipped with four Tesla C1060 graphics cards (NVIDIA, Santa Clara, CA). Image data were corrected for Maxwell phase effects [20], encoding errors related to gradient field distortions [21], and eddy-current related phase offsets [22].
Image processing
To permit ventricular volume quantification from 4DPC MRI, custom image processing algorithms were developed by the primary author in Java and OpenGL, and were performed on a 64-bit Windows workstation equipped with a Quadro 6000 graphics card (NVIDIA, Santa Clara, CA). After user-specification of anatomic landmarks (mitral valve, left ventricle apex, tricuspid valve, right ventricle apex), 24 short-axis slices were constructed orthogonal to the long-axis of each ventricle, dynamically tracking the excursion of the apex and its orientation relative to the inlet valve. The valve plane and apex were automatically cross-referenced on the short-axis views to prevent errors in edge slice segmentation. Short-axis views were then manually segmented and summed to estimate volumes at end-systole and end-diastole. To facilitate consistent identification of end-systolic and end-diastolic phases, as well as to visualize flow, velocity vector magnitudes were color-coded and blended over the magnitude data (Fig. 1).
Fig. 1.
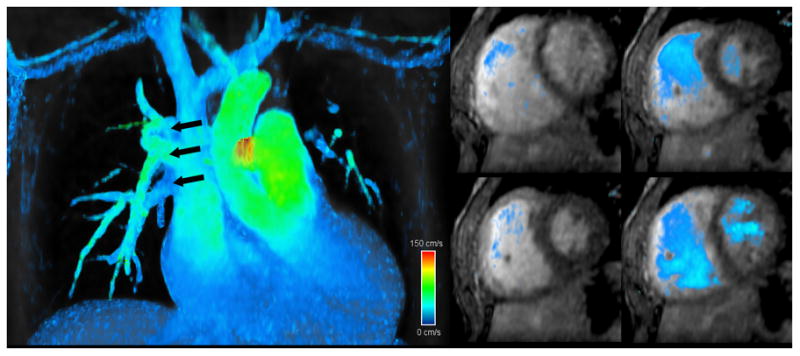
Screen captures from 4DPC custom processing software that was created for this work and enables calculation of flows and ventricular volumes. Reformatted views from a 5-year old patient with partial anomalous pulmonary venous return (high-resolution group) show multiple right-sided pulmonary veins draining into the superior vena cava (left). From the same patient, short-axis views at several cardiac phases (right) are readily reformatted with velocity overlay to facilitate identification of end-systole and end-diastole and delineate the ventricular lumen. High-velocity (150 cm/s) is color-coded in red, intermediate-velocity in green, and low-velocity in blue.
For 4DPC flow quantification, stationary cross-sectional planes were auto-reformatted orthogonal to the direction of flow in early systole, as previously described [16]. Volumetric flow measurements were obtained at the aortic and pulmonary valves. In patients without clearly defined valves, such as patients with repaired tetralogy of Fallot, flow measurements were obtained at the mid-point of the pulmonary trunk. Flow calculations were obtained without knowledge of volume measurements, and all 4DPC calculations were performed by the primary author without knowledge of results of the 2D data.
2D phase-contrast flow measurements and SSFP volumetric measurements were obtained with CV Flow v4 and ReportCard v3.7 on an Advantage workstation (GE Healthcare) for the early population and QFlow v5.2 and QMass v7.2 (MEDIS, Netherlands) for the later population. Each study was manually processed by a board-certified radiologist with subspecialty training in cardiovascular imaging without knowledge of the calculations from 4DPC.
Statistical analysis
In order to compare 4DPC against the conventional 2D methods, several null hypotheses were tested statistically:
Patient demographics and acquisition techniques are not different between the early and later patient populations.
Volume and EF measurements are not different between 4DPC and SSFP.
There is equal consistency between 4DPC and SSFP estimates of EF in the early and later patient populations.
Flow measurements are not different between 4DPC and 2DPC.
There is equal consistency between 4DPC flow and volume estimates of cardiac output and 2DPC flow and SSFP volume estimates of cardiac output.
Calculations were performed in Excel 2003 (Microsoft, Redmond, WA), and a type 1 error threshold of 0.05 was applied for all statistical tests. Bland-Altman limits of agreement were calculated as differences from the mean of 1.96 standard deviations. To test for differences in the patient demographics and acquisition technique, statistical comparisons were performed with two-tailed t-tests with unequal variance. To identify differences in volume and flow measurements between 2D and 4D techniques, two-tailed paired t-tests were used. In order to evaluate the variance in ejection fraction (EF) estimation between 2009 and 2010 patient groups, the difference between SSFP and 4D EF estimates was assumed to be approximately normal with a mean of zero. An F-test was then performed to test the null hypothesis that 4D EF estimates varied from SSFP equally in both early and later groups. In order to compare the consistency of cardiac output estimation between 4D (4DPC and 4D volume) and 2D (2DPC and SSFP) techniques, it was necessary to account for a systematic bias observed between 2DPC and SSFP measurements of cardiac output. Thus, an error statistic (εi) was defined:
| (1) |
where
xi=cardiac output estimated by phase-contrast
yi=cardiac output estimated from stroke volumes
b=Bland-Altman relative mean difference
An F-test was then performed on this statistic to test the null hypothesis that cardiac output estimates by 4D and 2D methods had equal variance about their mean difference.
Results
Comparison of ventricular volumes
Including all subjects, end-diastolic (EDV) and end-systolic (ESV) volumes obtained from 4DPC were well-correlated with SSFP (ρ=0.91–0.95, r2=0.83–0.90), shown in Figure 2. The mean difference in volumes was near zero and Bland-Altman relative limits of agreement were −42 to 38%. The strength of correlation, subdivided into patient groups, is summarized in Table 2. For both groups, the strength of correlation was similar, taking into account the wider range of cardiac volumes observed in the early group. Calculated stroke volumes (SV) also correlated well between 4DPC and SSFP (ρ=0.92, r2=0.84). Bland-Altman analysis showed a mean difference in stroke volumes near zero with relative limits of agreement from −34 to 32% (Fig. 3). No statistically significant difference was observed between 4DPC and SSFP measurements of EDV, ESV and stroke volume.
Fig. 2.

Correlation of measured volumes between 4DPC and SSFP. Scatter (left) and Bland-Altman plots (right) show agreement of the two methods. Systemic measurements are displayed in red diamonds and pulmonary measurements in blue squares. End-systolic volumes are shown with closed symbols and end-diastolic volumes are shown with open symbols.
Table 2.
Correlation of ventricular volume measurements with 4DPC and 2D SSFP. End-diastolic, end-systolic and stroke volume measurements are strongly-correlated. The strength of correlation is similar in both patient groups, when the wider range of cardiac outputs in the earlier population is taken into account. Ejection fraction measurements are better correlated in the later group studied at higher spatial resolution.
| EDV | ESV | SV | EF | |
|---|---|---|---|---|
| 2009 | ||||
| Pearson (ρ) | 0.97 | 0.93 | 0.93 | 0.50 |
| r2 | 0.95 | 0.87 | 0.87 | 0.25 |
| 2010 | ||||
| Pearson (ρ) | 0.89 | 0.87 | 0.89 | 0.88 |
| r2 | 0.80 | 0.76 | 0.79 | 0.77 |
| Combined | ||||
| Pearson (ρ) | 0.95 | 0.91 | 0.92 | 0.69 |
| r2 | 0.90 | 0.83 | 0.84 | 0.48 |
Fig. 3.

Correlation of stroke volumes between 4DPC and SSFP. Scatter (left) and Bland-Altman plots (right) show agreement of the two methods. Systemic measurements are displayed in red diamonds and pulmonary measurements in blue squares. Measurements from the early population are shown with closed symbols and measurements from the later population with open symbols.
Comparison of ejection fractions
Calculated ejection fractions from 4DPC and 2D SSFP were also correlated, though better in the later group (ρ=0.88, r2=0.77) than the early group (ρ=0.50, r2=0.25), shown in Figure 4. Bland-Altman absolute limits of agreement (±1.96 standard deviations) were −13 to 14% in the later group, compared to −27 to 28% in the early group. The difference in the strength of correlation was statistically significant (p<0.05, F-test). It is worth noting that a prior group also reported standard deviations in EF estimation of 13–16% by conventional 2D SSFP and 2D-accelerated 2D and 3D SSFP [23], possibly because of the ratio nature of this computed value. On closer examination of the ejection fractions from the earlier patient group, measurements with greatest mismatch between 4D and SSFP were those of the right ventricle. In each of the outliers seen on the Bland-Altman plot, the walls of right ventricle were difficult to precisely discern from the adjacent muscular trabeculations and papillary muscles (Fig. 5). While the left ventricle has a structure than can be readily inferred even when the resolution is limited, the shape and wall-thickness of the right ventricle is less predictable. We suspect that the improved precision in the later study group may thus be the result of finer spatial resolution, improved image reconstruction, and improved blood-to-myocardium contrast.
Fig. 4.
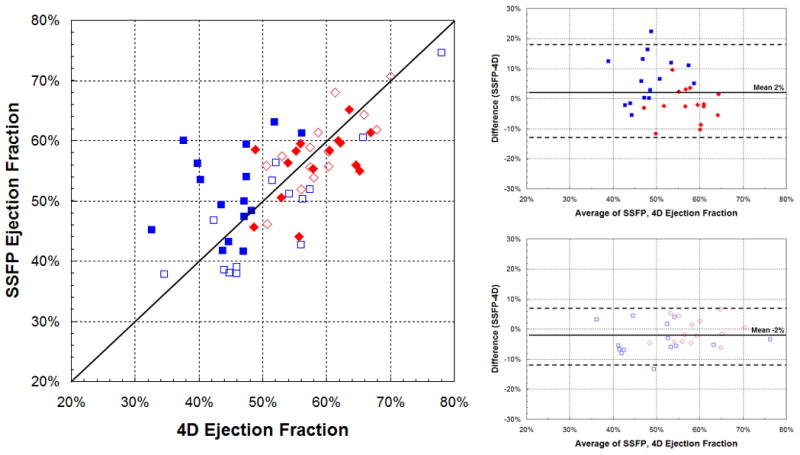
Correlation of ejection fraction between 4DPC and SSFP. Scatter (left) and Bland-Altman plots (right) show modest correlation in the early population (top-right) and better correlation in the later, higher-resolution population (bottom-right), a difference that was statistically significant (p<0.05, F-test). Systemic measurements are displayed in red diamonds and pulmonary measurements in blue squares.
Fig. 5.
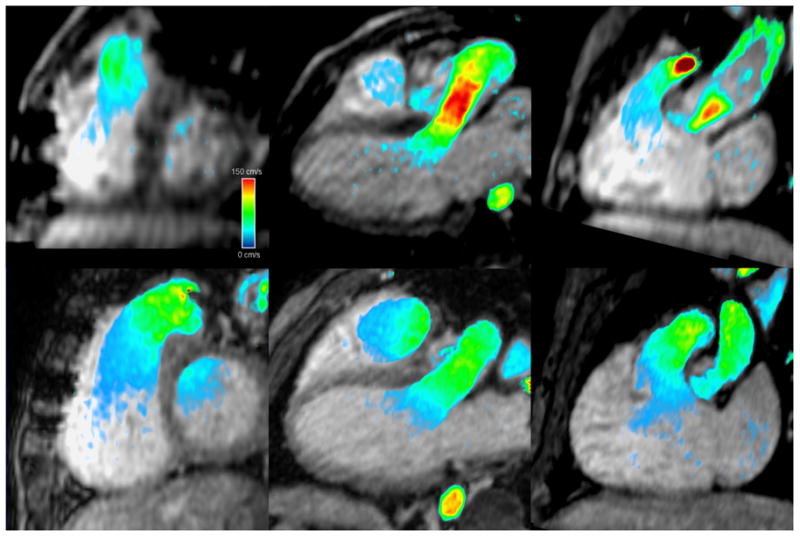
Reformatted short axis and 3-chamber images in mid-systole from 4DPC for two matched patients with repaired tetralogy of Fallot. Images from 2009 patient #3, (top) are sufficient for characterization of left ventricular luminal size, but comparable images from the 2010 patient #2 (bottom) demonstrate improved spatial resolution and overall image quality, and allow for better delineation of the right ventricular wall. High-velocity (150 cm/s) is color-coded in red, intermediate-velocity in green, and low-velocity in blue.
Comparison of phase-contrast flow measurements
Aortic and pulmonic flow rates between 4DPC and 2DPC were well-correlated (ρ=0.90, r2=0.82) with limits of agreement from −26 to 49% (Fig. 6). While the measurements were strongly correlated, 2DPC measurements were noted, on average, to be 12% greater than 4DPC. These slight differences in flow rates were not entirely unexpected. A prior group also found differences between 2DPC and 4DPC flows, particularly at the tricuspid valve of 15–25%, and partly attributed these to errors to motion of the valve plane [15].
Fig. 6.

Correlation of flow measurements between 4DPC and 2DPC. Scatter (left) and Bland-Altman plots (right) show agreement of the two methods. On average, 2DPC measurements slightly exceeded 4DPC by 12%. Systemic measurements are displayed in red diamonds and pulmonary measurements in blue squares. Measurements from the early population are shown with closed symbols and measurements from the later population with open symbols.
Comparison of internal consistency of 4DPC and conventional 2D methods
To further investigate the systematic difference in flow rates between 4DPC and 2DPC, we applied an internal control. We compared cardiac outputs estimated from outlet valve flow rates against cardiac outputs estimated from stroke volumes (Fig. 7). Cardiac outputs obtained from stroke volumes are expected to match or exceed the net outlet valve flow. If valvular insufficiency is present, the heart will displace a greater volume of blood than can be measured at the outlet valve. If not, the cardiac outputs should be exactly matched.
Fig. 7.


Comparison of cardiac outputs by phase-contrast flow and ventricular volumes. Systemic measurements are displayed in red diamonds and pulmonary measurements in blue squares. On the left, scatter plots show the correlation of measurements in the absence of significant (>10%) valvular insufficiency (closed symbols) or with insufficiency (open symbols). All open symbols are expected to be seen well-below the line of identity. On the right, Bland-Altman plots show the strength of correlation in the absence of valvular insufficiency.
By the 4D method (a), all open symbols are seen below the line of identity. By the conventional method (b), two patients with significant valvular insufficiency showed outlet valve flow rates exceeding ventricular outputs. 2DPC flow rates slightly exceeded SSFP volumes by an average of 8%. Limits of agreement of cardiac output were also significantly wider by 2DPC and SSFP (p<0.05, F-test).
We first compared the consistency of cardiac output estimates in the absence of significant (>10%) valvular insufficiency or intracardiac shunts (Table 3). In this analysis, 2DPC measurements were found on average, 8% greater than SSFP, partly explaining the previous observation that 2DPC flows exceeded 4DPC by 12%. The limits of agreement between 2DPC and SSFP ranged from −26 to 43%. Cardiac outputs by 4DPC had narrower limits of agreement, from −27 to 21%, a difference that was statistically significant (p<0.05, F-test). 4DPC flow rates were also closer to 4D volumetric estimates, on average, only 3% lower.
Table 3.
Correlation of cardiac outputs between methodologies, excluding ventricles with associated inlet or outlet valvular insufficiency. Cardiac outputs are better matched by the combined 4D approach than by any other combination of volume and flow assessment. SSFP and 2DPC measurements are also strongly correlated, though with a slight mean difference.
| 4Dvol vs 4DPC | 4Dvol vs 2DPC | SSFP vs 2DPC | SSFP vs 4DPC | |
|---|---|---|---|---|
| 2009 | ||||
| Pearson (ρ) | 0.96 | 0.91 | 0.83 | 0.86 |
| r2 | 0.92 | 0.82 | 0.68 | 0.74 |
| 2010 | ||||
| Pearson (ρ) | 0.94 | 0.92 | 0.91 | 0.86 |
| r2 | 0.89 | 0.84 | 0.83 | 0.74 |
| Combined | ||||
| Pearson (ρ) | 0.95 | 0.92 | 0.86 | 0.86 |
| r2 | 0.90 | 0.83 | 0.76 | 0.74 |
| Bland-Altman | ||||
| Mean difference (PC-volume) | −3% | 9% | 8% | −3% |
| Lower limit of agreement | −27% | −21% | −26% | −41% |
| Upper limit of agreement | 21% | 38% | 43% | 34% |
We then examined the remaining ventricles with significant (>10%) valvular insufficiency. By the 4D method, all of these ventricles were found to have ventricular outputs exceeding the net outlet valve flow, as expected. By 2DPC and SSFP, flow rates at the outlet valve exceeded the ventricular output in two patients, even though they were expected to be substantially lower. Together, all of these findings point toward improved agreement in cardiac outputs between 4DPC flow and volumes over 2DPC and SSFP.
Discussion
While 2D phase-contrast MRI is the clinical standard for flow quantification by MRI, we recapitulate results from earlier works that have shown that equivalent or improved flow measurements can be obtained from 4D phase-contrast in a clinical population. We also show, for the first time, that 4DPC can be performed with sufficient resolution to allow assessment of ventricular volumes with accuracy comparable to short-axis stack cine SSFP. With the use of two-dimensional parallel imaging and compressed sensing, near-isotropic 3 mm3 images can be acquired in a scan time practical for clinical practice. In a population of congenital heart patients, we find that this implementation of 4DPC is also sufficient for estimation of ventricular ejection fraction.
Near-isotropic 3D temporally-resolved MRI acquisitions such as 4DPC have a number of theoretical advantages over conventional 2D SSFP for evaluation of ventricular volumes. Finer through-plane resolution allows for more accurate demarcation of the valve plane and allows creation of short-axis views that track the location of the valves and excursion of the apex. Both of these may improve segmentation accuracy, particularly of the edge slices. This segmentation strategy may also be possible with recently described free-breathing and breath-held 3D cine SSFP techniques [24–26], if they are acquired with comparable slice resolution. However, since many of our patients undergo coil embolization and cardiac surgery, magnetic field inhomogeneities are more likely to adversely affect a 3D SSFP technique.
In addition, since the 4DPC images represent an average physiologic state over a larger time frame, they may be less susceptible to beat-to-beat or respiratory variation that could confound shorter acquisitions. This may have contributed to the improved agreement we observed between 4DPC flow and volumes over 2DPC and SSFP. This averaging however, comes at a price of diminished conspicuity of the ventricular walls, trabeculations and papillary muscle structures. It is for this reason that 2D SSFP is performed at our institution with breath-holding when possible, because the tradeoff in improved wall-delineation is presumed to exceed the degree of respiratory and beat-to-beat cardiac variability. The results of this study appear to challenge this notion, if a 3D acquisition is used.
Limitations and Future Work
By conventional planar SSFP, there is both intra- and inter-institutional variability in estimation of ventricular volume [27], and undoubtedly this can affect 4D volumes as well. It is not immediately clear how the near-isotropic imaging and segmentation strategy presented here affects inter-observer variation. Rather than examine this directly, we have assessed the performance of 4D volumes by SSFP and by using internal physical constraints. While it is likely that some intra-observer and inter-observer variability exists in ventricular volume estimation, the strength of (1) the correlation of 4D and SSFP volumes, (2) the correlation of cardiac outputs from 4D volumes and 4DPC flows and (3) the correlation of cardiac outputs from 4D volumes and 2DPC flows are all reassuring. It will be important in future studies however, to more precisely assess the sources of variations in segmentation, which may continue to decrease as three-dimensional spatial resolution continues to improve.
The assessment of ventricular ejection fraction appears to have improved between our early and later study populations, and though we have largely attributed this to finer spatial resolution, a few other changes were also made to the 4DPC protocol that may also have contributed. To improve spatial resolution, 2D parallel imaging with Poisson-disc k-space undersampling was used to reduce scan time, and permit compressed-sensing reconstruction. The number of tetrahedral encodes per segment were also increased, sacrificing some temporal resolution for scan time. Neither of these is likely to have improved the assessment of ejection fraction between the two study groups. To facilitate greater undersampling, we also began using gadofoveset intravenous contrast media in place of gadobenate dimeglumine or gadopentetate dimeglumine. The prolonged blood pool residence time enables a higher baseline SNR, which can in part be sacrificed for higher acceleration. This added contrast may have also improved blood-to-myocardium contrast to further improve wall delineation. Since we did not examine the quality of ejection fraction measurements with standard extracellular contrast agents when 2D acceleration is used, it is not clear whether similar results could have been obtained without gadofoveset.
While we have primarily focused our attention here on assessment of ventricular volumes and ejection fraction, we have not directly evaluated wall motion. In current practice of pediatric cardiovascular MRI, qualitative wall motion assessment is a secondary goal of the exam, in part due to the ability to obtain similar information from echocardiography. Thus, a loss of wall motion assessment with an exam consisting only of 4DPC and perhaps MRA may be an acceptable tradeoff for shorter anesthesia, higher throughput, and greater patient access to MRI. There are however, a few promising applications of phase-contrast to better characterize ventricular wall motion, though these are not in routine clinical practice. Some groups have shown promise using respiratory-navigated 2DPC MRI to visualize tissue motion at lower venc [28–30]. These techniques may offer better characterization of myocardial strain, but additional work will need to be done to identify practical clinical applications.
We have identified, in our study, a slight overestimation of 2D phase-contrast flow measurements relative to SSFP stroke volumes, 4D ventricular volumes, and 4DPC flow rates. While it is possible that this is institution and hardware-specific, a number of groups have pointed out that such issues may be prevalent. A recent multi-institutional study concluded that systems from three major manufacturers have significant phase-offset errors requiring post-acquisition correction to achieve reliable flow measurements [31]. Some have advocated specifically for phantom-based phase-offset correction [32]. It is possible that the overestimation of 2DPC that we observed is the result of residual uncorrected phase-offset, despite the use of local background eddy-current correction.
While 4DPC is not immune to these effects, we have found that automated computational corrections are more reliably performed on 4DPC because spatial aliasing is more readily avoided in a non-obliqued 4DPC volumetric acquisition. In addition, prior works have also shown that phase-contrast may not always be accurate, depending on acquisition and patient parameters, such as the presence of complex flow and valvular regurgitation [16, 33, 34]. Keeping in mind such limitations of phase-contrast flow quantification, concurrent ventricular volume assessment, as described in this work, may clarify inconsistencies in flow measurement.
Finally, 4DPC requires a priori knowledge for selection of the velocity-encoding parameter. This has been chosen to meet or exceed the 2DPC velocity-encoding, which has been iteratively increased to avoid aliasing, while minimizing the noise floor. This represents a significant limitation of the current implementation of 4DPC. Future work may need to be directed at dynamically selecting the venc at the time of image acquisition. At present, we have also only taken advantage of per-slice 2D spatial sparsity in the compressed-sensing reconstruction. Future implementations may further leverage spatial and temporal sparsity, and allow even greater acceleration for finer spatial resolution or shortened acquisitions.
Summary
In this study, we demonstrate that it is possible to obtain internally consistent, quantitative measures of flow and ventricular volumes from 4DPC in a clinical patient population. For a current state-of-the-art examination, even an experienced MR technologist may require considerable time-consuming oversight from a trained cardiovascular imager to acquire appropriately obliqued imaging planes. The volumetric nature of 4DPC allows a nearly complete separation of the processes of image acquisition and interpretation, which may improve clinical workflow in a manner analogous to modern CT imaging. Furthermore, the quantitative assessment of ventricular volumes and evaluation of systemic and pulmonic flow rates fulfills the essential goals for many pediatric cardiac MRI examinations [35]. A ten-minute 4DPC acquisition may eventually be sufficient to satisfy this need, open opportunities for other advanced MR techniques, and reduce the depth and duration of anesthesia in applicable patients.
Acknowledgments
Grant Support: P41-RR07471/RR/NCRR NIH HHS/United States and R01 EB009690/EB/NIBIB NIH HHS/United States
References
- 1.Sechtem U, Pflugfelder PW, Gould RG, Cassidy MM, Higgins CB. Measurement of right and left ventricular volumes in healthy individuals with cine MR imaging. Radiology. 1987;163:697–702. doi: 10.1148/radiology.163.3.3575717. [DOI] [PubMed] [Google Scholar]
- 2.Longmore DB, Klipstein RH, Underwood SR, et al. Dimensional accuracy of magnetic resonance in studies of the heart. Lancet. 1985;1:1360–1362. doi: 10.1016/s0140-6736(85)91786-6. [DOI] [PubMed] [Google Scholar]
- 3.Carr JC, Simonetti O, Bundy J, Li D, Pereles S, Finn JP. Cine MR Angiography of the Heart with Segmented True Fast Imaging with Steady-State Precession1. Radiology. 2001;219:828–834. doi: 10.1148/radiology.219.3.r01jn44828. [DOI] [PubMed] [Google Scholar]
- 4.Devos D, Kilner P. Calculations of cardiovascular shunts and regurgitation using magnetic resonance ventricular volume and aortic and pulmonary flow measurements. European Radiology. 2010;20:410–421. doi: 10.1007/s00330-009-1568-2. [DOI] [PubMed] [Google Scholar]
- 5.Higgins CB, Sakuma H. Heart disease: functional evaluation with MR imaging. Radiology. 1996;199:307–315. doi: 10.1148/radiology.199.2.8668769. [DOI] [PubMed] [Google Scholar]
- 6.Szolar DH, Sakuma H, Higgins CB. Cardiovascular applications of magnetic resonance flow and velocity measurements. J Magn Reson Imaging. 1996;6:78–89. doi: 10.1002/jmri.1880060117. [DOI] [PubMed] [Google Scholar]
- 7.Pelc NJ, Herfkens RJ, Shimakawa A, Enzmann DR. Phase contrast cine magnetic resonance imaging. Magn Reson Q. 1991;7:229–254. [PubMed] [Google Scholar]
- 8.Pelc NJ, Bernstein MA, Shimakawa A, Glover GH. Encoding strategies for three-direction phase-contrast MR imaging of flow. J Magn Reson Imaging. 1991;1:405–413. doi: 10.1002/jmri.1880010404. [DOI] [PubMed] [Google Scholar]
- 9.Alley MT, Napel S, Amano Y, et al. Fast 3D cardiac cine MR imaging. J Magn Reson Imaging. 1999;9:751–755. doi: 10.1002/(sici)1522-2586(199905)9:5<751::aid-jmri21>3.0.co;2-7. [DOI] [PubMed] [Google Scholar]
- 10.Vasanawala SS, Alley MT, Hargreaves BA, Barth RA, Pauly JM, Lustig M. Improved Pediatric MR Imaging with Compressed Sensing1. Radiology. 2010;256:607–616. doi: 10.1148/radiol.10091218. [DOI] [PMC free article] [PubMed] [Google Scholar]
- 11.Gamper U, Boesiger P, Kozerke S. Compressed sensing in dynamic MRI. Magn Reson Med. 2008;59:365–373. doi: 10.1002/mrm.21477. [DOI] [PubMed] [Google Scholar]
- 12.Lustig M, Pauly JM. SPIRiT: Iterative self-consistent parallel imaging reconstruction from arbitrary k-space. Magn Reson Med. 2010;64:457–471. doi: 10.1002/mrm.22428. [DOI] [PMC free article] [PubMed] [Google Scholar]
- 13.Otazo R, Kim D, Axel L, Sodickson DK. Combination of compressed sensing and parallel imaging for highly accelerated first-pass cardiac perfusion MRI. Magn Reson Med. 2010;64:767–776. doi: 10.1002/mrm.22463. [DOI] [PMC free article] [PubMed] [Google Scholar]
- 14.Roes SD, Hammer S, van der Geest RJ, et al. Flow Assessment Through Four Heart Valves Simultaneously Using 3-Dimensional 3-Directional Velocity-Encoded Magnetic Resonance Imaging With Retrospective Valve Tracking in Healthy Volunteers and Patients With Valvular Regurgitation. Invest Radiol. 2009 doi: 10.1097/RLI.0b013e3181ae99b5. [DOI] [PubMed] [Google Scholar]
- 15.van der Hulst AE, Westenberg JJM, Kroft LJM, et al. Tetralogy of Fallot: 3D Velocity-encoded MR Imaging for Evaluation of Right Ventricular Valve Flow and Diastolic Function in Patients after Correction1. Radiology. 2010;256:724–734. doi: 10.1148/radiol.10092269. [DOI] [PubMed] [Google Scholar]
- 16.Hsiao A, Alley MT, Massaband P, Herfkens RJ, Chan FP, Vasanawala SS. Improved cardiovascular flow quantification with time-resolved volumetric phase-contrast MRI. Pediatr Radiol. 2011 doi: 10.1007/s00247-010-1932-z. [DOI] [PMC free article] [PubMed] [Google Scholar]
- 17.Markl M, Chan FP, Alley MT, et al. Time-resolved three-dimensional phase-contrast MRI. J Magn Reson Imaging. 2003;17:499–506. doi: 10.1002/jmri.10272. [DOI] [PubMed] [Google Scholar]
- 18.Bammer R, Hope TA, Aksoy M, Alley MT. Time-resolved 3D quantitative flow MRI of the major intracranial vessels: initial experience and comparative evaluation at 1.5T and 3. 0T in combination with parallel imaging. Magn Reson Med. 2007;57:127–140. doi: 10.1002/mrm.21109. [DOI] [PMC free article] [PubMed] [Google Scholar]
- 19.Beatty P. A Method for Autocalibrating 2D-Accelerated Volumetric Parallel Imaging with Clinically Practical Reconstruction Times. Proceedings of the ISMRM-ESMRMB; Berlin. 2007. p. 1749. [Google Scholar]
- 20.Bernstein MA, Zhou XJ, Polzin JA, et al. Concomitant gradient terms in phase contrast MR: analysis and correction. Magn Reson Med. 1998;39:300–308. doi: 10.1002/mrm.1910390218. [DOI] [PubMed] [Google Scholar]
- 21.Markl M, Bammer R, Alley MT, et al. Generalized reconstruction of phase contrast MRI: analysis and correction of the effect of gradient field distortions. Magn Reson Med. 2003;50:791–801. doi: 10.1002/mrm.10582. [DOI] [PubMed] [Google Scholar]
- 22.Walker PG, Cranney GB, Scheidegger MB, Waseleski G, Pohost GM, Yoganathan AP. Semiautomated method for noise reduction and background phase error correction in MR phase velocity data. Journal of Magnetic Resonance Imaging. 1993;3:521–530. doi: 10.1002/jmri.1880030315. [DOI] [PubMed] [Google Scholar]
- 23.Davarpanah AH, Chen YP, Kino A, et al. Accelerated two- and three-dimensional cine MR imaging of the heart by using a 32-channel coil. Radiology. 2010;254:98–108. doi: 10.1148/radiol.2541090545. [DOI] [PubMed] [Google Scholar]
- 24.Parish V, Hussain T, Beerbaum P, et al. Single breath-hold assessment of ventricular volumes using 32-channel coil technology and an extracellular contrast agent. Journal of Magnetic Resonance Imaging. 2010;31:838–844. doi: 10.1002/jmri.22061. [DOI] [PubMed] [Google Scholar]
- 25.Liu J, Wieben O, Jung Y, Samsonov AA, Reeder SB, Block WF. Single breathhold cardiac CINE imaging with multi-echo three-dimensional hybrid radial SSFP acquisition. Journal of Magnetic Resonance Imaging. 2010;32:434–440. doi: 10.1002/jmri.22269. [DOI] [PubMed] [Google Scholar]
- 26.Liu J, Spincemaille P, Codella NCF, Nguyen TD, Prince MR, Wang Y. Respiratory and cardiac self-gated free-breathing cardiac CINE imaging with multiecho 3D hybrid radial SSFP acquisition. Magnetic Resonance in Medicine. 2010;63:1230–1237. doi: 10.1002/mrm.22306. [DOI] [PMC free article] [PubMed] [Google Scholar]
- 27.Beerbaum P, Barth P, Kropf S, et al. Cardiac function by MRI in congenital heart disease: impact of consensus training on interinstitutional variance. J Magn Reson Imaging. 2009;30:956–966. doi: 10.1002/jmri.21948. [DOI] [PubMed] [Google Scholar]
- 28.Delfino JG, Johnson KR, Eisner RL, Eder S, Leon AR, Oshinski JN. Three-directional Myocardial Phase-Contrast Tissue Velocity MR Imaging with Navigator-Echo Gating: In Vivo and in Vitro Study1. Radiology. 2008;246:917–925. doi: 10.1148/radiol.2463062155. [DOI] [PubMed] [Google Scholar]
- 29.Jung B, Markl M, Foll D, Hennig J. Investigating myocardial motion by MRI using tissue phase mapping. Eur J Cardiothorac Surg. 2006;29 (Suppl 1):S150–157. doi: 10.1016/j.ejcts.2006.02.066. [DOI] [PubMed] [Google Scholar]
- 30.Petersen SE, Jung BA, Wiesmann F, et al. Myocardial tissue phase mapping with cine phase-contrast mr imaging: regional wall motion analysis in healthy volunteers. Radiology. 2006;238:816–826. doi: 10.1148/radiol.2383041992. [DOI] [PubMed] [Google Scholar]
- 31.Gatehouse P, Rolf M, Graves M, et al. Flow measurement by cardiovascular magnetic resonance: a multi-centre multi-vendor study of background phase offset errors that can compromise the accuracy of derived regurgitant or shunt flow measurements. Journal of Cardiovascular Magnetic Resonance. 2010;12:5. doi: 10.1186/1532-429X-12-5. [DOI] [PMC free article] [PubMed] [Google Scholar]
- 32.Holland B, Printz B, Lai W. Baseline correction of phase-contrast images in congenital cardiovascular magnetic resonance. Journal of Cardiovascular Magnetic Resonance. 2010;12:11. doi: 10.1186/1532-429X-12-11. [DOI] [PMC free article] [PubMed] [Google Scholar]
- 33.O’Brien KR, Myerson SG, Cowan BR, Young AA, Robson MD. Phase contrast ultrashort TE: A more reliable technique for measurement of high-velocity turbulent stenotic jets. Magn Reson Med. 2009;62:626–636. doi: 10.1002/mrm.22051. [DOI] [PubMed] [Google Scholar]
- 34.Buonocore MH, Bogren H. Factors influencing the accuracy and precision of velocity-encoded phase imaging. Magn Reson Med. 1992;26:141–154. doi: 10.1002/mrm.1910260115. [DOI] [PubMed] [Google Scholar]
- 35.Krishnamurthy R. The role of MRI and CT in congenital heart disease. Pediatric Radiology. 2009;39:196–204. doi: 10.1007/s00247-009-1166-0. [DOI] [PubMed] [Google Scholar]