

Abstract
The apo-protein of Pseudomonas aeruginosa azurin binds iron(II) to give a 1:1 complex, which has been characterized by electronic absorption, Mössbauer, and NMR spectroscopies, as well as X-ray crystallography and quantum-chemical computations. Despite potential competition by water and other coordinating residues, iron(II) binds tightly to the low-coordinate site. The iron(II) complex does not react with chemical redox agents to undergo oxidation or reduction. Spectroscopically-calibrated quantum-chemical computations show that the complex has high-spin iron(II) in a pseudotetrahedral coordination environment, which features interactions with side chains of two histidines and a cysteine, as well as the C=O of Gly45. In the 5A1 ground state, the dz2 orbital is doubly occupied. Mutation of Met121 to Ala leaves the metal site in a similar environment, but creates a pocket for reversible binding of small anions to the iron(II) center. Specifically, azide forms a high-spin iron(II) complex and cyanide forms a low-spin iron(II) complex.
Keywords: metalloprotein, azurin, iron(II), Mössbauer, crystallography
Introduction
Nature uses proteins as scaffolds for controlling transition-metal behavior, and chemists have learned to adapt naturally occurring scaffolds for artificial uses.1,2 Protein engineers have developed routes to functional and spectroscopic models of metalloenzymes with both rational design and directed evolution strategies.3-10 Despite many successes in the area, artificial complexes containing unsaturated iron sites remain a relatively unexplored area.5,11-16 Preparation of such complexes could further our understanding of non-heme iron enzymes that activate small molecules,17-20 broaden the applications of iron chemistry, and facilitate the use of unsaturated iron complexes in a water-soluble scaffold.
In this work, Pseudomonas aeruginosa (Pa) azurin is used as a scaffold to bind iron in a low-coordinate environment. Azurins are “type 1” copper metalloproteins that are utilized in plants and bacteria for electron transfer, in which the copper cofactor cycles between colorless copper(I) and blue copper(II) forms.21 Azurins and related proteins have received attention in the bioinorganic chemistry community due to their interesting spectroscopy and electronic structure in the oxidized copper(II) form, as well as their ability to accomplish very fast electron transfer.22,23 The properties of azurins are a result of the unusual geometric structure of the copper binding site, which is between the residues His46, Cys112, His117, Gly45, and Met121 (P. aeruginosa numbering). The two histidines and the cysteine coordinate to copper in a roughly trigonal-planar geometry, and the sulfur of Met121 (3.1-3.3 Å) and the oxygen of Gly45 (2.6-3.1 Å) are more distant (Figure 1).24 Descriptions of the coordination number at copper vary depending on whether Met121 and Gly45 are considered as donors or not.21,22 The binding site is considered rigid, because the residues in the active site have a similar geometry in the apoprotein as in the native copper-bound azurin (Figure 2).23-26 The copper site of azurin can accommodate alternative metals, such as Zn2+, Ni2+, Co2+, Mn2+, Cd2+, Au+, Ag+, and Hg2+.27-36
Figure 1.

The metal site of the blue copper protein azurin, indicating changes intended to create an unsaturated iron site.
Figure 2.

The unoccupied metal site in the X-ray crystal structure of apo-azurin (PDB 1E65).26
The ease of preparation and the great stability of azurin have made it the target of extensive protein engineering efforts. His46Gly, His117Gly, Met121Ala, and Met121Gly variants have open spaces near their copper sites, and exogenous donors bind at the copper site without changes in the protein fold.21,37-39 Azurin is a durable scaffold, forming stable copper(II) complexes with up to four mutations in the vicinity of its single metal binding site.40-49
Despite success in incorporating other first row transition metals, iron binding to apo-azurin has not been demonstrated. Nonheme iron(II) complexes lack easily detected perpendicular-mode EPR signals and intense electronic absorption bands, but other spectroscopic techniques can reveal electronic and geometric features of the metal ion in the unusual apo-azurin metal-binding site. In this work, we take advantage of 57Fe Mössbauer and paramagnetic 1H NMR spectroscopies, which are combined with quantum-chemical computations to confirm the geometric and electronic structure of the high-spin iron(II) center. We also show that a binding pocket may be introduced, enabling the iron(II) species to bind azide and cyanide at the iron center.
Results and Discussion
Preparation of Iron Complexes of Apo-Azurin
We expressed recombinant Pa azurin and its Met121Ala variant in E. coli, using a modified literature procedure (see Experimental Section).45 Protein expression yielded a mixture of apo-azurin, Cu-azurin, and Zn-azurin. The apo-azurin was separated and purified on an anion exchange column, and gel electrophoresis of the protein is shown in Figure S1. In the course of these studies, we learned that even small amounts of zinc in media or containers react with apo-azurin to give significant amounts of zinc(II)-azurin, which does not bind iron(II). Commercial plastic releases significant amounts of zinc(II), as we verified by atomic absorption spectroscopy. Therefore, it was essential to treat all glassware and plasticware with nitric acid or EDTA to remove trace zinc(II), and to remove trace metal ions from buffers and water with Chelex resin. Additionally, it was necessary to use high-grade (99.999% metal analysis) acetate during the purification to obtain apoproteins with zinc content below 10%.
The addition of iron(II) sulfate to buffered solutions of wild-type apo-azurin results in the development of UV bands with maxima at 322 and 364 nm, which are attributed to the iron(II) complex of apo-azurin (Figure 3). Iron binds to the Met121Ala azurin apo-protein to give a similar UV-vis spectrum (see Figure 4 and text below); iron(II) binding to the mutant is much more rapid than to the wild-type protein, as seen for copper(II) binding.50 In copper systems, this difference has been attributed to the Met121 residue hindering access to the metal site.37 The intensity of these bands was the same using 1 equiv or excess iron(II), indicating strong binding of the iron(II) ions in solution (a conservative upper limit is Kd < 1 μM).
Figure 3.

Growth of bands at 322 and 364 nm after the addition of 1 equiv of Fe2+ to wild type apo-azurin (0.18 mM). Inset: time course of the absorbance maxima of the two bands. The solid lines are exponential fits to the absorbances.
Figure 4.

UV-visible spectra of iron(II) azurins (73 μM). Top spectrum: wild type. Bottom spectrum: Met121Ala variant.
If iron(II) binds to the copper site, one expects the presence of iron(II) to influence the copper(II) binding affinity. In the literature, copper(II) binding to apo-azurin is relatively rapid (t1/2 = 14 minutes with 0.01 mM apo-azurin and 100 equiv of CuSO4 at pH = 5.0), yielding copper(II) azurin with a strong band (λmax = 625 nm with ε = 5.7 cm-1mM-1) that gives the holo-protein an intense blue color.21-23 Under our conditions of 0.1 mM apo-azurin and 10 equiv of copper (pH = 7.0), development of the characteristic 625-nm band upon addition of copper(II) to apo-azurin occurs with a half-life of less than 5 minutes and copper(II) binding to the apo-Met121Ala protein is complete in less than 1 minute. However, the addition of copper(II) to samples of each iron(II)-substituted azurin (0.1 mM) gives less than 20% copper incorporation after 2 days. Therefore, copper(II) binds more strongly than iron(II) to apo-azurin, but iron(II) greatly hinders copper(II) incorporation, most likely by binding to the same site.
Exchanging the buffer of the iron(II)-substituted protein three times resulted in no significant influence to the UV-Vis spectrum, as shown by comparing the ratio of the 322 and 364 nm bands to that of the 280 nm band of the protein. This result indicates that the rate of iron(II) dissociation from the protein is very slow. After buffer exchange and digestion of the iron substituted protein with acid, a colorimetric assay to quantify the amount of iron51,52 indicated 0.93 Fe/protein for the wild-type protein and 0.78 Fe/protein for the Met121Ala variant.
Iron sites in metalloproteins often function through redox reactions, and most iron(II) complexes in four-coordinate and five-coordinate environments are easily oxidized to iron(III). However, the wild-type iron(II)-azurin was surprisingly resistant to redox reactions. The UV-vis, X-band EPR, and 1H NMR spectra (see below for spectroscopic signatures) do not change for either iron protein variant after treatment with various oxidizing agents (O2, Co3+-EDTA, ferricyanide, Ce4+) or reducing agents (dithionite, titanium citrate, Eu2+-DPTA,53 DTT, sodium borohydride). The UV-vis spectrum of wild-type iron(II) azurin was also unchanged after heating to 70 °C overnight, and under acid/base conditions as low as pH 5.0 and as high as pH 10.5 for days. Thus, the iron-substituted proteins are quite robust to a wide range of oxidation/reduction potential, temperature and pH.
UV-Vis Characterization
The wild-type iron(II)-azurin exhibits UV absorption bands with maxima at λ = 322 (ε = 2400 M-1cm-1) and 364 nm (ε = 1000 M-1cm-1), whereas the Met121Ala variant gives absorptions that are shifted slightly to 316 (ε = 1800 M-1cm-1) and 360 nm (ε = 340 M-1cm-1) (Figure 4). The similarity between the energies of the bands in the two metalloproteins suggests that the Fe2+ ions have a similar coordination environment. Comparing to other reported metal-substituted azurins,54 there is a consistent trend (Table 1) in the UV-visible absorption energies Cu2+ < Ni2+ < Co2+ < Fe2+. We assign these to ligand-to-metal charge transfer (LMCT) transitions, which are expected to increase in energy as one moves from right to left across the periodic table as a result of the acceptor d orbitals shifting to higher energy. In support of this idea, literature thiolate model complexes of these divalent metals have LMCT transitions with similar energies to the metalloproteins (Table 2).55-58 Since the model complexes have a pseudotetrahedral geometry, the similarity in the energies of the LMCT bands between the iron(II) azurins and small-molecule pseudotetrahedral iron(II) complexes implies that the iron-substituted azurins also have a similar high-spin iron(II) electronic configuration with a pseudotetrahedral geometry. This idea is consistent with the crystal structures and spectroscopic analysis of other metal substituted azurins (Co2+, Ni2+, Zn2+), which have three strongly coordinating residues (Cys112, His47, His117) as well as binding to Gly45.21 Below, we use quantum-chemical computations to support and enrich our understanding of the coordination environment.
Table 1.
LMCT Bands for Metal-Substituted Azurins and Model Complexes.
| M2+-azurin | λ1(cm-1)×10-4 (ε(cm 1mM-1)) | λ2(cm-1)×10-4 (ε(cm 1mM-1)) | Model complex | λ1(cm-1)×10-4 (ε(cm 1mM-1)) | λ2(cm-1)×10-4 (ε(cm 1mM-1)) |
|---|---|---|---|---|---|
| Fe2+ | 2.75 (1.0) | 3.11 (2.4) | Fe2+L(SC6F5)a | 2.82 (1.4) | 3.08 (5.9) |
| Fe2+ (Met121Ala) | 2.78 (0.34) | 3.16 (1.8) | |||
| Fe2+ (Met121Ala, N3–) | 2.78 (0.34) | 3.16 (1.9) | |||
| Co2+b | 2.68 (1.5) | 3.00 (4.0) | Co2+L(SC6F5)a | 2.94 (2.9) | 3.22(5.0) |
| Ni2+b | 2.28 (3.3) | 2.82 (1.6) | Ni2+L(SC6F5)a | 2.30 (1.7) | 2.80 (1.9) |
| Cu2+a | 1.60 (5.8) | NA | |||
| Cu2+ (Met121Ala)c | 1.59 (NA) | 2.17 (NA) | Cu2+L(SC6F5)a | 1.51 (6.0) | NA |
| Cu2+ (Met121Ala, N3–)c | 1.92 (NA) | 2.44 (NA) |
Table 2.
Mössbauer isomer shift and electric quadrupole splitting for some four-, five- and six-coordinate high-spin iron(II) compounds.
| Compound | Ligands | δ (mm/s) | ΔEQ (mm/s) | T (K) | Reference |
|---|---|---|---|---|---|
| Fe-Az | 2N,O,S | 0.90 | -3.17 | 80 | this work |
| C9S rubredoxin | 4S | 0.70 | -3.25 | 4.2 | 68 |
| C42S rubredoxin | 3S,O | 0.79 | -3.27/+2.95a | 4.2 | 69 |
| desulfoferrodoxin, | 74, 78 | ||||
| center I | 4S | 0.69 | 3.51 | 4.2 | |
| center II | 4N,S | 1.04 | 2.87 | 4.2 | |
| neelaredoxin | 4N,S | 1.02 | 2.80 | 4.2 | 79,80 |
| [FeII(cyclam)(tdt)]b | 4N,2S | 1.00 | +3.55 | 80 | 75 |
| Fe-Az(M121A) | 2N,O,S | 0.88 | 2.90 | 80 | this work |
| Fe-Az(M121A)-N3 | 3N,O,S | 1.02 | 2.74 | 80 | this work |
| Fe-Az(M121A)-CN | 2N,O,C,S | 0.37 | 0.70 | 80 | this work |
| [(TPP)Fe-CN]–c | 4N,C | 0.36 | 1.83 | 100 | 81 |
| [(TPP)(MeIm)Fe-CN]–c | 5N,C | 0.37 | 0.61 | 100 | 81 |
| cis-(phen)2Fe(CN)2 | 4N,2C | 0.18d | 0.58 | 298 | 82 |
Two forms were observed.
tdt = toluenedithiolate.
TPP = tetraphenylporphyrin; MeIm = 1-methylimidazole.
The value measured at room temperature is expected to be roughly 0.1 mm/s higher at 80 K due to the second-order Doppler shift.
Proton NMR Characterization
The binding of iron(II) to apo-azurin was also evaluated using 1H NMR spectra of 1-2 mM solutions of the proteins in 10% D2O/H2O. The addition of 1 equiv of iron(II) to apo-azurin causes the appearance of 10-15 resonances that have chemical shifts as extreme as δ 70 and -40 ppm. A portion of the spectra in the downfield region is shown below in Figure 9, and the full spectra are shown in Figures S2 and S3. Large shifts to the resonance frequencies occur in the vicinity of a paramagnetic metal ion, and the relatively small number of such resonances suggests that the paramagnetic center in iron(II)-azurin lies in a well-ordered position in the protein.59 The number of paramagnetically shifted peaks in the iron(II) azurin is similar to that previously observed in the 1H NMR spectra of cobalt(II) and nickel(II) substituted azurin proteins, which are also high-spin.60-65 Thus the 1H NMR spectra show that the iron(II) ion has a high-spin (S = 2) rather than a low-spin (S = 0) electronic configuration.59 There is no detectable EPR spectrum (X-band, perpendicular mode, 7-77 K), consistent with an integer-spin system. Many of the peaks in the paramagnetic 1H NMR spectra of the wild type and Met121Ala iron substituted proteins have similar chemical shifts, and the UV CD spectra of the two iron-azurin complexes are indistinguishable (Figure S4), suggesting that there are not significant conformational differences between the two species.
Figure 9.

Portions of the 1H NMR spectra of iron(II)-substituted Met121Ala azurin (1.2 mM) with addition of NaN3. After the sequential additions, the azide was removed to generate the bottom spectrum.
Mössbauer Characterization
Addition of 1 equiv of 57FeSO4 to the wild type and Met121Ala apo-azurin proteins gave 57Fe-azurin complexes for Mössbauer spectroscopy. The zero-field Mössbauer spectrum of the wild-type azurin complex with iron(II) at 80 K shows a single quadrupole doublet with high isomer shift and large quadrupole splitting (δ = 0.90 mm/s, |ΔEQ| = 3.17 mm/s, Fig. 5, top trace). The parameters are typical for iron(II) in a high-spin electronic configuration, and inconsistent with iron(III) or with low-spin iron(II). 66,67
Figure 5.

Zero-field Mössbauer spectra of frozen 1 mM solutions of (top) wild-type 57Fe-azurin, (middle) 57Fe-Met121Ala azurin, and (bottom) 57Fe-Met121Ala azurin + 100 mM N3–. The red lines are fits to the data, using the parameters given in the text. All spectra were recorded at 80 K.
The isomer shift of iron azurin is significantly higher than that of the tetrahedral Fe2+S4 sites found in rubredoxin,68,69 desulforedoxin70, and the valence-localized [2Fe-2S]1+ clusters,71,72 which have δ ≈ 0.7 mm/s (see also Table 2). Replacement of a cysteine sulfur by a serine oxygen donor in mutated rubredoxins causes an increase in the isomer shift of about 0.1 mm/s; a similar trend is observed for the effect of two nitrogens at the ferrous site of the reduced Rieske center (ca. 0.2 mm/s compared to ferredoxins).73 Thus, the isomer shift for iron azurin is as expected for a mixture of “soft” cysteine ligation and “hard” histidine ligation. On the other hand, the value for iron azurin is lower than that found for the square-pyramidal center II of desulfoferrodoxin,74 which has four histidine ligands and one cysteine (δ = 1.04 mm/s), and six-coordinate [FeII(cyclam)(tdt)] (δ = 1.0 mm/s).75 We attribute this difference to a lower coordination number in iron-azurin. However, the isomer shift is not as low as the values found for three-coordinate iron(II)-diketiminate complexes (δ 0.48-0.90 mm/s).76,77 In summary, the isomer shift of iron(II) azurin indicates a high-spin ferrous site with four ligands, some of which bind through sulfur.
Applied-field measurements revealed that the sign of the quadrupole splitting in iron(II) azurin is negative. The quadrupole splitting of ferrous high-spin complexes is usually dominated by a large valence contribution arising from the 3d6 configuration with one doubly occupied d orbital. The negative sign of the electric field gradient found for iron(II) azurin is consistent with an anisotropic valence charge distribution arising from a low-lying, doubly occupied dz2 orbital, and inconsistent with the β electron lying in a dx2-y2 or dxy orbital. This interpretation is consistent with quantum-chemical computations on the active site (see below).
Magnetic Mössbauer measurements with fields of 1 to 7 T applied perpendicular to the γ-rays revealed weak magnetic hyperfine splitting for iron(II) azurin (Fig. 6). The corresponding internal field indicates low and very anisotropic spin expectation values for the ground state, due to large zero-field splitting (zfs) of the S = 2 spin manifold of the ferrous iron. From spin-Hamiltonian simulations of the magnetic spectra a set of almost rhombic zero-field splitting (ZFS) parameters D = -15.1 cm-1 and E/D = 0.3 was found.
Figure 6.

Magnetic Mössbauer spectra recorded at 4.2 K and 80 K with fields of 1, 4, and 7 T applied perpendicular to the γ-rays. The red line is a spin Hamiltonian simulation for S = 2 with D = 14.3 cm-1, E/D = -0.37 (corresponds to D = -15.1 cm-1 and E/D = 0.3 in the usual convention 0≤E/D≤1/3, obtained by rotations with Euler angles α = 90°, β = 90°), A/gNβN = (-4.9, -5.4, -60.7) T, ΔEQ = -3.19 mm/s, η = 0.7 (efg rotated by α = 19°, β = 12°), δ = 0.93 mm/s.
Attempts to keep the D tensor, the electric-field gradient (EFG) and the A tensor collinear in the simulations did not yield acceptable fits. The best result was obtained with D being rotated around z- and y-axes by α = 90°, β = 90° with respect to the hyperfine coupling tensor, which has components A/gNβN = (-4.9, -5.4, -60.7) T. The EFG tensor was also slightly rotated with respect to A by α = 19°, β = 12°, with the asymmetry parameter being η = 0.7. In this model the spin system has easy magnetization for fields along the xy plane. Since the x- and y-components of A are small, this explains the weak magnetic splitting. The ZFS values, D and E/D, are significantly larger than those of tetrahedrally coordinated iron in rubredoxin or its C9S and C42S mutants.68,69
The zero-field Mössbauer parameters for the 57Fe-substituted Met121Ala variant were similar, displaying δ = 0.88 mm/s and ΔEQ = 2.90 mm/s. The relatively small changes in both δ and ΔEQ imply that the coordination geometry is not significantly changed by the Met121Ala mutation. Thus both variants most likely have four-coordinate iron(II) with a bond to the oxygen atom of Gly45. The crystal structures of cobalt(II)-, nickel(II)-, and zinc(II) substituted azurins show short M-O distances of 2.1-2.5 Å between the metal and the oxygen of Gly45, supporting this idea.27-29
Crystallographic Characterization
Colorless crystals of wild-type iron(II) azurin were obtained under conditions established for copper(II) azurin (see Experimental Section). Given the possibility of zinc incorporation, it was important to identify whether iron or zinc is present at the metal-binding site of the azurin protein in the crystal. Diffraction data (2.4-1.8 Å) were collected at X-ray wavelengths of 1.6082 Å and 1.2702 Å, which are on the high-energy side of the K-shell absorption edges for Fe and Zn respectively. Molecular replacement using the coordinates of copper(II) azurin gave refined structures with four independent molecules (A-D) in the asymmetric unit. Only chains B and C displayed significant anomalous diffraction at the active site indicative of metal-ion binding. There is substantially higher anomalous difference density at these metal sites with the Fe-edge data, compared to the Zn-edge data. If Co, Zn, or Cu were the major metal ion present, data from the higher energy (lower wavelength) edge would show greater anomalous diffraction, but this is clearly not the case (see Table S1).83 The iron occupancies at the B and C sites were refined to ca. 30% each by comparing the strength of the anomalous diffraction with the expected values (Table S1). Chains A and D do not contain any metal ions in these crystals. Despite the low iron occupancy, it is clear from the X-ray diffraction data that iron binds only to vacant copper sites of the protein. There was no electron density consistent with transition metals elsewhere in the protein.
Overlaying the metal-binding chains B and C of the iron-azurin model and any of the chains of the previously published copper-azurin structure24 shows no significant difference (Figure 7a). Although the bond lengths could not be precisely quantified due to the low occupancy of the metal-bound form, the metal is more than 2.5 Å from the sulfur of M121, and ~2.6 Å from the oxygen of G45. Thus, there are three firmly-bound ligands (H46, H117, C112) and two more distant potential donors (G45, M121), as found in structures of azurin with other metals.24,25,27-29
Figure 7.
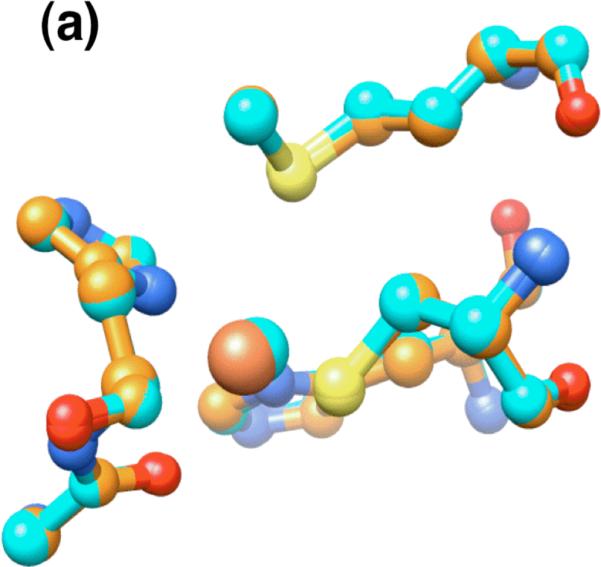

The metal site in the X-ray crystal structure of wild-type iron azurin. (a) Overlay of iron(II) (orange) and copper(II) (blue) azurins. (b) Overlay of chain B of iron(II) azurin (orange) with chain A of apo-azurin (white). The water molecule in apo-azurin is indicated. (c) Overlay of chain B of iron(II) azurin with chain B of apo-azurin.
Chains A and D of the iron(II)-azurin structure do not contain a metal ion and display a conformation where His117 shifts from its coordination position and a water molecule occupies the metal-binding site (Figure 7b and c). The structure of the apoprotein contains a similar asymmetric unit with four unique molecules, two which show the shift in His117 and water molecule binding, and two that do not. Overlaying the Fe-Az structure with the structure of the apoprotein26 reveals that the two proteins have nearly identical conformations in all four pairs of corresponding molecules, with chains A and D of the apoprotein matching chains A and D of the Fe-Az that lack metal ions. Despite the absence of metal, chains B and C of the apoprotein match the Fe-bound conformation of chains B and C in the Fe-Az structure. The consistency in the site conformations between our structure and that of apo-azurin suggests that crystal packing may generate a ligand conformation in chains A and D that is less favorable for iron(II) chelation. We also speculate that the high concentration of acetate (0.1 M) in the crystallization medium may have extracted iron ions from the protein over time, since iron(II) loss was not observed in other experiments.
Computational Evaluation of the Active Site
Quantum mechanics (QM) and hybrid quantum mechanics/molecular mechanics (QM/MM) geometry optimizations were used to characterize details of the iron geometry and electronic structure in the azurin protein. In the QM approach we employed a model that included the metal center and the coordinating amino acids. The steric effects of the remaining protein were taken into account by constraining Cα of the amino acids to the crystallographic positions, while the electrostatic effects were modeled by an implicit solvation model. In the QM/MM model the remainder of the protein was optimized, but at a computationally less demanding MM level.
Relevant structural parameters derived from these calculations are summarized in Table 3. In the wild-type structure, the bond lengths between iron and the in-plane amino acids (H46, C112, H117) are similar for the QM and QM/MM optimized geometries, while larger variations are obtained for the distances to the axial amino acid residues. Optimization of the geometry always led to a tetrahedral iron with an Fe-O(G45) bond (Figure S5). However, the bond to the amide oxygen was weak, and the energy varied only 1 kcal/mol with a 0.25 Å change in Fe-O distance (Table S2). The long Fe-S(M121) distance of >3 Å and the large variation of this distance in the QM/MM optimized structures indicates that there is no Fe-S bond. In addition, QM computations on the M121A mutant gave the same coordination geometry as the wild-type protein. The pseudotetrahedral geometry is consistent with the Mössbauer data above. Due to the similarity of the QM and QM/MM structural parameters, all subsequent property calculations were performed on the QM optimized models, unless indicated otherwise.
Table 3.
Bond distances (Å) in iron substituted azurin. For the QM/MM calculations, the average bond lengths and their standard deviations (values in parentheses) used five optimized MM conformations.
| Fe-O(G45) | Fe-N(H46) | Fe-S(C112) | Fe-N(H117) | Fe-S(M121) | |
|---|---|---|---|---|---|
| wt, X-raya | 2.59a | 2.00a | 2.29a | 2.07a | 3.36a |
| wt, QM | 2.12 | 2.09 | 2.27 | 2.05 | 3.66 |
| wt, QM/MM | 2.14 (0.04) | 2.09 (0.01) | 2.25 (0.01) | 2.04 (0.01) | 3.48 (0.25) |
| M121A, QM | 2.08 | 2.06 | 2.22 | 2.05 | - |
The crystallographically determined bond distances should be viewed with caution, due to the low occupancy of the iron-bound form in the crystal structure, and the influence of the crystal lattice on the metal site geometry.
In order to compare the computational model with the experimental Mössbauer parameters, we calculated the quadrupole splittings84 for iron of both the wild-type and M121A mutant. These reproduce the experimental values with high accuracy (Table 4). The contributions to the difference between the mutant and the wild-type values were quantified by calculating the quadrupole splitting for an unrelaxed M121A mutant of the wild-type structure (“wt + Ala121” in Table 4). Assuming additivity, approximately two thirds of the difference can thus be attributed to geometry relaxation between the two forms, while one third is attributable to the mutation per se. However, it should be borne in mind that there is only a minor change in the iron geometry and quadrupole splitting upon mutation.
Table 4.
Calculated Mossbauer parameters; experimental values are in parentheses.
| δ (mm/s) | ΔEQ (mm/s) | |
|---|---|---|
| wt | 0.70 (0.90) | -3.15 (-3.17) |
| wt + Ala121 | 0.69 | -3.09 |
| mutant | 0.68 (0.88) | -2.98 (-2.90) |
The isomer shifts were also calculated from the electron density at the iron nucleus using a literature correlation,85 and they reproduce the slight experimental change of -0.02 mm/s in isomer shift upon mutation. Surprisingly, there was a systematic deviation of 0.20 mm/s from the experimental values. A possible cause for this discrepancy could be that the regression parameters from the literature fit are not transferable to the unusual coordination environment in this protein.
Multiconfigurational CASSCF and NEVPT2 ab initio calculations were carried out on the QM optimized geometries to model the zero field splitting parameters. (At the DFT level of theory the calculated D value was in poor agreement with experimental data (Table S3), as seen in other systems.86-89) The spin-spin coupling (SSC) and spin-orbit coupling (SOC) contributions were calculated using quasi-degenerate perturbation theory (QDPT), and the D and E values were subsequently calculated using effective Hamiltonian theory.90 The individual contribution of each excited state to DSOC was obtained using second-order perturbation theory.91
The calculated ground state is 5A1, as expected for a tetrahedron that is flattened along the z-axis. As depicted in Figure 8, the doubly occupied orbital is dz2. In the wild type iron-azurin, the dominant SOC contribution to the ZFS comes from a low lying 5B1 excited state that results from spin-conserving single excitation (Table 5). The CASSCF(6,5) calculation predicts a SOC contribution of -17.1 cm-1, approximately 87% of the total DSOC. Inclusion of dynamic correlation in the NEVPT2 approach results in an increase of the 5A1→5B1 transition energy, thus reducing the contribution of the excited state to -14.1 cm-1. The treatment of the spin-orbit coupling to infinite order by means of the QDPT method results in a DSOC of -14.6 cm-1, close to the one obtained from second order perturbation theory. Inclusion of the SSC contribution results in a D value of -14.8 cm-1, in good agreement with the experimental D value of -15.1 cm-1. Note that the high rhombicity measured experimentally (E/D = 0.3) and confirmed computationally (E/D ~ 0.25) renders the sign of D ambiguous.
Figure 8.

The metal d-based molecular orbitals for the wild-type iron(II)-azurin from a CASSCF calculation. The right side of the figure shows single excitations that lead to spin-orbit coupling, analyzed under approximate D2d symmetry.
Table 5.
Calculated transition energies (cm-1) for the spin conserving d-d excitations and their contributions to the DSOC values obtained from second order perturbation theory in the case of the wild-type structure. DSS, DSOC, D and E/D calculated with the effective Hamiltonian method are also presented.
| CASSCF | NEVPT2 | ||||
|---|---|---|---|---|---|
| State | Trans. energy | D contr. | Trans. energy | D contr. | |
| 5B1 (dz2→dx2-y2) | 643 | -17.1 | 780 | -14.1 | |
| 5E (dz2→dxz) | 3586 | 1.4 | 4281 | 1.1 | |
| 2nd order | 5E (dz2→dyz) | 4812 | 0.6 | 5546 | 0.5 |
| 5B2 (dz2→dxy) | 7161 | -2.4 | 8363 | -2.0 | |
| D SOC | -19.5 | -16.6 | |||
| D SS | 0.5 | 0.5 | |||
| QDPT | D SOC | -16.4 | -14.6 | ||
| D | -16.6 | -14.8 | |||
| E/D | 0.25 | 0.25 | |||
| Exp | D | -15.1 | |||
| E/D | 0.3 | ||||
It is also important to gauge the sensitivity of the spectroscopic parameters to small changes that could be imposed by the protein structure.92-95 Therefore, we calculated the ZFS parameters for five QM/MM optimized structures that resulted from different low-energy protein conformations. At the NEVPT2 level of theory, |DSOC| is consistently predicted at 11.8 ± 0.3 cm-1, despite the significant variations in Fe-Met121 distances in these structures (see above). The minimal variation of the ZFS suggests that Met121 has little influence on the iron electronic structure. Interestingly, substituting the MM point charges from the QM/MM calculation with an implicit COSMO model for the protein also has little influence on the calculated |DSOC| value (12.9 ± 0.9 cm-1), while a gas phase calculation gave a value of 17.1 ± 2.6 cm-1. So, though the ZFS parameters are sensitive to bulk dielectric effects inside the active site cavity, they are not very sensitive to specific second-sphere influences from the protein.
Small molecule binding
The Met121Ala mutation was anticipated to create an open site in the axial position of the metal atom. Previous work on copper(II) azurins has demonstrated the binding of exogenous ligands to the metal ion.21,37-39 To test this hypothesis, we surveyed several potential exogenous ligands that could bind to a coordinatively unsaturated iron(II) center.
The addition of sodium azide to the Met121Ala iron substituted azurin at pH 7 resulted in the immediate appearance of a new set of highly shifted peaks in 1H NMR spectra (Figures 9 and S6), suggesting that azide binds rapidly at or near the paramagnetic iron(II) center. With moderate amounts of azide (1 to 100 mM), the resonances for the azide-free form coexist with the new species, indicating that azide exchange is slow on the NMR time scale. At high concentrations of azide ([N3–] > 100 mM) there was complete conversion to the new species. Though the baseline correction and overlap in the 1H NMR spectra prevent quantitatively reliable integrations, it is possible to estimate Kd ≈ 0.02 M. In control experiments, (a) addition of azide to the wild-type iron azurin resulted in no change to its 1H NMR spectrum and (b) addition of azide to iron-Met121Ala azurin caused no changes to its UV CD spectrum (Figure S4), suggesting that there is no conformational change in the protein. These results suggest that, as in the Cu2+-Met121Ala azurin,37,96 the Met121Ala mutant of the Fe2+-azurin has a small molecule binding pocket over the metal site, in the space vacated by the methionine residue. In the adduct, the iron(II) ion remains in a high-spin electronic configuration.
The isomer shift in Mössbauer spectra increases upon coordination of additional ligands in high-spin complexes, but is not very sensitive to the precise geometry around the iron atom.66 Thus it is an ideal method for confirming the idea that added azide coordinates to iron(II). The addition of 100 equiv of sodium azide (120 mM) to 57Fe2+-substituted Met121Ala azurin resulted in a shift in δ from 0.88 to 1.02 mm/s and ΔEQ from 2.90 to 2.74 mm/s (Figure 5, see above). The significant change of 0.14 mm/s in the isomer shift is consistent with coordination of an additional ligand, and is too large to explain through a conformational change. The higher isomer shift also suggests that the metal remains coordinated to Gly45.
Potassium cyanide was tested as another potential ligand for iron(II), and these studies were done above pH = 10.0 (100 mM CAPS buffer) to avoid excessive formation of HCN. CD spectra (Figure S4) verified that there is no significant structural change in the protein at this pH. The addition of KCN to iron-substituted Met121Ala azurin resulted in a rapid, [KCN]-dependent loss of the paramagnetically shifted signals in the 1H NMR spectrum (Figure S7), and changes in the UV-Vis spectrum that were insignificant relative to the background [KCN]. After the addition of 50 mM of potassium cyanide (50 equiv relative to protein) no paramagnetically shifted signals were detectable in the 1H NMR spectrum. When the excess cyanide was removed from the solution via repeated buffer exchanges, the UV-Vis and 1H NMR spectra returned, and were nearly identical to the original iron-substituted Met121Ala azurin.97 The absence of paramagnetically shifted 1H NMR signals in the adduct indicates that the iron(II) ion is low-spin in the iron azurin cyanide complex. Mössbauer spectroscopy was used to support this conclusion. Addition of cyanide to 57Fe2+-substituted M121A azurin gave partial conversion to a new species with Mössbauer parameters of δ = 0.37 mm/s and ΔEQ 0.70 mm/s (Figure S8). These values are drastically different from the high-spin iron(II) complexes above, and similar to those previously observed for low-spin iron(II) mono-cyanide complexes (Table 2).81,82
To gain further insight into the cyanide binding, FTIR spectra were collected on protein solutions at pH 10 with 5 mM and with 88 mM cyanide (~ 10 equiv and ~150 equiv, respectively) (Figure 10). Though there is a small interfering protein band at 2048 cm-1, the cyanide species has a new [CN–]-dependent band at 2039 cm-1. This signal, which is roughly 100 times more intense than that for free cyanide, is assigned to the cyanide adduct of iron(II) azurin. This CN stretching frequency is significantly lower than the value of 2080 cm-1 in free cyanide, and the decrease is attributable to backbonding from iron(II) into the π* orbitals of cyanide. We tentatively attibute this unusually low81 stretching frequency to the lower coordination number in the iron(II)-azurin, which gives enhanced backbonding as recently described in tetrahedral synthetic iron-carbonyl complexes.98 However, the need to add excess cyanide to achieve full binding implies that cyanide binding to iron(II) ion within the vacant space created by the Met121Ala mutation is not exceptionally strong (we estimate Kd(CN–) = 0.001-0.005 M based on the NMR and IR titrations). So, though cyanide acts as a strong-field ligand with respect to the ligand-field splitting, it does not bind especially strongly to the iron(II) ion.
Figure 10.

FTIR spectra of solutions of 1.1 mM iron(II)-azurin in 25 mM MOPS buffer at pH 10, with addition of 5 mM (purple) and 88 mM (red) cyanide. For comparison, the spectra of iron(II) azurin (green) and cyanide (blue dashed) are overlaid on the spectrum. The peak at 2080 cm-1 is due to free cyanide. The peak at 2043 cm-1 at low [CN–] fits to the sum of two Lorentzian peaks (Figure S9), consistent with a superposition of the residual protein peak at 2048 cm-1 and the C-N stretching band of the cyanide adduct at 2039 cm-1.
Addition of N-methylformamide (200 mM), hydrazine (100 mM), or carbon monoxide (1 atm) to the iron(II) complex of Met121Ala apo-azurin resulted in no significant changes to the paramagnetically shifted resonances in its 1H NMR spectra. The inability to bind these species could be due to the size, shape, lack of charge, or inherent binding ability of each of these small molecules. Previous studies on thiolate-bound, low coordinate iron complexes have shown that the variations in binding strength for additional ligands can be attributed to a mixture of steric effects and electronic effects (both σ-donation and π-backbonding).99
Conclusions
Iron(II) binds strongly to apo-azurin to form a iron(II)-azurin complex that is surprisingly stable to oxidation. Considering that the type 1 copper binding site prefers copper(I) (high Cu2+/1+ reduction potential),100 it is likely that the high charge of iron(III) is not compatible with the azurin binding site, and this prevents the oxidation of iron(II). The stability of the iron(II)-protein complex has enabled its characterization using UV-Vis, 1H NMR, and Mössbauer spectroscopies, as well as X-ray crystallography. These techniques, in combination with computations, give strong evidence for a low-coordinate iron(II) site in which the three biological copper(II) ligands (His46, Cys112, and His117) are accompanied by an interaction with Gly45. There is no significant interaction with the axial Met121. The ferrous site has a high-spin electronic configuration, with the sixthvalence electron in the dz2 orbital.
Removal of a sidechain through an Met121Ala mutation does not significantly change the coordination environment or electronic structure of the iron(II) ion, but creates a metal binding site that accommodates azide and cyanide. The azide adduct is high-spin and five-coordinate, but the cyanide adduct is low-spin. Binding of each of these exogenous ligands is reversible. These studies indicate that protein engineering is a viable strategy for introducing a reactive iron(II) binding site in azurin, and suggest that further engineering will lead to novel iron chemistry. In addition, we emphasize the usefulness of Mössbauer spectroscopy and calculations to accurately define the geometry and electronic structure of the iron site in an engineered protein.
Experimental Section
All manipulations involving iron were carried out using standard Schlenk or glovebox techniques under a dinitrogen atmosphere. Unless otherwise noted, solutions were made with water purified with a Barnstead NANOpure DIamond™ Life Sciences (UV/UF) ultrapure water system. Purified water and protein solutions were deoxygenated under vacuum for 12 hours and sparged with nitrogen for 15 minutes before use. Glassware was soaked in 1 M nitric acid and plastics were soaked in 1 M EDTA for 24 hours before use. Buffer solutions with a pH above 4 were stirred with Chelex 100 sodium form (Sigma-Aldrich) overnight to remove trace metals. UV-Vis measurements were taken with either a Cary 50 Bio UV/Vis spectrometer or a HP 8452A Diode Array Spectrophotometer. All buffers were the highest grade available on a per metals basis and purchased from EMD Biosciences, except the acetate buffers which were synthesized from sodium hydroxide, ammonium acetate, and acetic acid purchased from Sigma-Aldrich. The iron(II) sulfate, potassium cyanide, and sodium azide were 98%+ from Sigma-Aldrich. CAUTION: Azide and cyanide salts are hazardous. We used azide solutions only at or above pH = 7, and cyanide solutions at or above pH = 10, to avoid exposure to gaseous HN3 or HCN.
Preparation and Purification of Apoazurin
Pseudomonas aeruginosa (Pa) apo-azurin was overexpressed and purified using methods analogous to a previous protocol.45 The P. aeruginosa azurin gene in a pET9a vector, obtained from Professor John H. Richards,101 was expressed at 25 °C in BL21*(DE3) E. coli (Invitrogen) in 6 L of 2xYT media (16 hours, 25 °C). The overexpression of protein was induced with 450 mg of Isopropyl-beta-D thiogalactopyranoside (IPTG) and shaken for an additional 4 hours at 25 °C. The cells were collected by centrifugation (9000 rpm, 10 min) followed by resuspension in buffer (20% sucrose (w/v), 1 mM EDTA, 30 mM TrisHCl, pH = 8.0, 1 L) and shaken at 4 °C for 40 minutes. The cells were collected by centrifugation and the supernatant was decanted. The cells were resuspended in a solution composed of 4 mM NaCl and 1 mM DTT (1 L) and shaken vigorously at 4 °C for 10 minutes. The insoluble cell fragments were collected by centrifugation and the protein was decanted into a cool 2-L Erlenmeyer flask. The pH of the solution was reduced by the dropwise addition of 100 mL of 500 mM acetate buffer at pH = 4.1, The precipitated protein was removed by centrifugation and the supernatant was mixed with SP Sepharose fast flow beads (GE Healthcare) and stirred at 4 °C for 5 minutes. The beads were collected on a frit and washed with buffer (50 mM acetate buffer, pH = 4.1) until the UV detector had a flat baseline. The contaminating zinc azurin was removed by washing the column with 192 mL of pH = 5.34 acetate buffer. Apo-azurin was eluted with 448 mL of pH = 6.01 acetate buffer. The protein was pure by gel electrophoresis. When titrated with copper(II) sulfate, it showed the expected 625/280 nm ratio of 0.58.21 The buffer was exchanged into 50 mM 3-(N-morpholino)propanesulfonic acid (MOPS)) buffer (pH = 7.0) using a PD10 desalting column (GE Healthcare, Sephadex G-25 Medium, volume 13.5 mL). The zinc content of the protein was measured by atomic absorption spectroscopy. Following this protocol, the zinc content was shown to be less than 7% relative to the protein. The protein concentration was estimated from the 280 nm absorbance using the literature extinction coefficient of 9.0 mM-1cm-1.21
Site-Directed Mutagenesis
The pET9a (Kanr) plasmid containing the azurin gene was used as a template for site directed mutagenesis. The Met121Ala mutation was accomplished according to the QuickChange II method (Stratagene, La Jolla, CA) using the following primer in which the mutated site is underlined.
5′-GGGTCACTCCGCACTGGCGAAAGGTACCCTGACTC-3′
The parental DNA was digested with Dpn1 at 37 °C for 2 h and the final product was transformed into XL1-Blue supercompetent cells (Stratagene, La Jolla, CA). DNA sequencing confirmed the mutations. The plasmids were transformed into BL21(DE3)* cells (Invitrogen) for expression and the protein was overexpressed and purified using methods described above.
Preparation of Iron(II) Azurin
FeSO4 or 57FeSO4 was dissolved in H2O (17 mg in 500 μL, 0.12 M). A stock solution of 20 mM 3-(N-morpholino)propanesulfonic acid (MOPS) was prepared by the addition of 419 mg of MOPS to 100 mL water, and adjusted to pH 7.0 with 2 M sodium hydroxide. A solution of apoprotein (89 μL of a 2.82 mM solution) was diluted to 450 μL with the 20 mM MOPS buffer to give a 0.56 mM solution. The iron(II) metalloderivatives were prepared by the addition of 3.1 μL (252 nmol, 1 equiv) of the FeSO4 solution to the 450 μL solution of apoprotein. Mixtures were left for at least 12 h before purification to allow complete loading. Loading was monitored by observing the UV-Vis spectrum: the wild type protein showed absorbance at 322 and 364 nm (ε = 2.4, 1.4 mM-1cm-1) whereas the Met121Ala mutant had absorbance at 360 and 316 nm (ε = 1.8, 0.29 mM-1cm-1). The extinction coefficients were determined by relating the absorbance to the estimated Fe-azurin extinction coefficient of 9.0 mM-1cm-1 at 280 nm.21 Excess iron was removed by washing the protein with buffer on a Centricon concentrator (GE Healthcare, 3 kDa filter).
Iron Determination
Iron concentrations were determined following a literature procedure.51 This colorimetric iron determination indicated 93% and 78% iron for the wild type and Met121Ala substituted proteins, respectively. The protein concentrations were calculated from the intensity of the absorbance bands at 280 nm using ε = 9.0 mM-1cm-1.21
1H NMR Spectroscopy of Iron(II) Azurin
NMR spectra were collected on a Varian Inova 600-MHz spectrometer. The spectra were acquired using a super-WEFT pulse sequence, d1-180°-Δ-90°-ta where Δ = 21.7 ms and ta + d1 = 117 ms. The spectra were acquired with a spectral width of 120 kHz and processed using 30 Hz of Gaussian line broadening. Delays were selected to optimize water suppression, rather than diamagnetic protein suppression.
Mössbauer Spectroscopy
Mössbauer spectra were recorded on a conventional spectrometer with alternating constant acceleration of the γ-source. The minimum experimental line width was 0.24 mm/s (full width at half-height). The sample temperature was maintained constant in an Oxford Instruments Variox or in an Oxford Instruments Mössbauer-Spectromag cryostat with split-pair magnet system; the latter was used for measurements with applied fields up to 7 T with the field at the sample being oriented perpendicular to the γ-beam. The γ-source (57Co/Rh, 1.8 GBq) was kept at room temperature. By using a re-entrant bore tube the γ-source could be positioned inside the gap of the magnet coils at a position with zero field. Isomer shifts are quoted relative to iron metal at 300 K. Magnetic Mössbauer spectra were simulated with the program MX (by E.B.) by diagonalization of the spin Hamiltonian for S = 2:
| (1) |
where g is the average electronic g value, and D and E/D are the axial zero-field splitting and rhombicity. The hyperfine interaction for 57Fe was calculated by using the usual nuclear Hamiltonian.66
FTIR Spectroscopy
Infrared measurements were carried out on solutions of 0.6 mM protein with 100 mM buffer (MOPS at pH 7.0 for N3– or CAPS at pH 10.0 for CN–), using a Bruker IFS 66v/s FTIR spectrometer with 2 cm-1 resolution. The detector was a photovoltaic mercury cadmium telluride (MCT) element. Data recording used the OPUS package (Bruker Optics), while analysis and further processing used MATLAB 7.0 (Mathworks).
Zinc Analysis
Zinc concentrations were determined using a Perkin-Elmer AAnalyst 600 atomic absorption spectrometer equipped with longitudinal Zeeman background correction and a transverse heated graphite furnace (Perkin-Elmer Life and Analytical Sciences, Shelton, CT 06484 USA). A PerkinElmer Lumina Zn hollow cathode lamp was used. Spectrometer settings: Wavelength, 213.9 nm; Slit width, 0.7 nm; Zn lamp current, 15 mA; Background correction, Zeeman-effect; Integration time, 5 seconds; Injection volume, 10 μL.
Crystallographic Characterization
Crystals were obtained by hanging-drop vapor diffusion against well solutions of 3.0-3.5 M ammonium sulfate, 0.5 M lithium nitrate, and 0.1 M sodium acetate at pH 5.2-5.4. Iron(II)-azurin (40 mg/mL) was mixed 1:1 (v/v) to a total volume of 2 μL and set up against 500 μL of well solution. Colorless diamond-shaped plates 200 μm in length appeared amidst precipitate within 2-3 weeks. X-ray diffraction datasets were collected at CHESS on beamlines A1 and F2. Data were indexed and scaled with HKL2000102 and phases were determined by molecular replacement with the Phenix software suite103 using the coordinates of Cu-Az (PDB code 1AZU) as a probe. The models were fit to the density using XtalView104 and COOT105, and the structures were refined to 2.4 – 1.8 Å resolution with the CNS106 software suite (Table S6).
QM Models
The initial coordinates for the wild-type model were based on subunit C of the crystallographic structure. The QM model included the iron atom and amino acids G45, H46, C112, H117 and M121. Geometry optimizations were performed with the BP86 functional107,108 and the segmented all-electron relativistically contracted (SARC) def2-TZVP(-f) basis set.109,110 Resolution of identity with the def2-TZVP/J basis set111 was used to speed up the calculation. In addition, relativistic corrections were included by means of the zeroth-order regular approximation (ZORA) Hamiltonian and dispersion effects were modeled with the latest parameterization of Grimme's group.112 During the geometry optimization the steric and electrostatic effects of the missing protein were approximated by freezing the Cα carbons of the amino acids and by using a COSMO model113 with a dielectric constant of 4, respectively. In the case of the mutant, the initial coordinates were obtained by replacing M121 with an alanine residue. All calculations (geometry optimizations and spectroscopic parameters) were performed with the ORCA program.114
QM/MM models
MM simulations were performed with the pDynamo115 library that provides the MM description of the system and a convenient interface with the ORCA program for the QM treatment. The entire subunit C was included in the calculations, which were limited to the wild-type form.
The protonation state of residues were assigned using PROPKA 3.0,116 and were verified by visual inspection. The positions of the hydrogen atoms were refined by a short classical energy minimization while constraining the heavy atoms to their crystallographic positions. The system was then “soaked” in a pre-equilibrated TIP3P117 water box of dimensions 58x58x62 Å and was neutralized by adding two Na+ ions. Afterwards the system was equilibrated at 298.15 K using Langevin-Verlet molecular dynamics. The electrostatic and Lennard-Jones interactions were calculated using an atom-based force-switching method with inner and outer cutoffs of 8 and 12 Å, respectively. During the equilibration procedure the position of the iron atom and the coordinating amino acids was constrained to the crystallographic coordinates. Five snapshots were extracted for subsequent QM/MM geometry optimizations. For the selected snapshots only the water molecules within 5 Å of the protein were kept, in order to reduce the number of point charges that enter the QM Hamiltonian. The reported geometrical parameters are averaged over the five QM/MM optimized geometries.
The OPLS-AA force field118 was used to describe the protein, while the iron atom, the C and O atoms from the peptide bond of residues M44 and H46, the side chain of C112, H117 and M121 residues, and the entire G45 and H46 residues were included in the QM region and were treated at the same level of theory as in the previously described QM calculations.
Calculation of Mössbauer Parameters
The quadrupole splitting parameter for 57Fe of the nuclear excited state (I = 3/2) is given by:
where e0 is the elementary charge, Q is the quadrupole moment of the 57Fe nucleus and in this study is equal to 0.16 barn, and η = (Vyy – Vxx)/Vzz is the asymmetry parameter with the principal component of the electric field gradient (EFG) |Vzz| ≥ |Vyy| ≥ |Vxx|. The EFG tensor (V) was calculated with the B3LYP functional, 119,120 def2-TZVP(-f) basis set, ZORA approximation and a COSMO model with a dielectric constant of 4.
The isomer shift depends linearly on the electron density at the iron nucleus, ρ(0):
where α and β are parameters determined by a linear regression, and the number C is a scaling parameter introduced for convenience. Since the density at the nucleus varies with the density functional and basis set used, each combination requires a new calibration procedure. All isomer shift calculations reported in the present paper where done with the B3LYP functional, TZVP basis set and ZORA. For this particular functional / basis set combination the regression parameters are: α = -0.312, β = 4.103, C = 13770.85
Calculation of Zero-Field Splitting Parameters
The effects of the zero-field splitting (ZFS) are usually described by the following spin Hamiltonian:
where Ŝ is the fictitious spin of the ground state and D is the ZFS tensor. In the absence of an external magnetic field and for systems with S > 1/2, the ZFS term lifts the degeneracy of the 2S+1 magnetic sublevels. The ZFS tensor consists of spin-spin coupling (SSC) and spin-orbit coupling (SOC) contributions, the latter being assumed to be dominant for the present systems.
The SOC contributions to the D tensor were calculated using both the well-established perturbation treatment91 and the quasi-degenerate perturbation theory (QDPT). The Breit-Pauli two-electron SOC operator was represented by the spin-orbit mean field (SOMF) approximation.121,122 In QDPT one starts from approximate solutions to the Born-Oppenheimer Hamiltonian obtained from ab initio methods such as CASSCF. A minimal active space consisting of six electrons distributed into five 3d iron based orbitals, i.e. CASSCF(6,5), was used. The matrix elements of the SOC operator were calculated in the basis of all the spin-multiplets obtained from 5 quintet, 18 triplet and 13 singlet state average CASSCF roots. Diagonalization of the SOC matrix yields the energy levels and the eigenvectors from which the entire D tensor was then extracted by employing the effective Hamiltonian approach.90 The SSC contributions were estimated using the Breit–Pauli spin–spin Hamiltonian in conjunction with first-order perturbation theory.123
In addition, the influence of dynamic correlation on the calculated ZFS values was verified with second-order N-electron valence perturbation theory (NEVPT2) calculations124,125 on top of the state-averaged CASSCF reference wave functions. All calculations used the def2-TZVP(-f) basis set, and were performed either in gas phase, in the presence of MM point charges or with an implicit COSMO model with a dielectric constant of 4 (see main text for details).
Supplementary Material
Synopsis.
Iron(II) binds to apo-azurin and to Met121Ala apo-azurin to give high-spin, tetrahedral iron complexes, which bind small molecules at the iron(II) site of the mutant metalloprotein.
Acknowledgements
This work was supported by the National Institutes of Health (GM-065313 to P.L.H. and GM-008267 to B.R.C.), the Fulbright Foundation (P.L.H.), the Alexander von Humboldt Foundation (H.S.S.), the Max-Planck-Gesellschaft (F.N.), and the National Science Foundation (CHE-0749997 to B.R.C.). We thank Robert Gelein for atomic absorption analysis, Scott Kennedy and Sally Rocks for assistance with 1H NMR spectroscopy, and Thomas Darrah and Robert Poreda for ICP/MS analysis. We thank Kara Bren and her students (especially Ravinder Kaur) and Yi Lu and his students (especially Nicholas Marshall and Nathan Sieracki) for assistance with protein expression and purification. We thank Wolfgang Lubitz for the use of the FTIR spectrometer. We thank John Richards and Yi Lu for providing plasmids.
Footnotes
Supporting Information Available: NMR spectra and crystallographic details. This material is available free of charge via the Internet at http://pubs.acs.org.
References
- 1.Lu Y. Angew. Chem., Int Ed. 2006;45:5588. doi: 10.1002/anie.200600168. [DOI] [PubMed] [Google Scholar]
- 2.Pordea A, Ward TR. Chem. Commun. 2008:4239. doi: 10.1039/b806652c. [DOI] [PubMed] [Google Scholar]
- 3.Lu Y, Berry SM, Pfister TD. Chem. Rev. 2001;101:3047. doi: 10.1021/cr0000574. [DOI] [PubMed] [Google Scholar]
- 4.Steinreiber J, Ward TR. Coord. Chem. Rev. 2008;252:751. [Google Scholar]
- 5.Ueno T, Abe S, Yokoi N, Watanabe Y. Coord. Chem. Rev. 2007;251:2717. [Google Scholar]
- 6.Ward TR. Acc. Chem. Res. 2010;44:47. doi: 10.1021/ar100099u. [DOI] [PubMed] [Google Scholar]
- 7.Brustad EM, Arnold FH. Curr. Opin. Chem. Biol. 2011;15:201. doi: 10.1016/j.cbpa.2010.11.020. [DOI] [PMC free article] [PubMed] [Google Scholar]
- 8.Reetz MT. Angew. Chem. Int. Ed. 2011;50:138. doi: 10.1002/anie.201000826. [DOI] [PubMed] [Google Scholar]
- 9.Lu Y, Garner DK, Zhang J-L. Encyclopedia of Chemical Biology. Vol. 1. Wiley; New York: 2009. Artificial metalloproteins: design and engineering; p. 124. [Google Scholar]
- 10.Tracewell CA, Arnold FH. Curr. Opin. Chem. Biol. 2009;13:3. doi: 10.1016/j.cbpa.2009.01.017. [DOI] [PMC free article] [PubMed] [Google Scholar]
- 11.Bell CB, Calhoun JR, Bobyr E, Wei P-P, Hedman B, Hodgson KO, DeGrado WF, Solomon EI. Biochemistry. 2008;48:59. doi: 10.1021/bi8016087. [DOI] [PMC free article] [PubMed] [Google Scholar]
- 12.Benson DE, Wisz MS, Hellinga HW. Proc. Natl. Acad. Sci. 2000;97:6292. doi: 10.1073/pnas.97.12.6292. [DOI] [PMC free article] [PubMed] [Google Scholar]
- 13.Benson DE, Wisz MS, Liu W, Hellinga HW. Biochemistry. 1998;37:7070. doi: 10.1021/bi980583d. [DOI] [PubMed] [Google Scholar]
- 14.Lin Y-W, Yeung N, Gao Y-G, Miner KD, Lei L, Robinson H, Lu Y. J. Am. Chem. Soc. 2010;132:9970. doi: 10.1021/ja103516n. [DOI] [PMC free article] [PubMed] [Google Scholar]
- 15.Lin Y-W, Yeung N, Gao Y-G, Miner KD, Tian S, Robinson H, Lu Y. Proc. Natl. Acad. Sci. 2010;107:8581. doi: 10.1073/pnas.1000526107. [DOI] [PMC free article] [PubMed] [Google Scholar]
- 16.Yeung N, Lin Y-W, Gao Y-G, Zhao X, Russell BS, Lei L, Miner KD, Robinson H, Lu Y. Nature. 2009;462:1079. doi: 10.1038/nature08620. [DOI] [PMC free article] [PubMed] [Google Scholar]
- 17.Wallar BJ, Lipscomb JD. Chem. Rev. 1996;96:2625. doi: 10.1021/cr9500489. [DOI] [PubMed] [Google Scholar]
- 18.Hegg EL, Que L. Eur. J. Biochem. 1997;250:625. doi: 10.1111/j.1432-1033.1997.t01-1-00625.x. [DOI] [PubMed] [Google Scholar]
- 19.Burgess BK, Lowe DJ. Chem. Rev. 1996;96:2983. doi: 10.1021/cr950055x. [DOI] [PubMed] [Google Scholar]
- 20.Holland PL. Nitrogen Fixation. In: McCleverty J, Meyer TJ, editors. Comprehensive Coordination Chemistry II. Vol. 8. Elsevier; Oxford: 2004. p. 569. [Google Scholar]
- 21.Kolczak U, Dennison C, Messerschmidt A, Canters GW. Azurin and Azurin Mutants. Handbook of Metalloproteins. 2001;2:1170. [Google Scholar]
- 22.Lu Y. Cupredoxins. In: McCleverty J, Meyer TJ, editors. Comprehensive Coordination Chemistry 2. Vol. 8. Elsevier; Oxford: 2004. [Google Scholar]
- 23.Gray HB, Malmström BG, Williams RJP. J. Biol. Inorg. Chem. 2000;5:551. doi: 10.1007/s007750000146. [DOI] [PubMed] [Google Scholar]
- 24.Crane BR, Di Bilio AJ, Winkler JR, Gray HB. J. Am. Chem. Soc. 2001;123:11623. doi: 10.1021/ja0115870. [DOI] [PubMed] [Google Scholar]
- 25.Nar H, Messerschmidt A, Huber R, Van de Kamp M, Canters GW. J. Mol. Biol. 1991;221:765. doi: 10.1016/0022-2836(91)80173-r. [DOI] [PubMed] [Google Scholar]
- 26.Nar H, Messerschmidt A, Huber R, Van de Kamp M, Canters GW. FEBS Lett. 1992;306:119. doi: 10.1016/0014-5793(92)80981-l. [DOI] [PubMed] [Google Scholar]
- 27.Nar H, Huber R, Messerschmidt A, Filippou AC, Barth M, Jaquinod M, Van de Kamp M, Canters GW. Eur. J. Biochem. 1992;205:1123. doi: 10.1111/j.1432-1033.1992.tb16881.x. [DOI] [PubMed] [Google Scholar]
- 28.Moratal JM, Romero A, Salgado J, Perales-Alarcon A, Jimenez HR. Eur. J. Biochem. 1995;228:653. doi: 10.1111/j.1432-1033.1995.tb20305.x. [DOI] [PubMed] [Google Scholar]
- 29.Bonander N, Vanngard T, Tsai L-C, Langer V, Nar H, Sjoelin L. Proteins. 1997;27:385. doi: 10.1002/(sici)1097-0134(199703)27:3<385::aid-prot6>3.0.co;2-c. [DOI] [PubMed] [Google Scholar]
- 30.Blaszak JA, Ulrich EL, Markley JL, McMillin DR. Biochemistry. 1982;21:6253. doi: 10.1021/bi00267a033. [DOI] [PubMed] [Google Scholar]
- 31.Engeseth HR, McMillin DR, Otvos JD. J. Biol. Chem. 1984;259:4822. [PubMed] [Google Scholar]
- 32.Jimnez HR, Salgado J, Moratal JM, Morgenstern-Badarau I. Inorg. Chem. 1996;35:2737. [Google Scholar]
- 33.Klemens AS, McMillin DR, Tsang HT, Penner-Hahn JE. J. Am. Chem. Soc. 1989;111:6398. [Google Scholar]
- 34.McCleskey TM, Mizoguchi TJ, Richards JH, Gray HB. Inorg. Chem. 1996;35:3434. doi: 10.1021/ic951055i. [DOI] [PubMed] [Google Scholar]
- 35.McMillin DR, Rosenberg RC, Gray HB. Proc. Natl. Acad. Sci. 1974;71:4760. doi: 10.1073/pnas.71.12.4760. [DOI] [PMC free article] [PubMed] [Google Scholar]
- 36.Wittung-Stafshede P. Inorg. Chem. 2004;43:7926. doi: 10.1021/ic049398g. [DOI] [PubMed] [Google Scholar]
- 37.Tsai L-C, Bonander N, Harata K, Karlsson G, Vaenngaard T, Langer V, Sjoelin L. Acta Cryst. D. 1996;52:950. doi: 10.1107/S0907444996004982. [DOI] [PubMed] [Google Scholar]
- 38.Canters GW, Gilardi G. FEBS Lett. 1993;325:39. doi: 10.1016/0014-5793(93)81410-2. [DOI] [PubMed] [Google Scholar]
- 39.Vidakovic M, Germanas JP. Angew. Chem. Int. Ed. 1995;34:1622. [Google Scholar]
- 40.Mizoguchi TJ, Di Bilio AJ, Gray HB, Richards JH. J. Am. Chem. Soc. 1992;114:10076. [Google Scholar]
- 41.Garner DK, Vaughan MD, Hwang HJ, Savelieff MG, Berry SM, Honek JF, Lu Y. J. Am. Chem. Soc. 2006;128:15608. doi: 10.1021/ja062732i. [DOI] [PubMed] [Google Scholar]
- 42.Berry SM, Ralle M, Low DW, Blackburn NJ, Lu Y. J. Am. Chem. Soc. 2003;125:8760. doi: 10.1021/ja029699u. [DOI] [PubMed] [Google Scholar]
- 43.Hwang HJ, Berry SM, Nilges MJ, Lu Y. J. Am. Chem. Soc. 2005;127:7274. doi: 10.1021/ja0501114. [DOI] [PubMed] [Google Scholar]
- 44.Hwang HJ, Carey JR, Brower ET, Gengenbach AJ, Abramite JA, Lu Y. J. Am. Chem. Soc. 2005;127:15356. doi: 10.1021/ja054983h. [DOI] [PubMed] [Google Scholar]
- 45.Hay M, Richards JH, Lu Y. Proc. Natl. Acad. Sci. 1996;93:461. doi: 10.1073/pnas.93.1.461. [DOI] [PMC free article] [PubMed] [Google Scholar]
- 46.Germanas JP, Di Bilio AJ, Gray HB, Richards JH. Biochemistry. 1993;32:7698. doi: 10.1021/bi00081a014. [DOI] [PubMed] [Google Scholar]
- 47.Marshall NM, Garner DK, Wilson TD, Gao Y-G, Robinson H, Nilges MJ, Lu Y. Nature. 2009;462:113. doi: 10.1038/nature08551. [DOI] [PMC free article] [PubMed] [Google Scholar]
- 48.Lancaster KM, George SD, Yokoyama K, Richards JH, Gray HB. Nat. Chem. 2009;1:711. doi: 10.1038/nchem.412. [DOI] [PMC free article] [PubMed] [Google Scholar]
- 49.Lancaster KM, Sproules S, Palmer JH, Richards JH, Gray HB. J. Am. Chem. Soc. 2010;132:14590. doi: 10.1021/ja105731x. [DOI] [PMC free article] [PubMed] [Google Scholar]
- 50.Blaszak JA, McMillin DR, Thornton AT, Tennent DL. J. Biol. Chem. 1983;258:9886. [PubMed] [Google Scholar]
- 51.Haigler BE, Gibson DT. J. Bacteriol. 1990;172:457. doi: 10.1128/jb.172.1.457-464.1990. [DOI] [PMC free article] [PubMed] [Google Scholar]
- 52.Braunschweig J, Bosch J, Heister K, Kuebeck C, Meckenstock RU. J. Microbiol. Methods. 2012;89:41. doi: 10.1016/j.mimet.2012.01.021. [DOI] [PubMed] [Google Scholar]
- 53.Vincent KA, Tilley GJ, Quammie NC, Streeter I, Burgess BK, Cheesman MR, Armstrong FA. Chem. Commun. 2003:2590. doi: 10.1039/b308188e. [DOI] [PubMed] [Google Scholar]
- 54.Tennent DL, McMillin DR. J. Am. Chem. Soc. 1979;101:2307. [Google Scholar]
- 55.Matsunaga Y, Fujisawa K, Ibi N, Miyashita Y, Okamoto K-I. Inorg. Chem. 2004;44:325. doi: 10.1021/ic049814x. [DOI] [PubMed] [Google Scholar]
- 56.Chowdhury A, Peteanu LA, Holland PL, Tolman WB. J. Phys. Chem. B. 2002;106:3007. [Google Scholar]
- 57.Gorelsky SI, Basumallick L, Vura-Weis J, Sarangi R, Hodgson KO, Hedman B, Fujisawa K, Solomon EI. Inorg. Chem. 2005;44:4947. doi: 10.1021/ic050371m. [DOI] [PMC free article] [PubMed] [Google Scholar]
- 58.Czernuszewicz RS, Fraczkiewicz G, Zareba AA. Inorg. Chem. 2005;44:5745. doi: 10.1021/ic050553g. [DOI] [PubMed] [Google Scholar]
- 59.Ming L-J. Nuclear magnetic resonance of paramagnetic metal centers in proteins and synthetic complexes. In: Que L, editor. Physical Methods in Bioinorganic Chemistry. University Science Books; Sausalito, CA: 2000. p. 375. [Google Scholar]
- 60.Blaszak JA, Ulrich EL, Markley JL, McMillin DR. Biochemistry. 1982;21:6253. doi: 10.1021/bi00267a033. [DOI] [PubMed] [Google Scholar]
- 61.Donaire A, Salgado J, Moratal J-M. Biochemistry. 1998;37:8659. doi: 10.1021/bi971974f. [DOI] [PubMed] [Google Scholar]
- 62.Moratal J-M, Salgado J, Donaire A, Jimenez HR, Castells J. J. Chem. Soc., Chem. Commun. 1993:110. [Google Scholar]
- 63.Moratal JM, Salgado J, Donaire A, Jimenez HR, Castells J, Martinez-Ferrer MJ. Magn. Reson. Chem. 1993;31:S41. [Google Scholar]
- 64.Moratal JM, Salgado J, Donaire A, Jimenez HR, Castells J. Inorg. Chem. 1993;32:3587. [Google Scholar]
- 65.Salgado J, Jimenez HR, Donaire A, Moratal JM. Eur. J. Biochem. 1995;231:358. doi: 10.1111/j.1432-1033.1995.tb20708.x. [DOI] [PubMed] [Google Scholar]
- 66.Gütlich P, Bill E, Trautwein AX. Mössbauer Spectroscopy and Transition Metal Chemistry. Springer Verlag; Berlin: 2011. [Google Scholar]
- 67.Neese F, Petrenko T. Quantum Chemistry and Mössbauer Spectroscopy. In: Gütlich P, Bill E, Trautwein AX, editors. Mössbauer Spectroscopy and Transition Metal Chemistry. Springer; Berlin: 2011. p. 137. [Google Scholar]
- 68.Schulz CE, Debrunner PG. J. Phys. Coll. 1976;37:153. [Google Scholar]
- 69.Yoo SJ, Meyer J, Achim C, Peterson J, Hendrich MP, Münck E. J. Biol. Inorg. Chem. 2000;5:475. doi: 10.1007/s007750050008. [DOI] [PubMed] [Google Scholar]
- 70.Moura I, Huynh BH, Hausinger R, Gall JL, Xavier AV, Münck E. J. Biol. Inorg. Chem. 1980;255:2493. [PubMed] [Google Scholar]
- 71.Beinert H, Holm RH, Münck E. Science. 1997;277:653. doi: 10.1126/science.277.5326.653. [DOI] [PubMed] [Google Scholar]
- 72.Dunham WR, Bearden AJ, Salmeen IT, Plamer G, Sands RH, Orme-Johnson WJ, Beinert H. Biochim. Biophys. Acta. 1971;253:134. doi: 10.1016/0005-2728(71)90240-4. [DOI] [PubMed] [Google Scholar]
- 73.Fee JA, Findling KL, Yoshida T, Hille R, Tarr GE, Hearshen DO, Dunham WR, Day EP, Kent TA, Münck E. J. Biol. Chem. 1984;259:124. [PubMed] [Google Scholar]
- 74.Moura I, Tavares P, Moura JJ, Ravi N, Huynh BH, Liu MY, LeGall J. J. Biol. Chem. 1990;265:21596. [PubMed] [Google Scholar]
- 75.Milsmann C, Patra GK, Bill E, Weyhermüller T, George SD, Wieghardt K. Inorg. Chem. 2009;48:7430. doi: 10.1021/ic900936p. [DOI] [PubMed] [Google Scholar]
- 76.Andres H, Bominaar E, Smith JM, Eckert NA, Holland PL, Münck E. J. Am. Chem. Soc. 2002;124:3012. doi: 10.1021/ja012327l. [DOI] [PubMed] [Google Scholar]
- 77.Stoian SA, Vela J, Smith JM, Sadique AR, Holland PL, Münck E, Bominaar EL. J. Am. Chem. Soc. 2006;128:10181. doi: 10.1021/ja062051n. [DOI] [PubMed] [Google Scholar]
- 78.Ascenso C, Rusnak F, Cabrito I, Lima MJ, Naylor S, Moura I, Moura JJG. J. Biol. Inorg. Chem. 2000;5:720. doi: 10.1007/s007750000161. [DOI] [PubMed] [Google Scholar]
- 79.Jovanovic T, Ascenso C, Hazlett KRO, Sikkink R, Krebs C, Litwiller R, Benson LM, Moura I, Moura JJG, Radolf JD, Huynh BH, Naylor S, Rusnak F. J. Biol. Chem. 2000;275:28439. doi: 10.1074/jbc.M003314200. [DOI] [PubMed] [Google Scholar]
- 80.Brioukhanov A. Appl. Biochem. Microbiol. 2008;45:335. [Google Scholar]
- 81.Li J, Noll BC, Schulz CE, Scheidt WR. Angew. Chem., Int. Ed. 2009;48:5010. doi: 10.1002/anie.200901434. [DOI] [PMC free article] [PubMed] [Google Scholar]
- 82.Berrett RR, Fitzsimmons BW. J. Chem. Soc. A. 1967:525. [Google Scholar]
- 83.Brennan S, Cowan PL. Rev. Sci. Instrum. 1992;63:850. [Google Scholar]
- 84.Neese F. Curr. Opin. Chem. Biol. 2003;7:125. doi: 10.1016/s1367-5931(02)00006-6. [DOI] [PubMed] [Google Scholar]
- 85.Römelt M, Ye S, Neese F. Inorg. Chem. 2008;48:784. doi: 10.1021/ic801535v. [DOI] [PubMed] [Google Scholar]
- 86.Maganas D, Grigoropoulos A, Staniland SS, Chatziefthimiou SD, Harrison A, Robertson N, Kyritsis P, Neese F. Inorg. Chem. 2010;49:5079. doi: 10.1021/ic100163g. [DOI] [PubMed] [Google Scholar]
- 87.Maganas D, Sottini S, Kyritsis P, Groenen EJJ, Neese F. Inorg. Chem. 2011;50:8741. doi: 10.1021/ic200299y. [DOI] [PubMed] [Google Scholar]
- 88.Maganas D, Krzystek J, Ferentinos E, Whyte AM, Robertson N, Psycharis V, Terzis A, Neese F, Kyritsis P. Inorg. Chem. 2012;51:7218. doi: 10.1021/ic300453y. [DOI] [PubMed] [Google Scholar]
- 89.Ye S, Neese F. J. Chem. Theory Comput. 2012;8:2344. doi: 10.1021/ct300237f. [DOI] [PubMed] [Google Scholar]
- 90.Maurice R, Bastardis R, deGraaf C, Suaud N, Mallah T, Guihéry N. J. Chem. Theory Comput. 2009;5:2977. doi: 10.1021/ct900326e. [DOI] [PubMed] [Google Scholar]
- 91.Neese F, Solomon EI. Inorg. Chem. 1998;37:6568. doi: 10.1021/ic980948i. [DOI] [PubMed] [Google Scholar]
- 92.Zein S, Duboc C, Lubitz W, Neese F. Inorg. Chem. 2007;47:134. doi: 10.1021/ic701293n. [DOI] [PubMed] [Google Scholar]
- 93.Bühl M, Reimann C, Pantazis DA, Bredow T, Neese F. J. Chem. Theor. Comp. 2008;4:1449. doi: 10.1021/ct800172j. [DOI] [PubMed] [Google Scholar]
- 94.Duboc C, Ganyushin D, Sivalingam K, Collomb M-N, Neese F. J. Phys. Chem. A. 2010;114:10750. doi: 10.1021/jp107823s. [DOI] [PubMed] [Google Scholar]
- 95.Carmieli R, Larsen TM, Reed GH, Zein S, Neese F, Goldfarb D. J. Am. Chem. Soc. 2007;129:4240. doi: 10.1021/ja066124e. [DOI] [PMC free article] [PubMed] [Google Scholar]
- 96.Fraczkiewicz G, Bonander N, Czernuszewicz RS. J. Raman Spect. 1998;29:983. [Google Scholar]
- 97.This experiment shows that the disappearance of the 1H NMR signal is not because cyanide extracts iron from the protein; also note that [Fe(CN)6]4– was not observed in our system by Mössbauer or IR spectroscopy.
- 98.Lee Y, Peters JC. J. Am. Chem. Soc. 2011;133:4438. doi: 10.1021/ja109678y. [DOI] [PubMed] [Google Scholar]
- 99.Chiang KP, Barrett PM, Ding F, Smith JM, Kingsley S, Brennessel WW, Clark MM, Lachicotte RJ, Holland PL. Inorg. Chem. 2009;48:5106. doi: 10.1021/ic802440h. [DOI] [PMC free article] [PubMed] [Google Scholar]
- 100.Solomon EI, Szilagyi RK, DeBeer S, Basumallick L. Chem. Rev. 2004;104:419. doi: 10.1021/cr0206317. [DOI] [PubMed] [Google Scholar]
- 101.Chang TK, Iverson SA, Rodrigues CG, Kiser CN, Lew AY, Germanas JP, Richards JH. Proc. Natl. Acad. Sci. U.S.A. 1991;88:1325. doi: 10.1073/pnas.88.4.1325. [DOI] [PMC free article] [PubMed] [Google Scholar]
- 102.Otwinowski Z, Minor W. Methods Enzymol. 1997;276:307. doi: 10.1016/S0076-6879(97)76066-X. [DOI] [PubMed] [Google Scholar]
- 103.Adams PD, Afonine PV, Bunkóczi G, Chen VB, Davis IW, Echols N, Headd JJ, Hung L-W, Kapral GJ, Grosse-Kunstleve RW, McCoy AJ, Moriarty NW, Oeffner R, Read RJ, Richardson DC, Richardson JS, Terwilliger TC, Zwart PH. Acta Cryst. D. 2010;66:213. doi: 10.1107/S0907444909052925. [DOI] [PMC free article] [PubMed] [Google Scholar]
- 104.McRee D. J. Mol. Graph. 1992;10:44. [Google Scholar]
- 105.Emsley P, Lohkamp B, Scott WG, Cowtan K. Acta Cryst. D. 2010;66:486. doi: 10.1107/S0907444910007493. [DOI] [PMC free article] [PubMed] [Google Scholar]
- 106.Brünger AT, Adams PD, Clore GM, DeLano WL, Gros P, Grosse-Kunstleve RW, Jiang J-S, Kuszewski J, Nilges M, Pannu NS, Read RJ, Rice LM, Simonson T, Warren GL. Acta Cryst. D. 1998;54:905. doi: 10.1107/s0907444998003254. [DOI] [PubMed] [Google Scholar]
- 107.Becke AD. Phys. Rev. A. 1988;38:3098. doi: 10.1103/physreva.38.3098. [DOI] [PubMed] [Google Scholar]
- 108.Perdew JP. Phys. Rev. B. 1986;33:8822. doi: 10.1103/physrevb.33.8822. [DOI] [PubMed] [Google Scholar]
- 109.Weigend F, Ahlrichs R. Phys. Chem. Chem. Phys. 2005;7:3297. doi: 10.1039/b508541a. [DOI] [PubMed] [Google Scholar]
- 110.Pantazis DA, Chen X-Y, Landis CR, Neese F. J. Chem. Theor. Comp. 2008;4:908. doi: 10.1021/ct800047t. [DOI] [PubMed] [Google Scholar]
- 111.Weigend F. Phys. Chem. Chem. Phys. 2006;8:1057. doi: 10.1039/b515623h. [DOI] [PubMed] [Google Scholar]
- 112.Grimme S, Antony J, Ehrlich S, Krieg H. J. Chem. Phys. 2010;132:154104. doi: 10.1063/1.3382344. [DOI] [PubMed] [Google Scholar]
- 113.Klamt A, Schuurmann G. J. Chem. Soc., Perkin 2. 1993:799. [Google Scholar]
- 114.Neese F. WIREs Comput. Mol. Sci. 2012;2:73. [Google Scholar]
- 115.Field MJ. J. Chem. Theor. Comp. 2008;4:1151. doi: 10.1021/ct800092p. [DOI] [PubMed] [Google Scholar]
- 116.Olsson MHM, Søndergaard CR, Rostkowski M, Jensen JH. J. Chem. Theor. Comp. 2011;7:525. doi: 10.1021/ct100578z. [DOI] [PubMed] [Google Scholar]
- 117.Jorgensen WL, Chandrasekhar J, Madura JD, Impey RW, Klein ML. J. Chem. Phys. 1983;79:926. [Google Scholar]
- 118.Jorgensen WL, Maxwell DS, Tirado-Rives J. J. Am. Chem. Soc. 1996;118:11225. [Google Scholar]
- 119.Lee C, Yang W, Parr RG. Phys. Rev. B. 1988;37:785. doi: 10.1103/physrevb.37.785. [DOI] [PubMed] [Google Scholar]
- 120.Becke AD. J. Chem. Phys. 1993;98:5648. [Google Scholar]
- 121.Hess BA, Marian CM, Wahlgren U, Gropen O. Chem. Phys. Lett. 1996;251:365. [Google Scholar]
- 122.Neese F. J. Chem. Phys. 2005;122:034107. doi: 10.1063/1.1829047. [DOI] [PubMed] [Google Scholar]
- 123.Ganyushin D, Neese F. J. Chem. Phys. 2006;125:024103. doi: 10.1063/1.2213976. [DOI] [PubMed] [Google Scholar]
- 124.Angeli C, Cimiraglia R, Evangelisti S, Leininger T, Malrieu JP. J. Chem. Phys. 2001;114:10252. doi: 10.1063/1.2911699. [DOI] [PubMed] [Google Scholar]
- 125.Angeli C, Cimiraglia R, Malrieu J-P. J. Chem. Phys. 2002;117:9138. [Google Scholar]
Associated Data
This section collects any data citations, data availability statements, or supplementary materials included in this article.