

Abstract
Maternal nutritional status affects the future development of offspring. Both undernutrition and overnutrition in critical periods of life (gestation or lactation) may cause several hormonal changes in the pups and programme obesity in the adult offspring. We have shown that hyperleptinaemia during lactation results in central leptin resistance, higher adrenal catecholamine secretion, hyperthyroidism, and higher blood pressure and heart rate in the adult rats. Here, we evaluated the effect of a maternal isocaloric high-fat diet on breast milk composition and its impact on leptinaemia, energy metabolism, and adrenal and thyroid function of the offspring at weaning. We hypothesised that the altered source of fat in the maternal diet even under normal calorie intake would disturb the metabolism of the offspring. Female Wistar rats were fed a normal (9% fat; C group) or high-fat diet (29% fat as lard; HF group) for 8 weeks before mating and during pregnancy and lactation. HF mothers presented increased total body fat content after 8 weeks (+27%, P < 0.05) and a similar fat content at the end of lactation. In consequence, the breast milk from the HF group had higher concentration of protein (+18%, P < 0.05), cholesterol (+52%, P < 0.05) and triglycerides (+86%, P < 0.05). At weaning, HF offspring had increased body weight (+53%, P < 0.05) and adiposity (2 fold, P < 0.05), which was associated with lower β3-adrenoreceptor content in adipose tissue (−40%, P < 0.05). The offspring also presented hyperglycaemia (+30%, P < 0.05) and hyperleptinaemia (+62%, P < 0.05). In the leptin signalling pathway in the hypothalamus, we found lower p-STAT3/STAT3 (−40%, P < 0.05) and SOCS3 (−55%, P < 0.05) content in the arcuate nucleus, suggesting leptin resistance. HF offspring also had higher adrenal catecholamine content (+17%, P < 0.05), liver glycogen content (+50%, P < 0.05) and hyperactivity of the thyroid axis at weaning. Our results suggest that a high fat diet increases maternal body fat and this additional energy is transferred to the offspring during lactation, since at weaning the dams had normal fat and the pups were obese. The higher fat and protein concentrations in the breast milk seemed to induce early overnutrition in the HF offspring. In addition to storing energy as fat, the HF offspring had a larger reserve of glycogen and hyperglycaemia that may have resulted from increased gluconeogenesis. Hyperleptinaemia may stimulate both adrenal medullary and thyroid function, which may contribute to the development of cardiovascular diseases. These early changes induced by the maternal high-fat diet may contribute to development of metabolic syndrome.
Key points
Perinatal maternal high-fat diet changes milk composition, resulting in obesity and hyperglycaemia in male offspring at weaning.
Offspring obesity is associated with hyperleptinaemia and changes in the central leptin signalling pathway in the hypothalamic arcuate nucleus.
Maternal high-fat diet increased adrenal catecholamines in offspring but reduced liver and adipose tissue adrenoreceptors, thereby contributing to increased adiposity in these animals.
Early obesity and hyperleptinaemia in offspring may have a stimulatory effect on the hypothalamus–pituitary–thyroid axis as an adaptive response to the positive energy balance.
Both catecholamines and thyroid hormones may impact cardiovascular function, thereby contributing to the development of hypertension.
Introduction
Epidemiological and experimental evidence has shown that malnutrition in early life is associated with the development of chronic diseases at adulthood, such as type 2 diabetes and hypertension (Barker et al. 2002; Moura & Passos, 2005; Moura et al. 2008). During the gestation and lactation periods, offspring are extremely sensitive to nutritional, hormonal and environmental changes that may result in altered physiology of several tissues and systems throughout life (Simmons, 2005). This phenomenon is named ‘programming’, and its origins are related to epigenetic modifications – DNA methylation and histone acetylation – during critical periods of life (Burdge et al. 2007).
Obesity is the most frequent characteristic programmed in humans and experimental models (Spencer, 2012). Both maternal undernutrition and overnutrition during the perinatal period may programme obesity development in the offspring in rodent models (Teixeira et al. 2002; Rodrigues et al. 2009). Rats whose mothers were undernourished during gestation have low birth weight. However, they display catch-up growth and become obese at adulthood (Martin-Gronert & Ozanne, 2010). When dams are protein-restricted only during lactation, the offspring have the opposite phenotype (Fagundes et al. 2009). On the other hand, maternal obesity or high-fat diet consumption during the perinatal period also programmes obesity at adulthood (Samuelsson et al. 2008; Sullivan et al. 2011). These phenotypes may be associated with changes in leptin levels in early life that may disturb the development of important regulatory sites of energy metabolism, such as the hypothalamus (Bouret & Simerly, 2006).
Obesity is characterised by an imbalance between energy intake and expenditure that results in the enlargement of adipose tissue mass. Adipocyte hypertrophy is associated with many metabolic changes, mainly as a consequence of the altered secretion of several hormones and factors, such as increased leptin and serum free fatty acids (FFAs) and decreased adiponectin (Ahima & Lazar, 2008).
Leptin is secreted mainly by white adipocytes and binds to the long form of leptin receptor (OBRb) in the hypothalamus, reducing appetite and stimulating energy expenditure through the Janus tyrosine kinase 2 (JAK2)–signal transducer and activator of transcription 3 (STAT3) pathway. There are also leptin receptors in other tissues, such as mammary glands, placenta, pituitary gland, adrenals, thyroid and components of the cardiovascular system (Bjorbaek & Kahn, 2004), suggesting that this hormone may also regulate metabolism peripherally. Serum leptin level is positively correlated with adiposity. However, obese humans and animals usually do not respond to the anorexigenic effect of leptin because of the development of leptin resistance in the hypothalamus.
We have shown that hyperleptinaemia during the first 10 days of lactation promotes obesity, central leptin resistance and higher levels of catecholamines, thyroid hormones, and blood pressure at adulthood (Toste et al. 2006a,b; Trevenzoli et al. 2007). Currently, a large number of women of reproductive age are overweight or obese (Callaway et al. 2006; Kim et al. 2007). Here, we hypothesised that maternal consumption of a high-fat diet during the perinatal period and increased maternal adiposity would affect leptinaemia and energy metabolism in their offspring, increasing the risk for developing obesity and cardiovascular failure. Therefore, we aimed to elucidate the impact of maternal consumption of an isocaloric high-fat diet during critical periods of development, such as gestation and lactation, on breast milk composition and on the adiposity, glucose homeostasis, leptinaemia and central leptin sensitivity of the offspring at weaning to determine if any of these parameters were associated with altered adrenal or thyroid function.
Methods
Animals and diets
The use of animals in our experimental design was approved by the Animal Care and Use Committee of the Carlos Chagas Filho Biophysics Institute (process IBCCF 114). The handling of the experimental animals followed the principles adopted in the UK and Brazil according the Brazilian Law no. 11.794/2008 (Drummond, 2009; Marques et al. 2009).
Female Wistar rats were kept in an environmentally controlled room (23 ± 2°C and a 12 h light–dark cycle with lights on from 07.00 h to 19.00 h). Nulliparous 60-day-old female rats were divided into two groups: the control group (C), which received a standard diet for rodents (9% of the calories as fat), and a high-fat group (HF), which received a high-fat diet (28% of the calories as fat). In the high-fat diet, lard was used as fat source (mainly saturated fat) and we also added 1% soy oil to provide the minimal amount of n3 fatty acid (mainly unsaturated fat) for adequate development of rats. The macronutrient composition of the control and high-fat diets is shown in Table 1. Both diets contained approximately 3.9 kcal g−1 and followed the AIN-93 recommendations for micronutrients (Reeves et al. 1993). The female rats were fed these diets beginning 8 weeks before mating and throughout gestation and lactation. After the first 8 weeks on the diets, the body composition of the dams was evaluated by dual energy X-ray absorptiometry (DEXA) to confirm the effect of the HF diet in increasing body fat content. Next, the dams were mated in a 3 to 1 ratio. After mating, pregnant rats were housed in individual standard rat cages with free access to water and food until the pups’ birth. The dams were weighed weekly.
Table 1.
Composition of the control and high-fat diets
| Macronutrients | kcal | %kcal | |
|---|---|---|---|
| Control diet (amount per kg) | |||
| Protein | 220 g | 880 | 22.6 |
| Lipids | 40 g | 360 | 9.4 |
| Carbohydrates | 660 g | 2,640 | 68 |
| Total | 1000 g | 3,880 | 100 |
| High-fat diet (amount per kg) | |||
| Protein | 169.6 g | 678.4 | 17.3 |
| Lipids | 214.9 g | 1124 | 28.6 |
| Carbohydrates | 530.3 g | 2121 | 54.1 |
| Total | 1092 g | 3923 | 100 |
At birth, all of the litters were weighed and adjusted to six males for each dam, a number that maximises lactation performance (Fishbeck & Rasmussen, 1987). Litters that did not have at least six male pups were discarded.
At weaning, the dams again underwent DEXA, which was followed by killing using a rodent guillotine. The glycaemia of the pups was measured, and then they were killed by cardiac puncture under anaesthesia (55 mg (kg BW)−1 ketamine and 100 mg (kg BW)−1 xylazine) for sample collection. Blood samples were centrifuged (1000 g, 4°C, 20 min), and serum was kept individually at −20°C until hormone quantification assays. The left adrenal glands were dissected and kept in 10% acetic acid solution at −20°C for catecholamine quantification. The right adrenal glands were kept at −80°C to measure the catecholamine-synthesising enzymes tyrosine hydroxylase (TH) and phenylethanolamine-N-methyl transferase (PNMT). Liver samples were collected for glycogen quantification and analysis of β2-adrenoreceptor (β2AR) content by Western blotting. We dissected and weighed three representative depots of white adipose tissue (retroperitoneal, epididymal and inguinal) to analyse adiposity in the pups. Samples from the inguinal region were taken to analyse leptin, β2AR, and β3AR expression. The brain was collected for dissection of the arcuate nucleus of the hypothalamus, which was used to quantify leptin signalling proteins. The hearts of the offspring were also weighed.
For each experimental procedure, animals from at least six different litters per group were used to avoid litter effects.
Biochemical and hormonal milk analysis
Lactose, protein, cholesterol, triglycerides and leptin were measured in milk samples from the C and HF dams in the middle (day 11) and at the end (day 21) of lactation (Troina et al. 2010). Lactating rats were separated from their pups for 2 h and then injected subcutaneously with 5 IU ml−1 of oxytocin (Eurofarm, São Paulo, SP, Brazil). After 20 min, the dams were lightly anaesthetised (55 mg (kg BW)−1 ketamine and 100 mg (kg BW)−1 xylazine), and milk was extracted by gently squeezing the thoracic and abdominal teats. Lactose content was estimated by a colorimetric method using commercial lactose (Sigma, St Louis, MO, USA) as a standard. Protein content was measured by the colorimetric Peterson method using bovine serum albumin (Sigma) as a standard. Total cholesterol and triglycerides were measured by an enzymatic and colorimetric method using a commercial kit (Bioclin, Belo Horizonte, MG, Brazil). The leptin concentration of the milk was evaluated using a rat leptin-specific radioimmunoassay (RIA) kit with a sensitivity of 0.5 ng ml−1 (Linco Research, Inc., St Charles, MO, USA). For these analyses, we used six mothers per group for each time point.
Hormones and free fatty acid (FFA) measurements
Total serum adiponectin was measured by ELISA (Millipore, Billerica, MA, USA) with an assay sensitivity of 0.155 ng ml−1. Serum leptin, insulin, corticosterone, total T3 (TT3) and free T4 (FT4) were measured using specific commercial RIA kits with the following assay sensitivities: leptin: 0.5 ng ml−1 (Linco Research, Inc.); insulin: 0.1 ng ml−1 (ICN Pharmaceuticals Inc., Orangeburg, NY, USA); corticosterone: 50 ng ml−1 (Zen-bio Inc., Research Triangle Park, NC, USA); and TT3 and FT4: 6.7 ng dl−1 and 0.045 ng dl−1, respectively (Coat-A-Coat, DPC, Los Angeles, CA, USA). Serum TSH was measured by specific rat RIA employing reagents supplied by the National Hormone and Peptide Program (Torrance, CA, USA) as previously described (Ortiga-Carvalho et al. 2002). The intra-assay coefficients of variance of the assays for all hormones were in the range of 4–7%. Serum FFA was measured using a colorimetric commercial kit (Zen-bio Inc.). For each parameter that was evaluated, all of the measurements were performed in a single assay. For these assays, we used nine C-offspring pups and ten HF-offspring pups.
Real-time PCR
Leptin gene expression was quantified as previously described (Nobre et al. 2011). Total RNA was isolated from inguinal adipose tissue using a commercial kit (RNeasy lipid tissue mini kit, Qiagen, Hilden Germany). For quantitative real-time RT-PCR analysis, reverse transcription was carried out on 1 μg of total RNA for all tissues using a SuperScript III kit. The products were amplified in an Applied Biosystems 7500 real-time PCR System (Life Technologies Co., Frederick, MD, USA) using SYBR Green PCR Master Mix (Applied BioSystems, Foster City, CA, USA). Briefly, after initial denaturation at 50°C for 2 min and 95°C for 10 min, the reactions were cycled 40 times using the following parameters for the ob gene: 95°C for 15 s, 53°C for 30 s and 70°C for 45 s. Product purity was confirmed by agarose gel analysis. Relative mRNA levels (2ΔCt) were determined by comparing the PCR cycle threshold (Ct) between groups, after normalising to the housekeeping gene 36β4. The data are expressed as fold induction over the control group, which was set to 100%. The sequences of the forward and reverse primers were 5′-CATCTGCTGGCCTTCTCCAA-3′ and 5′-ATCCAGGCTCTCTGGCTTCTG-3′ for the leptin gene, and 5′-TGTTTGACAACGGCAGCATTT-3′ and 5′-CCGAGGCAACAGTTGGGTA-3′ for 36β4. For these measurements, we used nine C-offspring pups and 10 HF-offspring pups.
Microdissection of paraventricular (PVN) and arcuate (Arc) hypothalamic nuclei
PVN and Arc tissues were obtained by the punch technique from thick coronal brain sections cut in a cryostat using the bregma as reference (Palkovits, 1973; Paxinos & Watson, 2007; Helena et al. 2009). Briefly, two subsequent sections of 1000 μm were made: from −0.6 mm to −1.6 mm for PVN microdissection, and from −1.6 mm to −2.6 mm for microdissection of the Arc. The PVN was dissected from the first section in one punch, obtained with a 1.5 mm-diameter round needle with the top centred in the third ventricle. The Arc was dissected from the second section using a 2 mm ‘square puncher’ needle, centred on the third ventricle, approximately 1 mm dorsal to the base of the brain. Immediately afterwards, the tissue samples were kept at −80°C until Western blotting assays.
Western blotting
We used the western blotting assay to detect specific proteins in various tissues: Arc, PVN, adipose tissue, liver and adrenal. Samples of each tissue were homogenised in a specific way, following previous protocols with minor modifications (Trevenzoli et al. 2010a).
To analyse the leptin signalling pathway and TRH in hypothalamic punch samples, we used two nuclei pools to obtain each sample and achieve an adequate protein concentration in the tissue extracts. The samples were homogenised in 100 μl of ice-cold lysis buffer (50 mm Hepes, 1 mm MgCl2, 10 mm EDTA, 1% Triton X-100 pH 6.4) containing protease inhibitors (Complete, Roche Diagnostics), using an automatic ultrasonic processor (2 × 10 s pulse on and 20 s pulse off). The total protein concentration of the homogenates was determined using the BCA Protein Assay Kit (Thermo Scientific, Rockford, IL, USA).
To analyse the catecholamine-synthesising pathway, each right adrenal was homogenised manually in 500 μl of lysis buffer. The homogenates were centrifuged (1120 g, 4°C, 5 min), and the supernatants were collected for total protein quantification.
The liver samples (25 mg) were homogenised in 300 μl of lysis buffer and centrifuged (1000 g, 4°C, 10 min). Then, the homogenates were diluted 1:3 before protein quantification. For inguinal adipose tissue, we homogenised 40 mg of tissue in 300 μl of the pH 7.4 lysis buffer (20 mm Tris-HCl, 10 mm NaF, 1% NP40, 150 mm NaCl, 5 mm EDTA, 0.1% SDS) containing protease inhibitors. The homogenates also underwent an ultrasonic procedure (2 × 10 s pulse on and 20 s pulse off) followed by two subsequent centrifugations (9500 g, 4°C, 15 min). The total protein content of the supernatants was quantified using a BCA kit (Thermo Scientific). Both liver and adipose tissue were used for analysis of AR content.
All samples were denatured in the sample buffer (50 mm Tris-HCl, pH 6.8, 1% SDS, 5% 2-mercaptoethanol, 10% glycerol, 0.001% bromophenol blue) and heated at 95°C for 5 min.
Supernatants were analysed by SDS-PAGE, with a 10% or 12% polyacrylamide gel, and electroblotted onto PVDF membranes (Hybond P ECL membrane; Amersham Pharmacia Biotech, NJ, USA). The membranes were incubated with Tris-buffered saline–Tween 20 (T-TBS) containing 5% non-fat dry milk for 90 min to block non-specific binding sites. Then, the membranes were washed with T-TBS and incubated overnight with specific primary antibodies. For the arcuate nucleus, anti-OBR (1:1000), anti-JAK2 (1:500), anti-STAT3 (1:1000), anti-pSTAT3 (1:1000), anti-suppressor of cytokine signalling 3 (SOCS3; 1:250) (Santa Cruz Biotechnology, Santa Cruz, CA, USA) and anti-cyclophilin (1:3000) (Affinity BioReagents, IL, USA) were used. For the PVN, anti-Pro TRH (1:500) (LifeSpan BioSciences, Seattle, WA, USA) and anti-cyclophilin (1:3000) were used. For adrenal gland, anti-TH (1:1000) and anti-PNMT (1:1000) (Sigma-Aldrich, St Louis, MO, USA) were used. For adipose tissue, anti-β2AR (1:1000) (Sigma-Aldrich) and anti-β3AR (1:1000) (Santa Cruz Biotechnology) were used. For liver, anti-β2AR (1:1000) (Sigma-Aldrich) was used. Next, the membranes were washed and incubated with the appropriate secondary antibodies, which were conjugated to biotin (Santa Cruz Biotechnology; diluted in 0.5% non-fat dry milk/TBS) or horseradish peroxidase (HRP; Amersham, UK), for 1–2 h at room temperature. The membranes that were incubated in biotin-antibodies were washed and incubated for 1 h at room temperature with streptavidin HRP-conjugates (Zymed, Camarillo CA, USA). Immunoreactive proteins were visualised using HRP substrate (ECL-plus; GE, Little Chalfont, Buckinghamshire, UK) and then exposed to X-ray film. Finally, the area and density of the protein bands were quantified using ImageJ 1.34s software (Wayne Rasband, National Institutes of Health, Bethesda, MD, USA). All proteins were normalised by the cyclophilin content in each sample, except those from adipose tissue, which were normalised by Ponceau staining (total protein).
For each protein analysed by Western blotting, we used six or seven samples per group, and each sample was obtained from a different animal. For analysis of proteins in the hypothalamus, we used two animals (2 hypothalamic nuclei) to obtain each sample, and five or six samples per group were used in the experiments.
Catecholamine quantification
Total catecholamine (adrenaline and noradrenaline) content was quantified using a trihydroxyindole method with some modifications (Trevenzoli et al. 2007). We used 50 μl of the supernatant from the homogenised glands to quantify the catecholamines. Adrenaline was used as standard. Briefly, 50 μl of the standard/supernatant/medium was mixed with 250 μl of 0.5 m phosphate buffer (pH 7.0) and 25 μl of 0.5% potassium ferricyanate; the mixing was followed by incubation (20 min; ice bath). The reaction was stopped with 500 μl of 60 mg ml−1 ascorbic acid/5 n NaOH (1:19 proportion). The parameters used in the fluorometer (Victor2, PerkinElmer, Turku, Finland) were 420 nm for excitation and 510 nm for emission. The results were obtained by plotting the values as a linear regression of the standard adrenaline curve. For this assay, we used nine adrenals from the C offspring and 10 adrenals from the HF offspring.
Liver glycogen content
Liver glycogen was measured using a protocol adapted from the Miller method (Trevenzoli et al. 2010b). Liver samples were homogenised with 10% trichloroacetic acid (100 mg of tissue/0.3 ml) and centrifuged (1000 g at 4°C for 10 min). To extract the glycogen, 200 μl of supernatant was mixed with 667 μl of absolute ethanol. The mixture was maintained at 4°C for 24 h for glycogen precipitation and then centrifuged (1000 g at 4°C for 10 min); the resulting supernatant was then discarded. The glycogen pellets were hydrolysed with 0.1 ml of 1 m HCl for 30 min at 100°C. Then, the mixtures were placed in an ice bath, and 0.1 ml of 1 m NaOH was added for neutralisation. The glucose produced by glycogen hydrolysis was measured using an enzymatic colorimetric method (Glucox commercial kit, Doles, Goiás, Brazil) and compared to a standard glucose curve. We used nine C-offspring pups and 10 HF-offspring pups for this analysis.
Statistical analysis
The data are expressed as the mean ± SEM. We used two-way ANOVA to analyse the body mass curve before mating. The other variables were analysed using Student's unpaired t test. Results were considered significant when P < 0.05.
Results
Wistar female rats fed with the high-fat diet did not show increased body mass after 8 weeks of treatment (before mating) compared to their controls (Fig. 1A). However, the DEXA analysis showed that they had higher total body fat content (+27%, P < 0.05; Fig. 1B). At weaning, the control and HF mothers had similar body masses and fat contents (Fig. 1C and D).
Figure 1. Maternal body weight and adiposity.
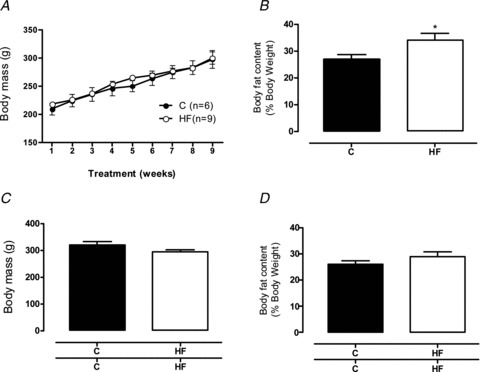
Body mass evolution and fat content/DEXA of control (filled bars; n= 6) and high-fat (open bars; n= 9) dams before gestation (A and B, respectively), and body mass and fat content at weaning (C and D, respectively). Results are expressed as means ± SEM; *P < 0.05.
Breast milk from the HF group contained more lactose (+20%, P < 0.05) and triglycerides (+35%, P < 0.05) and less cholesterol (−19%, P < 0.05) than the C group, without any changes in protein content, on the 11th day of lactation (Fig. 2). At weaning (21st day of life), the breast milk had higher concentrations of proteins (+18%, P < 0.05), cholesterol (+52%, P < 0.05) and triglycerides (+86%, P < 0.05). The leptin concentration in the milk was similar between the two groups (Fig. 2).
Figure 2. Breast milk composition.
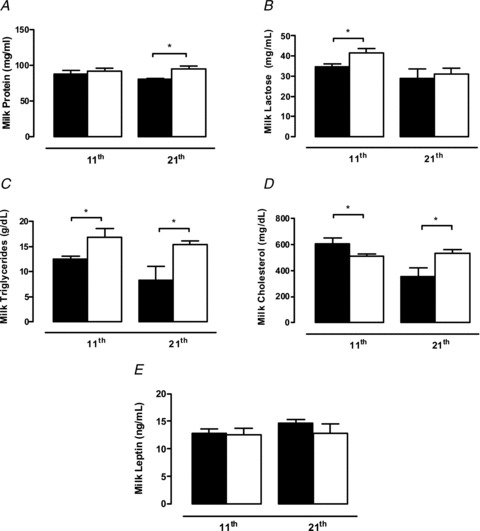
Milk content of protein (A), lactose (B), triglycerides (C), cholesterol (D) and leptin (E) of control (filled bars; n= 6) and high-fat (open bars; n= 6) dams at the 11th day of lactation (middle lactation) and at weaning. Results are expressed as means ± SEM; *P < 0.05.
The maternal HF diet did not impact the birth weight of the offspring (Fig. 3A). In contrast, at weaning, the HF male offspring were evidently obese, characterised by higher body mass (+53%, P < 0.05; Fig. 3B) and increased fat mass in different adipose tissue depots: retroperitoneal (2.3-fold, P < 0.05; Fig. 4A), epididymal (3.4-fold, P < 0.05; Fig. 4A) and inguinal (2-fold, P < 0.05; Fig. 4A). This increased adiposity was associated with higher leptin expression in the inguinal adipose tissue (2.5-fold, P < 0.05; Fig. 4B) and hyperleptinaemia (+62%, P < 0.05; Fig. 4C) in the HF offspring. In addition, the HF offspring presented higher heart weights (ConOff: 0.190 ± 0.0087 g, and HFOff: 0.256 ± 0.006 g, P < 0.05). When analysed as a relative proportion of body weight, the fat mass remained higher in the HF offspring (P < 0.05), but the heart weight was similar between the groups (data not shown).
Figure 3. Effect of maternal HF diet on the offspring body mass.
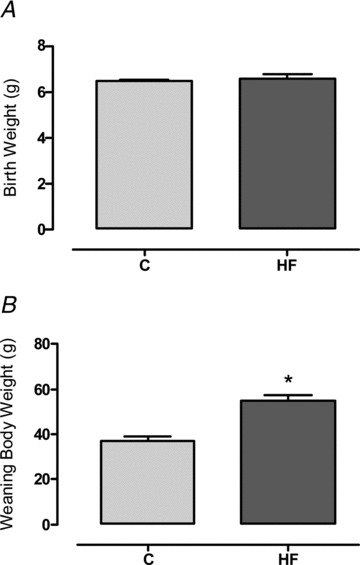
Birth weight (A) and body mass at weaning (B) of the control (C; n= 9) and high-fat (HF; n= 10) offspring. Results are expressed as means ± SEM; *P < 0.05.
Figure 4. Effect of maternal HF diet on the offspring adiposity and leptin production.
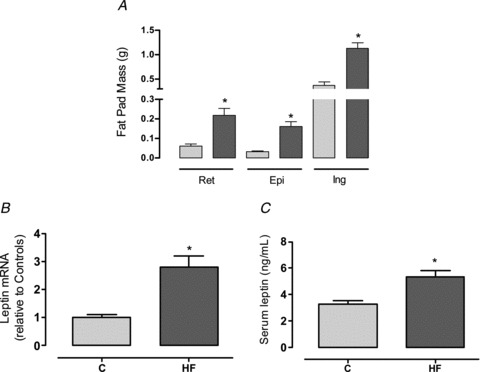
Fat mass of retroperitoneal, epididymal and inguinal compartments (A), leptin RNAm expression in inguinal fat pad (B) and leptinaemia (C) of the control (C; n= 9) and high-fat (HF; n= 10) offspring at weaning. Results are expressed as means ± SEM; *P < 0.05.
To verify whether hyperleptinaemia was associated with alterations of central leptin signalling, we evaluated key proteins of the leptin pathway in the hypothalamic arcuate nucleus. HF offspring had similar amounts of OBRb and JAK2 compared with the controls (Fig. 5). However, they had lower phosphorylated STAT3 (p-STAT3)/STAT3 (−40%, P < 0.05; Fig. 5C), which is the main target of the leptin pathway. This change was associated with reduced SOCS3 in the HF offspring (−56%, P < 0.05; Fig. 5D).
Figure 5. Effect of maternal HF diet on leptin signalling pathway in the arcuate nucleus of the offspring.
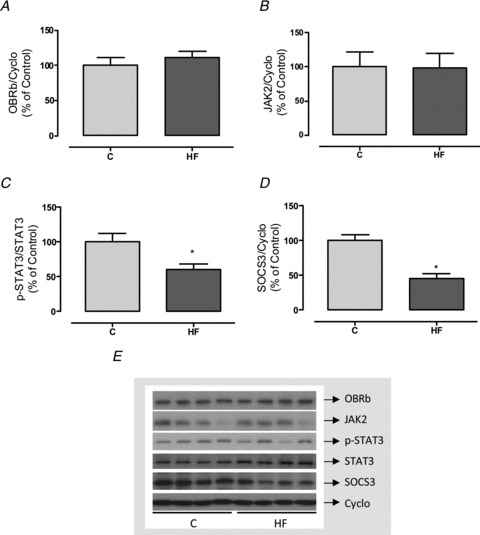
Content of OBRb (A), JAK2 (B), p-STAT3 (C) and SOCS3 (D) in samples of arcuate hypothalamic nuclei of control (C; n= 6) and high-fat (HF; n= 6) offspring at weaning. Representative blots of leptin pathway proteins and cyclophilin (control load) are shown (E). Results are expressed as means ± SEM; *P < 0.05.
The adrenal function evaluation showed that the HF offspring had higher adrenal catecholamine content (+20%, P < 0.05; Fig. 6A) without changes in TH or PNMT (Fig. 6C and D). Corticosteronaemia was similar between the groups (Fig. 6B).
Figure 6. Effect of maternal HF diet on adrenal function of the offspring.
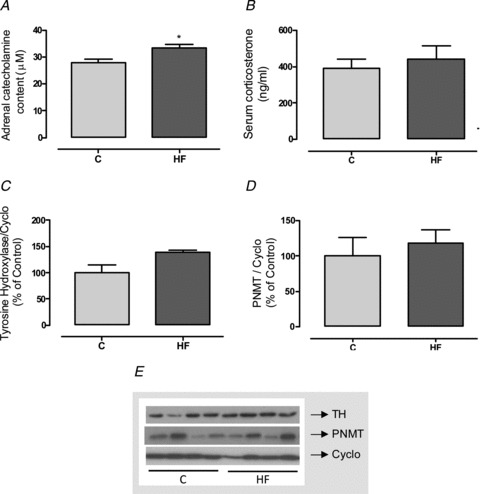
Adrenal content of catecholamines (A), serum corticosterone (B), adrenal content of tyrosine hydroxylase (TH; C) and phenylethanolamine n-methyl transferase (PNMT; D) of control (C; n= 7–9) and high-fat (HF; n= 7–10) offspring at weaning. Representative blots of catecholamine synthesising enzymes and cyclophilin (control load) are shown (E). Results are expressed as means ± SEM; *P < 0.05.
To evaluate the possible impact of the higher levels of catecholamines in HF offspring on other tissues, we evaluated the expression of different adrenoceptors (ARs). HF offspring had less β3AR (−40%, P < 0.05; Fig. 7B), without changes in β2AR (Fig. 7A), in the inguinal adipose tissue.
Figure 7. Effect of maternal HF diet on content of adrenoreceptors in adipose tissue of the offspring.
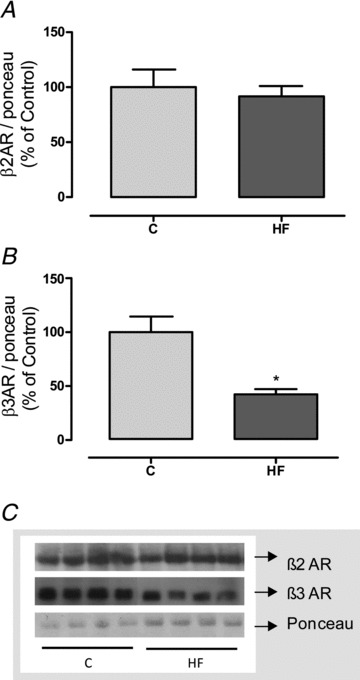
Content of β2 (A) and β3 (B) adrenoreceptors in the inguinal adipose tissue of control (C; n= 7) and high-fat (HF; n= 7) offspring at weaning. Representative blots of ARs and Ponceau staining (control load) are shown (C). Results are expressed as means ± SEM; *P < 0.05.
Despite the higher adiposity, which suggests insulin resistance, HF offspring presented hyperglycaemia (+30%, P < 0.05; Fig. 8A) and no alterations in serum insulin, adiponectin or FFA (Fig. 8B–D).
Figure 8. Effect of maternal HF diet on glucose homeostasis of the offspring.
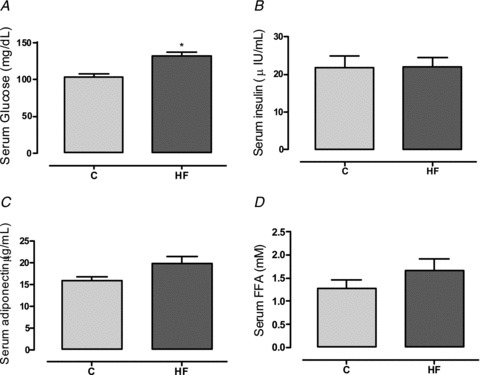
Glycaemia (A), insulinaemia (B), adiponectinaemia (C) and serum free fatty acids (D) of control (C; n= 9) and high-fat (HF; n= 10) offspring at weaning. Results are expressed as means ± SEM; *P < 0.05.
HF offspring also presented higher absolute liver weight (+46%, P < 0.05; Fig. 9A) and glycogen content (+50%, P < 0.05; Fig. 9B). This alteration was accompanied by reduced β2AR in the liver (−24%, P < 0.05; Fig. 9C). When analysed as a relative proportion of body weight, liver weight trended toward being higher in the HF offspring (P= 0.08; data not shown).
Figure 9. Effect of maternal HF diet on the liver content of glycogen and adrenoreceptor of the offspring.
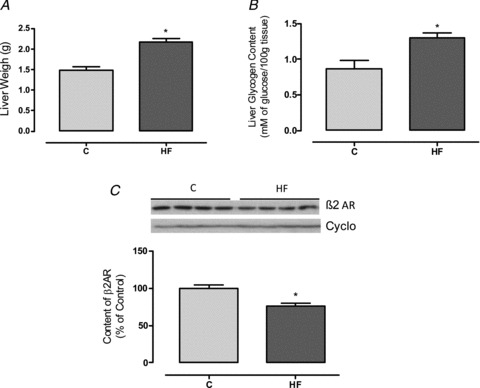
Liver weight (A), glycogen content (B) and content of β2 adrenoreceptor (C) in the liver of control (C; n= 7–9) and high-fat (HF; n= 7–10) offspring at weaning. Representative blots of β2AR and cyclophilin (control load) are shown (C). Results are expressed as means ± SEM; *P < 0.05.
Figure 10 shows parameters of the hypothalamus–pituitary–thyroid (HPT) axis. HF offspring had higher serum TT3 (+15%, P < 0.05) and FT4 (+40%, P < 0.05) without significant changes in TSH. This profile was accompanied by increased pro-TRH in the PVN (+28%, P < 0.05).
Figure 10. Effect of maternal HF diet on the thyroid function of the offspring.

Serum total T3 (A), free T4 (B), TSH (C) and pro-TRH content in the hypothalamic paraventricular nucleus (D) of control (C; n= 5–9) and high-fat (HF; n= 5–10) offspring at weaning. Representative blots of pro-TRH and cyclophilin (control load) are shown (D). Results are expressed as means ± SEM; *P < 0.05.
Discussion
Normal leptinaemia in the perinatal period is an important factor for adequate development of the central nervous system, especially the hypothalamus (Pinto et al. 2004; Bouret & Simerly, 2006), and also for the physiology of peripheral tissues, such as adrenal gland, liver, adipose tissue and thyroid, in rodents (Moura & Passos, 2005; Vickers et al. 2005). Both hyperleptinaemia (Toste et al. 2006b; Trevenzoli et al. 2010a,b) and blockage of leptin action (Attig et al. 2008) during lactation programme a cluster of metabolic dysfunctions throughout life, including obesity and leptin resistance.
Maternal nutritional status may impact leptinaemia and the metabolic parameters of the offspring with short- and long-term consequences. Undernutrition during lactation results in abolition of the leptin surge in the middle of lactation and increased leptinaemia at weaning (Teixeira et al. 2002). These changes are associated with central resistance to the anorexigenic effect of leptin (Passos et al. 2004). However, the normalisation of leptin level prevents the programming effects of undernutrition (Vickers et al. 2005). In the present study, we found that a maternal high-fat diet resulted in hyperleptinaemia in the offspring at weaning, which was associated with higher body weight and adiposity. These effects were independent of maternal obesity at weaning, at which point the HF mothers showed no change in body fat, suggesting a specific effect of saturated fat on offspring metabolism. The HF diet did markedly change the breast milk composition, and the high concentrations of proteins, lactose and triglycerides in the breast milk seemed to induce overnutrition in the offspring throughout lactation. Cunha et al. (2009) have shown that breast milk from dams with pups that are raised in small litters (a recognised programming model of neonatal overnutrition) also present high levels of triglycerides. A maternal HF diet increases the n3:n6 ratio and insulin level in breast milk from non-human primates without changing leptin content (Grant et al. 2011). Thus, our results suggest that the precocious obesity programmed by a maternal HF diet is a consequence of changes in the macronutrients in breast milk rather than changes in the leptin concentration of milk that might disturb the leptin surge in the middle of lactation. Although many researchers are investigating the disturbances to the progeny caused by maternal malnutrition, most of them have used a drastic diet in terms of fat content (e.g. 50–60% of calories from fat), whereas the diet used in the present study was isocaloric and moderately high-fat. Our data show that even consumption of a normocaloric diet during pregnancy and lactation may cause deleterious effects in the offspring if the quality of the diet is not appropriate.
As a consequence of early overnutrition, the HF offspring presented increased visceral and subcutaneous fat mass. Serum leptin level is positively correlated with body weight and the amount of adipose tissue (Friedman & Halaas, 1998), and the HF offspring presented hyperleptinaemia associated with higher expression of leptin in the inguinal adipose tissue. A similar phenotype was observed in rats raised in small litters during lactation (Rodrigues et al. 2009).
The anorexigenic effect of leptin is mediated by the JAK2–STAT3 pathway in the hypothalamus. When activated, p-STAT3 increases the synthesis of anorexigenic neuropeptides (α-melanocyte-stimulating hormone (α-MSH) and cocaine and amphetamine regulated transcript (CART)) and reduces the production of orexigenic factors (neuropeptide Y (NPY) and agouti-related peptide (AgRP)). In rodents, these neural pathways that regulate food intake and energy expenditure are not completely developed until the third postnatal week (Grove et al. 2005); however, in humans, they develop mainly prenatally (Djiane & Attig, 2008). In the present study, dams were fed experimental diets until the end of lactation, when the pups were 3 weeks old, specifically to include this critical period of brain development in rodents.
The JAK2–STAT3 pathway also stimulates the transcription of SOCS3, a negative regulator of leptin signalling (Bjorbaek et al. 1997, 1998). Hyperleptinaemia is frequently associated with central leptin resistance with important consequences, such as hyperphagia and decreased energy expenditure (Ahima & Lazar, 2008). In our experimental model, the analysis of the leptin pathway in the hypothalamic arcuate nucleus of the offspring showed that the maternal HF diet reduced STAT3 activation and SOCS3 content. These results indicate the beginning of leptin resistance, which may contribute to lower energy expenditure and the development of obesity. Because central feeding circuits are still undeveloped during lactation (Grove & Smith, 2003), we believe that leptin has a larger effect on energy metabolism than on regulating food intake in this period.
Leptin resistance is frequently selective in obese humans and animals. It is characterised by a lack of anorexigenic and metabolic leptin responses and overactivation of other systems influenced by this hormone, such as the sympathetic nervous system (SNS).
The sympathoadrenal system is an important component of physiological adaptation to challenging situations. Changes in maternal diet, leptin levels or nicotine exposure during lactation are stressful events, resulting in alterations in both the corticosterone and catecholamine levels of the offspring throughout life (Vieau et al. 2007; Fagundes et al. 2009; Trevenzoli et al. 2010a; Laborie et al. 2011; Pinheiro et al. 2011). In addition, these hormones make relevant contributions to energy metabolism and cardiovascular function because they affect glucose production and utilisation and fat storage and protein metabolism. Thus, the HPA and sympathoadrenal system seems to be profoundly involved with the developmental origins of obesity and cardiovascular disease.
Leptin increases the sympathetic tone to brown adipose tissue, kidneys, hind limbs and adrenal glands. Hypertension associated with obesity may have a great contribution of leptin action (Kalil & Haynes, 2012). We have shown that leptin treatment during the first 10 days of lactation increases catecholamine levels in the short and long term. These alterations are associated with higher blood pressure and heart rate at adulthood (Trevenzoli et al. 2007). In this study, we showed that a maternal high-fat diet also increased adrenal catecholamine content in the pups at weaning, which may contribute to future programming of the cardiovascular system. Samuelsson et al. (2010) also demonstrated that maternal obesity induces hypertension development that is associated with SNS overactivity in 30-day-old rats. Thus, we suggest that adrenal catecholamines may contribute to this phenotype.
The catecholamine synthesis pathway is regulated by TH and PNMT activities among other steps (Haycock & Wakade, 1992). We did not find differences in the content of these key enzymes between the groups that could have explained the higher adrenal catecholamine content in the HF offspring. However, the activities of TH and PNMT are regulated by serine phosphorylation, and leptin directly stimulates both TH expression and activity. This effect is mediated by PKC and MAPK (Takekoshi et al. 2001; Utsunomiya et al. 2001). The hyperleptinaemia found in the HF offspring and/or the increased sympathetic tone to the medulla may stimulate TH activity.
To investigate whether higher catecholamine production in the HF offspring was associated with tissue catecholamine effects, we measured ARs in tissues that are profoundly regulated by these hormones. We observed a lower content of β3AR in the adipose tissue from the HF offspring, without an alteration in β2AR. Lipolysis in white adipose tissue is stimulated by catecholamines through βARs and the PKA pathway that activates hormone-sensitive lipase (Langin, 2006). Thus, our data suggest that the reduced lipolysis in the HF offspring may have contributed to the development of early obesity. Mice whose mothers were obese and diabetic have lower ARβ2 and β3AR mRNA levels and higher peroxisome proliferator-activated receptor γ (PPARγ) mRNA levels in the inguinal fat tissue at adulthood, suggesting decreased lipolysis and increased lipogenesis (Samuelsson et al. 2010). It is possible that high levels of catecholamines induce differential downregulation of ARs. In addition, adipocytes are also able to produce catecholamines, which might have an important paracrine role on adiposity regulation and deserves further investigation (Vargovic et al. 2011; Kvetnansky et al. 2012).
Increased adiposity is strongly associated with insulin resistance in humans and rodents. In fact, we observed hyperglycaemia in our experimental model at weaning, suggesting glucose intolerance. However, serum insulin, adiponectin and FFAs were unchanged in these animals. We first tested the hypothesis that HF offspring would have increased glycogenolysis induced by catecholamines, by assessing the glycogen content and expression of β2-AR in the liver. HF offspring presented higher amounts of glycogen with lower content of β2-AR, suggesting reduced glycogenolysis. Thus, the hyperglycaemia found in the HF offspring seems not to be a consequence of increased glycogenolysis. On the other hand, a maternal high-fat diet has been associated with an increased gluconeogenic capacity of offspring at birth through epigenetic modifications, which could lead to excessive hepatic glucose production and altered insulin sensitivity throughout life (Strakovsky et al. 2011). In addition, a maternal high-fat diet or maternal obesity can trigger liver lipotoxicity in rodents (Oben et al. 2010) and non-human primates (McCurdy et al. 2009), which indicates liver insulin resistance and contributes to hepatic glucose production. This phenotype at adulthood (high glycogen content and liver steatosis) may be associated with high leptin levels in the neonatal period, as we have shown previously (Trevenzoli et al. 2010b). We also cannot discard the possibility of muscle insulin resistance decreasing glucose uptake and contributing to the hyperglycaemia.
Thyroid hormones classically have important roles in early development. Our group have shown that changes in thyroid function appear to be important for early adaptation in different experimental programming models (Toste et al. 2006a; Oliveira et al. 2009; Rodrigues et al. 2009). The HPT axis activity may be stimulated by leptin under physiological conditions (Legradi et al. 1997; Nowak et al. 2002; Ortiga-Carvalho et al. 2002). Thus, we suppose that in our experimental model, the higher levels of thyroid hormones in HF offspring occurred as a consequence of hyperleptinaemia induced by obesity. Hyperleptinaemia in obese humans (Pacifico et al. 2011) and rodents (Perello et al. 2010) is associated with high circulating thyroid hormones, suggesting that leptin still activates the HPT axis in these individuals even though they are resistant to the anorexigenic effect of leptin.
Despite having high levels of thyroid hormones, the HF offspring were markedly obese, which seems counterintuitive because thyroid hormones increase the metabolic rate and energy expenditure (Yen, 2001). However, in obese animals, these effects may be counterbalanced by an increase in food intake induced by T3 (Kong et al. 2004) and possibly by an impairment of the metabolic actions of thyroid hormones, among other characteristics of obesity. Interestingly, a feature of the HF offspring was the small but significant central activation of thyroid function, as suggested by the higher pro-TRH content in the PVN, which may have caused the higher levels of T3 and T4. These data are consistent with the results demonstrated by Perello et al. (2010) in DIO rats; they found a dissociation between leptin sensitivity in the arcuate and PVN hypothalamic nuclei, with a lack of anorexigenic response but preserved stimulation of TRH induced by leptin. Thus, our data suggest that the hyperleptinaemia observed in the HF offspring may have contributed to their higher thyroid hormone levels. The normal serum TSH level suggests a lower sensitivity of the pituitary to negative feedback from thyroid hormone; the HF offspring may also have had a new set point for regulation of the HPT axis.
In the present study, we demonstrate for the first time that a perinatal maternal high-fat diet, through changes in milk composition, has short-term consequences, such as increased adrenal medullary and thyroid function, higher adiposity, hyperleptinaemia, and hyperglycaemia in the offspring. These changes occur even with a normal maternal caloric intake and may contribute, as priming factors, to the development of metabolic and cardiovascular diseases.
Acknowledgments
Research was supported by Conselho Nacional de Desenvolvimento Científico e Tecnológico (CNPq), Coordenação de Aperfeiçoamento de Pessoal de Nível Superior (CAPES) and Fundação de Amparo à Pesquisa do Rio de Janeiro (FAPERJ). T.P.F. was recipient of a FAPERJ fellowship; C.C. was recipient of a CAPES fellowship and J.G.F. was recipient of a CNP fellowship.
Glossary
- AR
adrenoreceptor
- BW
body weight
- CART
Cocaine - and amphetamine - regulated transcript
- DEXA
dual energy X-ray absorptiometry
- FFA
free fatty acid
- FT4
free T4
- JAK2
Janus tyrosine kinase 2
- OBRb
long form of leptin receptor
- PNMT
phenylethanolamine-N-methyl transferase
- p-STAT3
phosphorylated signal transducer and activator of transcription 3
- PVN
paraventricular hypothalamic nucleus
- SOCS3
suppressor of cytokine signalling 3
- STAT3
signal transducer and activator of transcription 3
- TH
tyrosine hydroxylase
- TT3
total T3
Author contributions
Experiments were performed mainly in the Laboratory of Molecular Endocrinology of the Federal University of Rio de Janeiro and some procedures made in the Laboratory of Endocrine Physiology of the State University of Rio de Janeiro. J.G.F., T.P.F., C.P.D.R., C.M.C., and I.H.T. participated in collection, analysis and interpretation of data. J.G.F., C.C.P.-M., P.C.L., E.G.M., and I.H.T. performed drafting and critical revising of the manuscript. All authors have approved the final version of the manuscript.
References
- Ahima RS, Lazar MA. Adipokines and the peripheral and neural control of energy balance. Mol Endocrinol. 2008;22:1023–1031. doi: 10.1210/me.2007-0529. [DOI] [PMC free article] [PubMed] [Google Scholar]
- Attig L, Solomon G, Ferezou J, Abdennebi-Najar L, Taouis M, Gertler A, Djiane J. Early postnatal leptin blockage leads to a long-term leptin resistance and susceptibility to diet-induced obesity in rats. Int J Obes (Lond) 2008;32:1153–1160. doi: 10.1038/ijo.2008.39. [DOI] [PubMed] [Google Scholar]
- Barker DJ, Eriksson JG, Forsen T, Osmond C. Fetal origins of adult disease: strength of effects and biological basis. Int J Epidemiol. 2002;31:1235–1239. doi: 10.1093/ije/31.6.1235. [DOI] [PubMed] [Google Scholar]
- Bjorbaek C, Elmquist JK, Frantz JD, Shoelson SE, Flier JS. Identification of SOCS-3 as a potential mediator of central leptin resistance. Mol Cell. 1998;1:619–625. doi: 10.1016/s1097-2765(00)80062-3. [DOI] [PubMed] [Google Scholar]
- Bjorbaek C, Kahn BB. Leptin signaling in the central nervous system and the periphery. Recent Prog Horm Res. 2004;59:305–331. doi: 10.1210/rp.59.1.305. [DOI] [PubMed] [Google Scholar]
- Bjorbaek C, Uotani S, da Silva B, Flier JS. Divergent signaling capacities of the long and short isoforms of the leptin receptor. J Biol Chem. 1997;272:32686–32695. doi: 10.1074/jbc.272.51.32686. [DOI] [PubMed] [Google Scholar]
- Burdge GC, Hanson MA, Slater-Jefferies JL, Lillycrop KA. Epigenetic regulation of transcription: a mechanism for inducing variations in phenotype (fetal programming) by differences in nutrition during early life. Br J Nutr. 2007;97:1036–1046. doi: 10.1017/S0007114507682920. [DOI] [PMC free article] [PubMed] [Google Scholar]
- Bouret SG, Simerly RB. Developmental programming of hypothalamic feeding circuits. Clin Genet. 2006;70:295–301. doi: 10.1111/j.1399-0004.2006.00684.x. [DOI] [PubMed] [Google Scholar]
- Callaway LK, Prins JB, Chang AM, McIntyre HD. The prevalence and impact of overweight and obesity in an Australian obstetric population. Med J Aust. 2006;184:56–59. doi: 10.5694/j.1326-5377.2006.tb00115.x. [DOI] [PubMed] [Google Scholar]
- Cunha AC, Pereira RO, Pereira MJ, Soares VdeM, Martins MR, Teixeira MT, Souza EP, Moura AS. Long-term effects of overfeeding during lactation on insulin secretion – the role of GLUT-2. J Nutr Biochem. 2009;20:435–442. doi: 10.1016/j.jnutbio.2008.05.002. [DOI] [PubMed] [Google Scholar]
- Djiane J, Attig L. Role of leptin during perinatal metabolic programming and obesity. J Physiol Pharmacol. 2008;59:55–63. [PubMed] [Google Scholar]
- Drummond GB. Reporting ethical matters in The Journal of Physiology: standards and advice. J Physiol. 2009;587:713–719. doi: 10.1113/jphysiol.2008.167387. [DOI] [PMC free article] [PubMed] [Google Scholar]
- Fagundes AT, Moura EG, Passos MC, Santos-Silva AP, de Oliveira E, Trevenzoli IH, Casimiro-Lopes G, Nogueira-Neto JF, Lisboa PC. Temporal evaluation of body composition, glucose homeostasis and lipid profile of male rats programmed by maternal protein restriction during lactation. Horm Metab Res. 2009;41:866–873. doi: 10.1055/s-0029-1233457. [DOI] [PubMed] [Google Scholar]
- Fischbeck KL, Rasmussen KM. Effect of repeated reproductive cycles on maternal nutritional status, lactational performance and litter growth in ad libitum-fed and chronically food-restricted rats. J Nutr. 1987;117:1967–1975. doi: 10.1093/jn/117.11.1967. [DOI] [PubMed] [Google Scholar]
- Friedman JM, Halaas JL. Leptin and the regulation of body weight in mammals. Nature. 1998;395:763–770. doi: 10.1038/27376. [DOI] [PubMed] [Google Scholar]
- Grant WF, Gillingham MB, Batra AK, Fewkes NM, Comstock SM, Takahashi D, Braun TP, Grove KL, Friedman JE, Marks DL. Maternal high fat diet is associated with decreased plasma n-3 fatty acids and fetal hepatic apoptosis in nonhuman primates. PLoS One. 2011;6:e17261. doi: 10.1371/journal.pone.0017261. [DOI] [PMC free article] [PubMed] [Google Scholar]
- Grove KL, Grayson BE, Glavas MM, Xiao XQ, Smith MS. Development of metabolic systems. Physiol Behav. 2005;86:646–660. doi: 10.1016/j.physbeh.2005.08.063. [DOI] [PubMed] [Google Scholar]
- Grove KL, Smith MS. Ontogeny of the hypothalamic neuropeptide Y system. Physiol Behav. 2003;79:47–63. doi: 10.1016/s0031-9384(03)00104-5. [DOI] [PubMed] [Google Scholar]
- Haycock JW, Wakade AR. Activation and multiple-site phosphorylation of tyrosine hydroxylase in perfused rat adrenal glands. J Neurochem. 1992;58:57–64. doi: 10.1111/j.1471-4159.1992.tb09276.x. [DOI] [PubMed] [Google Scholar]
- Helena CV, Szawka RE, Anselmo-Franci JA. Noradrenaline involvement in the negative-feedback effects of ovarian steroids on luteinising hormone secretion. J Neuroendocrinol. 2009;21:805–812. doi: 10.1111/j.1365-2826.2009.01907.x. [DOI] [PubMed] [Google Scholar]
- Kalil GZ, Haynes WG. Sympathetic nervous system in obesity-related hypertension: mechanisms and clinical implications. Hypertens Res. 2012;35:4–16. doi: 10.1038/hr.2011.173. [DOI] [PMC free article] [PubMed] [Google Scholar]
- Kim SY, Dietz PM, England L, Morrow B, Callaghan WM. Trends in pre-pregnancy obesity in nine states, 1993–2003. Obesity. 2007;15:986–993. doi: 10.1038/oby.2007.621. [DOI] [PubMed] [Google Scholar]
- Kong WM, Martin NM, Smith KL, Gardiner JV, Connoley IP, Stephens DA, Dhillo WS, Ghatei MA, Small CJ, Bloom SR. Triiodothyronine stimulates food intake via the hypothalamic ventromedial nucleus independent of changes in energy expenditure. Endocrinology. 2004;145:5252–5258. doi: 10.1210/en.2004-0545. [DOI] [PubMed] [Google Scholar]
- Kvetnansky R, Ukropec J, Laukova M, Manz B, Pacak K, Vargovic P. Stress stimulates production of catecholamines in rat adipocytes. Cell Mol Neurobiol. 2012;32:801–813. doi: 10.1007/s10571-012-9822-6. [DOI] [PMC free article] [PubMed] [Google Scholar]
- Laborie C, Molendi-Coste O, Breton C, Montel V, Vandenbulcke F, Grumolato L, Anouar Y, Vieau D. Maternal perinatal undernutrition has long-term consequences on morphology, function and gene expression of the adrenal medulla in the adult male rat. J Neuroendocrinol. 2011;23:711–724. doi: 10.1111/j.1365-2826.2011.02159.x. [DOI] [PubMed] [Google Scholar]
- Langin D. Control of fatty acid and glycerol release in adipose tissue lipolysis. C R Biol. 2006;329:598–607. doi: 10.1016/j.crvi.2005.10.008. discussion 653–655. [DOI] [PubMed] [Google Scholar]
- Legradi G, Emerson CH, Ahima RS, Flier JS, Lechan RM. Leptin prevents fasting-induced suppression of prothyrotropin-releasing hormone messenger ribonucleic acid in neurons of the hypothalamic paraventricular nucleus. Endocrinology. 1997;138:2569–2576. doi: 10.1210/endo.138.6.5209. [DOI] [PubMed] [Google Scholar]
- Martin-Gronert MS, Ozanne SE. Mechanisms linking suboptimal early nutrition and increased risk of type 2 diabetes and obesity. J Nutr. 2010;140:662–666. doi: 10.3945/jn.109.111237. [DOI] [PubMed] [Google Scholar]
- Marques RG, Morales MM, Petroianu A. Brazilian law for scientific use of animals. Acta Cir Bras. 2009;24:69–74. doi: 10.1590/s0102-86502009000100015. [DOI] [PubMed] [Google Scholar]
- McCurdy CE, Bishop JM, Williams SM, Grayson BE, Smith MS, Friedman JE, Grove KL. Maternal high-fat diet triggers lipotoxicity in the fetal livers of nonhuman primates. J Clin Invest. 2009;119:323–335. doi: 10.1172/JCI32661. [DOI] [PMC free article] [PubMed] [Google Scholar]
- Moura EG, Lisboa PC, Passos MC. Neonatal programming of neuroimmunomodulation – role of adipocytokines and neuropeptides. Neuroimmunomodulation. 2008;15:176–188. doi: 10.1159/000153422. [DOI] [PubMed] [Google Scholar]
- Moura EG, Passos MC. Neonatal programming of body weight regulation and energetic metabolism. Biosci Rep. 2005;25:251–269. doi: 10.1007/s10540-005-2888-3. [DOI] [PubMed] [Google Scholar]
- Nobre JL, Lisboa PC, Santos-Silva AP, Lima NS, Manhaes AC, Nogueira-Neto JF, Cabanelas A, Pazos-Moura CC, Moura EG, de Oliveira E. Calcium supplementation reverts central adiposity, leptin, and insulin resistance in adult offspring programmed by neonatal nicotine exposure. J Endocrinol. 2011;210:349–359. doi: 10.1530/JOE-11-0172. [DOI] [PubMed] [Google Scholar]
- Nowak KW, Kaczmarek P, Mackowiak P, Ziolkowska A, Albertin G, Ginda WJ, Trejter M, Nussdorfer GG, Malendowicz LK. Rat thyroid gland expresses the long form of leptin receptors, and leptin stimulates the function of the gland in euthyroid non-fasted animals. Int J Mol Med. 2002;9:31–34. [PubMed] [Google Scholar]
- Oben JA, Mouralidarane A, Samuelsson AM, Matthews PJ, Morgan ML, McKee C, Soeda J, Fernandez-Twinn DS, Martin-Gronert MS, Ozanne SE, Sigala B, Novelli M, Poston L, Taylor PD. Maternal obesity during pregnancy and lactation programs the development of offspring non-alcoholic fatty liver disease in mice. J Hepatol. 2010;52:913–920. doi: 10.1016/j.jhep.2009.12.042. [DOI] [PubMed] [Google Scholar]
- Oliveira E, Moura EG, Santos-Silva AP, Fagundes AT, Rios AS, Abreu-Villaca Y, Nogueira Neto JF, Passos MC, Lisboa PC. Short- and long-term effects of maternal nicotine exposure during lactation on body adiposity, lipid profile, and thyroid function of rat offspring. J Endocrinol. 2009;202:397–405. doi: 10.1677/JOE-09-0020. [DOI] [PubMed] [Google Scholar]
- Ortiga-Carvalho TM, Oliveira KJ, Soares BA, Pazos-Moura CC. The role of leptin in the regulation of TSH secretion in the fed state: in vivo and in vitro studies. J Endocrinol. 2002;174:121–125. doi: 10.1677/joe.0.1740121. [DOI] [PubMed] [Google Scholar]
- Pacifico L, Anania C, Ferraro F, Andreoli GM, Chiesa C. Thyroid function in childhood obesity and metabolic comorbidity. Clin Chim Acta. 2011;413:396–405. doi: 10.1016/j.cca.2011.11.013. [DOI] [PubMed] [Google Scholar]
- Palkovits M. Isolated removal of hypothalamic or other brain nuclei of the rat. Brain Res. 1973;59:449–450. doi: 10.1016/0006-8993(73)90290-4. [DOI] [PubMed] [Google Scholar]
- Passos MC, Vicente LL, Lisboa PC, de Moura EG. Absence of anorectic effect to acute peripheral leptin treatment in adult rats whose mothers were malnourished during lactation. Horm Metab Res. 2004;36:625–629. doi: 10.1055/s-2004-825927. [DOI] [PubMed] [Google Scholar]
- Paxinos G, Watson C. The Rat Brain in Stereotaxic Coordinates. New York, NY: Academic Press; 2007. [Google Scholar]
- Perello M, Cakir I, Cyr NE, Romero A, Stuart RC, Chiappini F, Hollenberg AN, Nillni EA. Maintenance of the thyroid axis during diet-induced obesity in rodents is controlled at the central level. Am J Physiol Endocrinol Metab. 2010;299:E976–989. doi: 10.1152/ajpendo.00448.2010. [DOI] [PMC free article] [PubMed] [Google Scholar]
- Pinheiro CR, Oliveira E, Trevenzoli IH, Manhaes AC, Santos-Silva AP, Younes-Rapozo V, Claudio-Neto S, Santana AC, Nascimento-Saba CC, Moura EG, Lisboa PC. Developmental plasticity in adrenal function and leptin production primed by nicotine exposure during lactation: gender differences in rats. Horm Metab Res. 2011;43:693–701. doi: 10.1055/s-0031-1285909. [DOI] [PubMed] [Google Scholar]
- Pinto S, Roseberry AG, Liu H, Diano S, Shanabrough M, Cai X, Friedman JM, Horvath TL. Rapid rewiring of arcuate nucleus feeding circuits by leptin. Science. 2004;304:110–115. doi: 10.1126/science.1089459. [DOI] [PubMed] [Google Scholar]
- Reeves PG, Nielsen FH, Fahey GC., Jr AIN-93 purified diets for laboratory rodents: final report of the American Institute of Nutrition ad hoc writing committee on the reformulation of the AIN-76A rodent diet. J Nutr. 1993;123:1939–1951. doi: 10.1093/jn/123.11.1939. [DOI] [PubMed] [Google Scholar]
- Rodrigues AL, de Moura EG, Passos MC, Dutra SC, Lisboa PC. Postnatal early overnutrition changes the leptin signalling pathway in the hypothalamic-pituitary-thyroid axis of young and adult rats. J Physiol. 2009;587:2647–2661. doi: 10.1113/jphysiol.2009.169045. [DOI] [PMC free article] [PubMed] [Google Scholar]
- Samuelsson AM, Matthews PA, Argenton M, Christie MR, McConnell JM, Jansen EH, Piersma AH, Ozanne SE, Twinn DF, Remacle C, Rowlerson A, Poston L, Taylor PD. Diet-induced obesity in female mice leads to offspring hyperphagia, adiposity, hypertension, and insulin resistance: a novel murine model of developmental programming. Hypertension. 2008;51:383–392. doi: 10.1161/HYPERTENSIONAHA.107.101477. [DOI] [PubMed] [Google Scholar]
- Samuelsson AM, Morris A, Igosheva N, Kirk SL, Pombo JM, Coen CW, Poston L, Taylor PD. Evidence for sympathetic origins of hypertension in juvenile offspring of obese rats. Hypertension. 2010;55:76–82. doi: 10.1161/HYPERTENSIONAHA.109.139402. [DOI] [PubMed] [Google Scholar]
- Simmons R. Developmental origins of adult metabolic disease: concepts and controversies. Trends Endocrinol Metab. 2005;16:390–394. doi: 10.1016/j.tem.2005.08.004. [DOI] [PubMed] [Google Scholar]
- Spencer SJ. Early life programming of obesity: the impact of the perinatal environment on the development of obesity and metabolic dysfunction in the offspring. Curr Diabetes Rev. 2012;8:55–68. doi: 10.2174/157339912798829214. [DOI] [PubMed] [Google Scholar]
- Strakovsky RS, Zhang X, Zhou D, Pan YX. Gestational high fat diet programs hepatic phosphoenolpyruvate carboxykinase gene expression and histone modification in neonatal offspring rats. J Physiol. 2011;589:2707–2717. doi: 10.1113/jphysiol.2010.203950. [DOI] [PMC free article] [PubMed] [Google Scholar]
- Sullivan EL, Smith MS, Grove KL. Perinatal exposure to high-fat diet programs energy balance, metabolism and behavior in adulthood. Neuroendocrinology. 2011;93:1–8. doi: 10.1159/000322038. [DOI] [PMC free article] [PubMed] [Google Scholar]
- Takekoshi K, Ishii K, Nanmoku T, Shibuya S, Kawakami Y, Isobe K, Nakai T. Leptin stimulates catecholamine synthesis in a PKC-dependent manner in cultured porcine adrenal medullary chromaffin cells. Endocrinology. 2001;142:4861–4871. doi: 10.1210/endo.142.11.8484. [DOI] [PubMed] [Google Scholar]
- Teixeira C, Passos M, Ramos C, Dutra S, Moura E. Leptin serum concentration, food intake and body weight in rats whose mothers were exposed to malnutrition during lactation. J Nutr Biochem. 2002;13:493. doi: 10.1016/s0955-2863(02)00197-3. [DOI] [PubMed] [Google Scholar]
- Toste FP, Alves SB, Dutra SC, Bonomo IT, Lisboa PC, Moura EG, Passos MC. Temporal evaluation of the thyroid function of rats programmed by leptin treatment on the neonatal period. Horm Metab Res. 2006a;38:827–831. doi: 10.1055/s-2006-956502. [DOI] [PubMed] [Google Scholar]
- Toste FP, de Moura EG, Lisboa PC, Fagundes AT, de Oliveira E, Passos MC. Neonatal leptin treatment programmes leptin hypothalamic resistance and intermediary metabolic parameters in adult rats. Br J Nutr. 2006b;95:830–837. doi: 10.1079/bjn20061726. [DOI] [PubMed] [Google Scholar]
- Trevenzoli IH, Pinheiro CR, Conceicao EP, Oliveira E, Passos MC, Lisboa PC, Moura EG. Programming of rat adrenal medulla by neonatal hyperleptinemia: adrenal morphology, catecholamine secretion, and leptin signaling pathway. Am J Physiol Endocrinol Metab. 2010a;298:E941–949. doi: 10.1152/ajpendo.00734.2009. [DOI] [PubMed] [Google Scholar]
- Trevenzoli IH, Rodrigues AL, Oliveira E, Thole AA, Carvalho L, Figueiredo MS, Toste FP, Neto JF, Passos MC, Lisboa PC, Moura EG. Leptin treatment during lactation programs leptin synthesis, intermediate metabolism, and liver microsteatosis in adult rats. Horm Metab Res. 2010b;42:483–490. doi: 10.1055/s-0030-1249103. [DOI] [PubMed] [Google Scholar]
- Trevenzoli IH, Valle MM, Machado FB, Garcia RM, Passos MC, Lisboa PC, Moura EG. Neonatal hyperleptinaemia programmes adrenal medullary function in adult rats: effects on cardiovascular parameters. J Physiol. 2007;580:629–637. doi: 10.1113/jphysiol.2006.126151. [DOI] [PMC free article] [PubMed] [Google Scholar]
- Troina AA, Figueiredo MS, Moura EG, Boaventura GT, Soares LL, Cardozo LF, Oliveira E, Lisboa PC, Passos MA, Passos MC. Maternal flaxseed diet during lactation alters milk composition and programs the offspring body composition, lipid profile and sexual function. Food Chem Toxicol. 2010;48:697–703. doi: 10.1016/j.fct.2009.11.051. [DOI] [PubMed] [Google Scholar]
- Utsunomiya K, Yanagihara N, Tachikawa E, Cheah TB, Kajiwara K, Toyohira Y, Ueno S, Izumi F. Stimulation of catecholamine synthesis in cultured bovine adrenal medullary cells by leptin. J Neurochem. 2001;76:926–934. doi: 10.1046/j.1471-4159.2001.00123.x. [DOI] [PubMed] [Google Scholar]
- Vargovic P, Ukropec J, Laukova M, Cleary S, Manz B, Pacak K, Kvetnansky R. Adipocytes as a new source of catecholamine production. FEBS Lett. 2011;585:2279–2284. doi: 10.1016/j.febslet.2011.06.001. [DOI] [PubMed] [Google Scholar]
- Vickers MH, Gluckman PD, Coveny AH, Hofman PL, Cutfield WS, Gertler A, Breier BH, Harris M. Neonatal leptin treatment reverses developmental programming. Endocrinology. 2005;146:4211–4216. doi: 10.1210/en.2005-0581. [DOI] [PubMed] [Google Scholar]
- Vieau D, Sebaai N, Leonhardt M, Dutriez-Casteloot I, Molendi-Coste O, Laborie C, Breton C, Deloof S, Lesage J. HPA axis programming by maternal undernutrition in the male rat offspring. Psychoneuroendocrinology. 2007;32:16–20. doi: 10.1016/j.psyneuen.2007.03.014. [DOI] [PubMed] [Google Scholar]
- Yen PM. Physiological and molecular basis of thyroid hormone action. Physiol Rev. 2001;81:1097–1142. doi: 10.1152/physrev.2001.81.3.1097. [DOI] [PubMed] [Google Scholar]