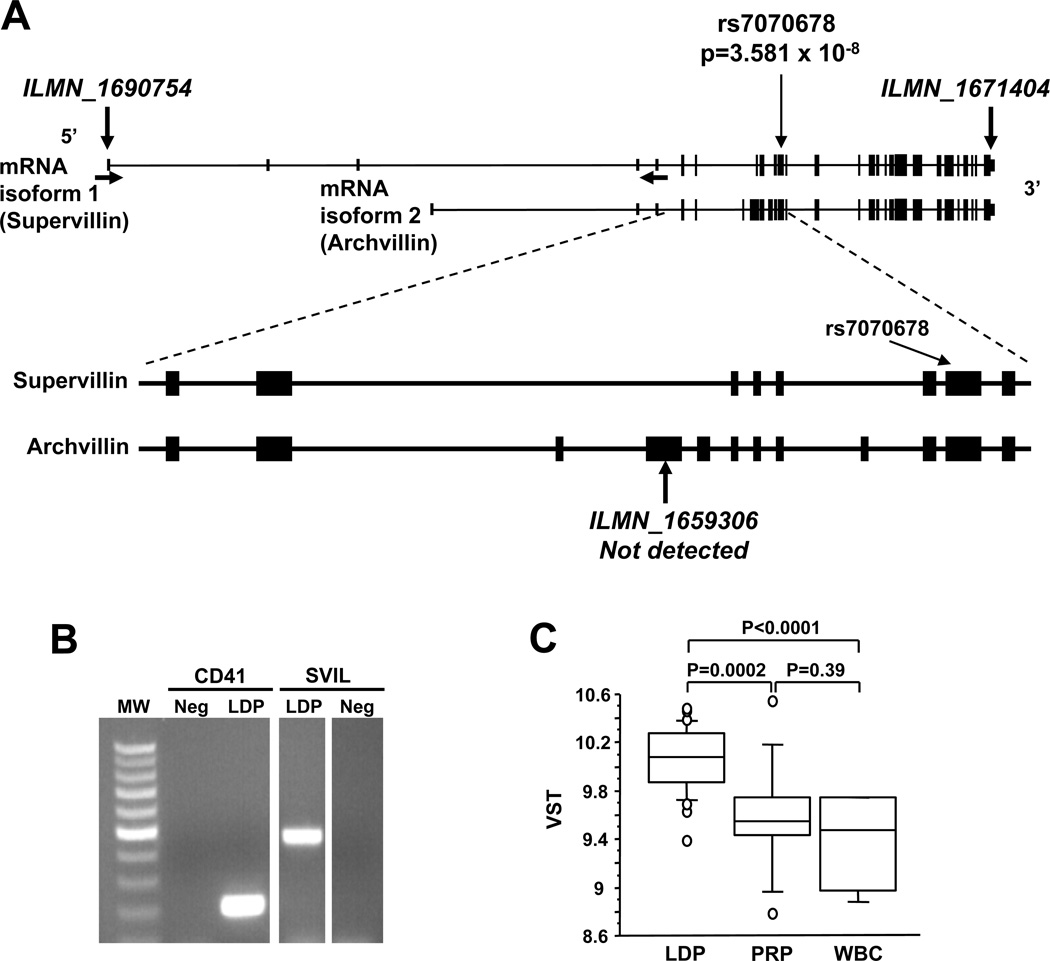
Figure 2.
SVIL genomic region and transcript expression. (A) Exon structure of SVIL at Chr10:29,786,283–29,963,907 with exons of the two major transcripts (NM_003174, NM_021738) shown as lines and boxes. The location of the 1st of the 5 SNPs (rs7070678) from Table 2 is shown by thin vertical arrows. The locations of the microarray probes are indicated by the thick vertical arrows and ILMN ID numbers. Horizontal arrows indicate the positions of the sense and antisense PCR primers. (B) Ethidium-stained agarose gel showing RT-PCR products of leukocyte-depleted platelet (LDP) RNA and primers specific for ITGA2 (CD41, integrin αIIb) and SVIL. Neg, no template control. (C) Box plot showing the levels of SVIL mRNA (ILMN_1671404) in LDP (n=29), PRP (n=11) and CD45+-leukocytes (WBC; n=5). Box represents interquartile range and whiskers represent 5% – 95% range.

