Abstract
Hematogenous metastasis involves a glycoprotein mediated adhesion cascade of tumor cells with E-selectin on the endothelial layer of the blood vessels. Cell-cell interactions play a major role in cancer metastasis and invasiveness. Intercellular communication between two cancer cells or between a cancer cell with a stromal cell in the microenvironment such as fibroblasts or inflammatory cells play an important role in metastatic invasion. Culturing tumor cells as 3D spheroids can recapitulate these physiologically relevant cell-cell interactions. The heterogeneity in primary tumor is attributed to cell subpopulations with varying degree of invasiveness. Co-culturing cancer cells with different phenotypes as 3D spheroids can mimic this heterogeneity. Here we report, the effect of homotypic and heterotypic interactions in breast cancer cells cultured as 3D spheroids on polydimethylsiloxane (PDMS) on the adhesion phenotype to E-selectin. We show that breast cancer cell lines (BT20 and MCF7) propagating as 3D spheroids on PDMS exhibit a stronger interaction with human recombinant E-selectin when compared to their respective monolayer grown counterparts on tissue culture plate (TCP). Matrigel invasion assay also indicated that BT20 and MCF7 spheroids were more invasive than BT20 and MCF7 cells grown as monolayers. To mimic tumor heterogeneity in vitro, a co-culture model included tumorigenic cell lines BT20, MCF7 and a non-tumorigenic mammary epithelial cell line MCF10A. These cell lines were cultured together in equal seeding ratio on PDMS to generate co-culture spheroids. The heterotypic interactions in the co-culture model resulted in enhancement of the adhesion of the most invasive BT20 cell line to E-selectin. BT20 cells in co-culture bound to the greatest degree to soluble E-selectin compared to MCF7 and MCF10A cells in co-culture. Co-invasion assay with co-culture spheroids indicated that BT20 cells in co-culture were more invasive than MCF7 and MCF10A cells. The results presented here indicate that homotypic and heterotypic interaction in cancer cells favor adhesion to E-selectin thus representing a complexity beyond planar cell culture. Also, when cells of different phenotypes are mixed, the heterogeneity enhances the adhesive phenotype and invasiveness of the most invasive cell population. The results challenge the classic use of planar cell culture for evaluating the adhesion of cancer cells with E-selectin and establish our co-culture technique as a model that can help investigative studies in metastasis and invasiveness of breast and other types of cancers.
1. Introduction
The hematogenous metastatic cascade is a series of events that mediate cells from the primary site to enter the circulation and eventually result in successful implantation of the circulating tumor cells (CTCs) at a secondary site [1]. The extravasation of cancer cells in circulation can involve an adhesion cascade mediated by glycoproteins ligands on cancer cells with E-selectin on endothelial cells that line the blood vessels [2]. The most common glycoprotein ligands expressed in cancer cells are CD44v4 [3], sialyl lewis X and sialyl lewis A [4]. The selectin mediated adhesion of cancer cells to the endothelium has been exploited for isolating CTCs from patient blood [5] and has been used as a tool to capture metastatic cells from the peripheral circulation and induce apoptosis to neutralize the captured cancer cell [6]. This interaction can be quantified in vitro by a rolling assay involving the use of E-selectin functionalized microrenathane microtubes by perfusing cancer cells at physiologically relevant shear stresses to determine the rolling velocity of cancer cells under flow [7].
Cancer cells propagating as multicellular tumor spheroids mimic most of the in vivo properties of tumors in terms of gradients of several important factors [8]. The compromised blood supply surrounding the tumor results in a depletion of nutrition and oxygen towards the interior of the tumor [9]. This results in higher levels of ATP and cellular proliferation in the periphery of a tumor [10]. The gradient in oxygen also results in the accumulation of lactase in cells at the interior of the tumor owing to anaerobic respiration [11]. These pathophysiological gradients are closely captured in cells propagating as tumor spheroids in vitro [8]. Recently, we reported the advantages of using PDMS for propagating cells as non-adherent spheroids over other conventional methods for generating tumor spheroids [12]. Thus, culturing cells as 3D spheroids can be used as a tool to evaluate important events in the metastatic cascade since they represent cell-cell interactions in more physiologically relevant culture conditions when compared to conventional planar cell culture often used in cancer research. In this study, we report that breast cancer cells propagating as 3D spheroids on PDMS show increased expression of E-selectin ligands when compared to monolayer cells. They also show a stronger interaction with E-selectin in an in vitro cell rolling assay when compared to cells propagating as a 2D monolayer.
Breast cancer represents a highly heterogeneous group of lesions with different molecular and biochemical signatures [13]. The heterogeneity associated with breast cancer has been explained by the theory clonal evolution which postulates that constantly more aggressive sub-clones emerge from the existing sub-clones resulting in a primary tumor that has subpopulations of cells with different levels of aggressiveness [14, 15]. Towards the later stages of the disease, it is hypothesized that the most aggressive sub-clone disseminates from the primary site resulting in a metastatic disease [16]. We hypothesize that the most aggressive sub-clones may have an increased ability to bind to E-selectin to enable metastasis.
This heterogeneity can be recapitulated in vitro by co-culturing cells of different levels of invasiveness as 3D spheroids. Cell-cell interactions are known to play a key role in the metastasis and invasion of breast cancer [17]. Interaction between two cancer cells or a cancer cell and stromal cell in the tumor microenvironment can influence the fate of a cell within the primary tumor [17, 18]. Previous studies report a change in gene expression profile of breast cancer cells co-cultured with fibroblasts [19, 20]. These interactions are known to modulate the proteolytic degradation of extracellular matrix that can increase the invasiveness of tumor cells [21]. Matrigel invasion assay has been used extensively to study the invasiveness of cancer cells [22]. The ability of cancer cells to invade the basement membrane and metastasize is roughly estimated in vitro by the ability of cells to invade Matrigel, a gelatinous extracellular protein matrix from a mouse sarcoma [22]. In this study, we developed an in vitro model for tumor heterogeneity by co-culturing BT20, a highly invasive breast cancer cell line [23], MCF7, a moderately invasive breast cancer cell line [23] and MCF10A, a non-tumorigenic mammary epithelial cell line. We distinguished the ability of these cells labeled with CellTracker probes in co-culture to bind to fluorescently tagged human recombinant E-selectin to determine if there is a difference in adhesion characteristics of these co-cultured cells when compared to spheroids derived from just one cell line (homotypic spheroids).
2. Materials and Methods
2.1 Cell lines and culture conditions
Breast cancer cell lines BT20 (ATCC, HTB-19) and MCF7 (ATCC, HTB-24) were cultured in ATCC-formulated Eagle’s Minimum Essential Medium (EMEM) (ATCC, 30-2003) supplemented with 10% fetal bovine serum (Atlanta Biologicals, S11050H), and 1% penicillin/streptomycin (PS) (Invitrogen, 15140-122). The media for MCF7 was additionally supplemented with 0.01 mg/mL of bovine insulin (Sigma Aldrich, I1882-100MG). The non-tumorigenic mammary epithelial cell line MCF10A (ATCC, CRL-10317) was cultured in DMEM/F12 (Invitrogen, 11320-033) supplemented with 5% horse serum (Atlanta Biologicals, S12150), 1% PS, 0.5 μg/mL hydrocortisone (Sigma Aldrich, H-0888), 20 ng/mL of human epidermal growth factor (hEGF) (Invitrogen, PHG0313), 10 ng/mL of bovine insulin and 100 ng/mL of cholera toxin (Enzo life sciences, BML G117). The co-culture spheroids were cultured in Dulbecco’s Modified Eagle Medium (DMEM) (Invitrogen, 11996-06) supplemented with 5% FBS and 1% PS. The cell lines were maintained at 37°C with 5% CO2.
2.2 Homotypic and co-culture spheroid culture on PDMS
Dow Corning’s Sylgard® 184 silicone elastomer kit was used in a 10:1 base to curing agent ratio (w/w) to cast PDMS in multiwell plates. The pre-polymer components were manually mixed with a pipette tip in a 50 mL tube for 30 seconds and 300 μL of the PDMS pre-polymer was pipetted into each well of a 24-well plate (BD Falcon, 353047) and allowed to settle at room temperature (RT) (20°C–25°C) for 30 min. The plates were then cured at 40°C for 4h. The PDMS cured plates were used for spheroid cell culture. For homotypic spheroid culture, cells propagating as a monolayer on regular cell culture grade T75-flasks (Celltreat, 229341) were dislodged from the plate using trypsin-EDTA (Invitrogen, 25200-056) and centrifuged at 1100 rpm for 5 min and resuspended at a concentration of 1×10⁵ cells/mL in cell culture media and 500 μL of the cell suspension was used for a single well of a 24-well plate cured with PDMS (50,000 cells/well).
For generating co-culture spheroids BT20, MCF7 and MCF10A cells were labeled with CellTracker probes blue (Invitrogen, C2110), green (Invitrogen, C7025) and red (Invitrogen, C34552), respectively, following the protocol supplied by the manufacturer. The cells were mixed in equal numbers to a final cell concentration of 1×10⁵ cells/mL and 500 μL of the cell suspension was used for a single well of a 24-well plate cured with PDMS. The cells plated on PDMS were incubated at 37°C with 5% CO2. The cells were allowed to grow on PDMS for 2 days before experiments.
2.3 MTT assay
Cell viability assays were conducted to evaluate the growth rate of cells plated on PDMS compared to standard tissue culture plate (TCP). Cells were plated onto PDMS cast in 24-well plates and onto standard 24-well TCP at similar seeding density. A standard colorimetric MTT assay was performed after 2 days in culture with 3-(4, 5-Dimethylthiazol-2-yl)-2, 5-diphenyltetrazolium bromide) (Chemicon (Millipore) CT0-A) to detect mitochondrial activity. The absorbance was measured at 690 nm using a microplate reader (Bio-Tek Instruments).
2.4 Flow cytometry
The expression levels of CD44v4, sialyl lewis X (CD15s) and sialyl lewis A (CA19-9) were investigated on cells propagating as a monolayer on TCP and 3D spheroids on PDMS. To prepare cells propagating as spheroids on PDMS for flow cytometry, the media was pooled together from 6 wells of a 24-well TCP cast with PDMS with cells. The spheroids were loosely adhered to the underlying PDMS surface and collecting the media ensured the removal of all the cells. The collected media was centrifuged and the resulting cell pellets were re-suspended in trypsin-EDTA to ensure complete dissociation of spheroid before incubating them with antibodies. The dissociation was verified using scatter plot between forward scatter and side scatter. An equivalent amount of culture media was added after 10 min of incubation in trypsin. The cell samples were then centrifuged and resuspended in 100 μL of staining buffer composed of 1% bovine serum albumin (BSA) (Sigma Aldrich, A7906-50G) in 1x phosphate buffer saline (PBS) (Invitrogen, 14190-144). Cells propagating as a monolayer on a 24-well TCP were trypsinized, centrifuged and resuspended in 100 μL of staining buffer. Cells were incubated at 4°C in dark with FITC-conjugated mouse anti-human CD44v4 (AbD Serotec, MCA1728F), FITC mouse IgG isotype control (BD Biosciences, 555742), mouse anti-human CD15s (BD Biosciences, 551344), and mouse anti-human CA19-9 (Abcam, ab15146). APC rat anti-mouse IgM (BD Biosciences, 550676) and FITC goat anti-mouse IgG/IgM (BD Biosciences 555988) were used as secondary antibodies and isotype control for CD15s and CA19-9 respectively. The cells were washed in PBS before incubating them with secondary antibodies and after incubation to remove excess antibody and were analyzed using a BD Accuri C6 flow cytometer (Becton Dickinson). The fold change in mean fluorescent intensity with respect to isotype control reported in this paper is the average of three different flow cytometry measurements.
2.5 Soluble E-selectin binding assay
To determine the ability of cells to bind to E-selectin in homotypic spheroids, co-culture spheroids and monolayer cells, soluble E-selectin binding assay was performed and the binding was quantified using flow cytometric analysis. Fluorescent E-selectin was prepared by overnight conjugation of 200 μg/mL of recombinant human E-selectin/Fc-chimera (R&D Biosystems, 724-ES) with 400 μg/mL of AlexaFluor 647 goat anti-human IgG (Invitrogen, A21145). An isotype control was generated by overnight conjugation of recombinant human E-selectin with AlexaFluor 647 mouse IgG isotype control (BD Biosciences, 557783). The homotypic spheroids and monolayer cells were prepared for the binding assay as mentioned in the previous section and 20 μL of the fluorescent E-selectin and the isotype control was used for 1×10⁶ cells/mL in staining buffer (1% BSA). The cells were incubated in dark at RT for 45 min. The co-culture spheroids were pre-labeled using CellTracker probes to differentiate between the cell types and were dissociated in trypsin and incubated with fluorescent E-selectin and isotype control at the same concentration. The cells were washed twice in PBS to remove excess fluorescent E-selectin and were resuspended in 1% BSA and analyzed using BD FACS Aria using filters for Alexafluor 647 (640 nm excitation/668 nm emission), CellTracker blue (353 nm excitation/466 nm emission), CellTracker green (492 nm excitation, 512 nm emission) and CellTracker red (577nm excitation/602 nm emission). The results from flow cytometric analysis were analyzed using Flow-Jo v7.6 (Tree Star) software.
2.6 Cell rolling assay
To determine the adhesion characteristics of cancer cells with E-selectin, rolling assay was performed using microrenathane microtube. Briefly, 50 cm long microrenathane microtubes with 300 μm inner diameter (Braintree Scientific, MRE040) were first washed with 1x PBS and then coated with 10 μg/mL of recombinant protein G (Calbiochem, 539303) for 60 min at RT. They were then incubated with 20 μg/mL of recombinant human E-selectin/Fc-chimera for 120 min. The surface was then blocked with 5% milk (EMD Millipore, 6250) for 60 min to avoid any non-specific interaction of cells with the surface of the tube. The tubes were then washed with PBS++ (PBS saturated with calcium chloride) (Invitrogen, 14040-133) after which dissociated spheroid and monolayer cells at a concentration of 1×10⁶ cells/mL in PBS++ were perfused through the tube at 1 dyn/cm2 using a syringe pump (KDS 230, IITC life sciences). The rolling videos were recorded and later analyzed using in-house ImageJ (NIH, USA) stack tools to determine the rolling velocity. The number of cells per frame of the rolling video was manually counted.
2.7 Scratch assay
The scratch recovery assay is a basic assay to determine the migratory behavior of cells. Studies have shown that the rate of recovery of the scratched region is indicative of the migratory potential of cells in vivo [24]. Cells were grown to confluency in a 6-well plate (Celltreat, 229106). The confluent cells were serum starved overnight by incubating them with their respective culture medium with 1% PS. A scratch was made with a sterile 200 μL pipette tip in a marked region of the well. There were two replicate wells for each cell line and images of the marked scratch were taken immediately after inducing the scratch. The wells with scratches were incubated in serum free culture medium at 37°C with 5% CO2. The recovery of the scratch was determined by imaging the same field 24h later and built-in ImageJ drawing options were used to determine the scratch area and percent reduction is wound size. The data reported in this paper are the average of 6 different fields for each cell type.
2.8 Western blotting
The expression of hypoxia inducible factors in monolayer, homotypic and co-culture spheroids was detected by standard western blot procedures. As a positive control, monolayer cells were treated with 100 μM cobalt chloride (Sigma Aldrich, 232696-5G) for 24h which is known to induce hypoxia in monolayer cells [25]. Briefly, the lysates were separated by SDS-PAGE and transferred to a nitrocellulose blotting membrane (Bio-Rad, 162-0115). Membranes were blocked with 5% milk 60 min at RT. The membranes were then incubated overnight at 4°C with 1:1000 mouse anti-human HIF-1α specific Ab (BD Biosciences, 610958) and mouse anti-human HIF-1β specific Ab (BD Biosciences, 611078) in 5% milk. Membranes were also probed with mouse anti-human β-actin (Santacruz biotechnology, sc-81178) at 1:2000 dilution as a loading control. Following the overnight incubation with primary Ab, the membranes were washed with 1x TBS/0.1% Tween-20 and then incubated for 60 min at RT with 1:1000 anti-mouse IgG-HRP (BD Biosciences, 554002) in 5% milk. The bands were visualized using a chemiluminiscent HRP substrate (Millipore, WBKL 50500) in a luminescent image analyzer (Fujifilm, LAS-4000). The band intensity was determined using built-in options available in ImageJ software.
2.9 Matrigel invasion assay
Matrigel invasion assay was performed to determine the invasive potential of cells grown as monolayer, homotypic and co-culture spheroids. Matrigel (BD Biosciences, 356234) was diluted to a final concentration of 300 μg/mL and 100 μL of the diluted Matrigel was pipetted into the transwell insert with transparent PET membrane containing 8 μm sized pores (BD Biosciences, 353097) and allowed to gel overnight. The coated transwells are termed invasion chambers. Monolayer and spheroid cells of all the cell lines were dissociated in serum free culture media and plated at 2.5×10⁴ cells/mL in the invasion chamber. The invasion chambers were then transferred to 24-well plate filled with 750 μL of cell culture media with 5% FBS as a chemoattractant. Equal numbers of uncoated transwell inserts were prepared as a control. The cell invasion chambers were incubated overnight at 37°C with 5% CO2. After overnight incubation, the chambers were removed and washed twice with PBS and the non-invading cells were discarded using a cotton swab moistened with cell culture media. The cells were fixed in 4% paraformaldehyde, permeabilized in 100% methanol and stained using geimsa stain (Sigma Aldrich, GS500) and the number of invading cells were manually counted using a light microscope. The percentage invasiveness was calculated by normalizing the number of invading cells in Matrigel coated inserts with the number of invading cells in uncoated (control) inserts. Invasion chambers with dissociated co-culture spheroids labeled with CellTracker probes were fluorescently imaged to determine the invasiveness of individual cell types in co-culture spheroids. The invasion reported in this paper is the average of 3 different experiments on 3 different fields of view each for an invasion chamber.
2.10 Fluorescent imaging and statistical analysis
Fluorescent were captured on a Zeiss 710 laser scanning confocal microscope. The co-culture spheroids labeled with CellTracker probes were captured using multi-track program to avoid spectral bleed-through. The co-culture spheroids propagating on PDMS were collected by removing the media from the 24-well plate and spun down at 1000 rpm for 10 min. The pellets were resuspended in 4% formaldehyde and spun down at 700 rpm for 10 min using a cytospin (Harlow Scientific) on confocal grade slides (Leica Microsystems, 3800205) and cover-slipped using a mounting media (eBiosciences, 00-4958-02) before imaging. For images reporting soluble E-selectin binding, fluorescent soluble E-selectin prepared as mentioned in Section 2.5 was incubated in dark with co-culture spheroids at RT for 45 min in 5% BSA. These spheroids were then washed in PBS to remove excess fluorescent E-selectin and then spun down and cover-slipped before imaging. The bright field images were captured using an Olympus IX81 microscope.
The statistical significance reported in this paper was tested using unpaired student t-test and the values of n are reported in the figures wherever applicable.
3. Results
3.1 Morphology and proliferation of cell lines on PDMS and TCP
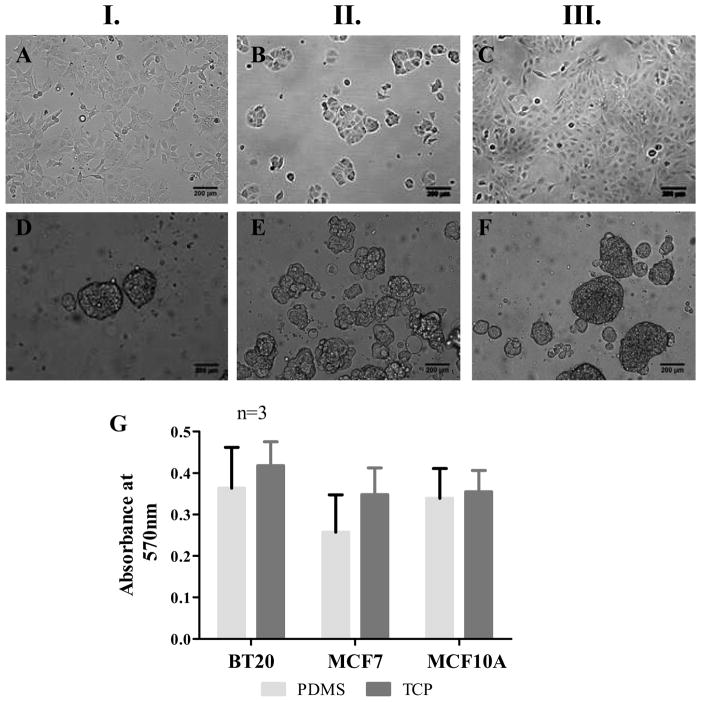
The breast cancer cell lines BT20, MCF7 and the mammary epithelial cell line MCF10A were seeded on PDMS cured in 24-well plate as mentioned in Section 2.2. BT20, MCF7 and MCF10A breast cancer cell lines propagated as a monolayer on hydrophilic TCP (Fig. 1A, 1B and 1C) and on hydrophobic PDMS they propagated as non-adherent spheroids (Fig. 1D, 1E and 1F). Cell proliferation assay using MTT revealed that there was no significant difference in cellular activity on PDMS and TCP (p<0.1) (Fig. 1G).
Fig. 1.
Morphology of BT20 (I.), MCF7 (II.) and MCF10A (III.) cell lines propagating as a monolayer on TCP (AC) and spheroids on PDMS (D–F) 48h after seeding [seeding density=50,000 cells/well of a 24-well plate, scale bars=200 μm]. MTT assay for determining the metabolic activity of cells indicate that there is no statistically significant difference in the metabolic activity of cells on PDMS and TCP (G).
3.2 E-selectin ligand expression on spheroid and monolayer cells
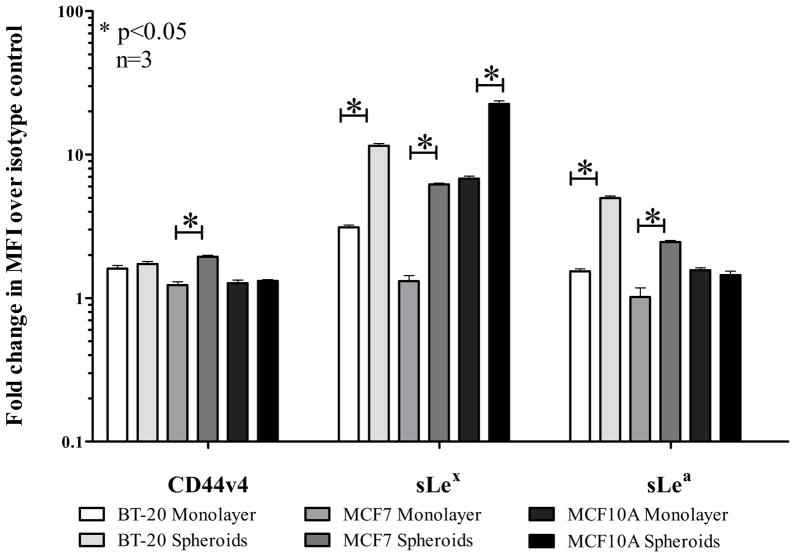
Flow cytometric analysis for glycoprotein ligands (CD44v4, sialyl Lewis X (sLex), sialyl Lewis A (sLea)) for E-selectin on BT20, MCF7 and MCF10A cell lines showed a general treand that spheroid cells show an increased expression of the E-selectin ligands CD44v4, sLex and sLea. Representative flow cytometry histograms are shown in Supplementary Fig. 1S. The bar graph for average fold change in mean fluorescence intensity (MFI) normalized to the respective isotype control for three different flow experiments is indicated in Fig. 2. Statistical significance is indicated by an asterisk (*) on the bar graph. In particular, sialyl lewis X (sLex) was highly upregulated in the spheroid morphology for all the three cell lines.
Fig. 2.
Fold change in mean fluorescence intensity (MFI) normalized to respective isotype controls indicating the expression levels of E-selectin ligands CD44v4, Sialyl Lewis X (sLex) and Sialyl Lewis A (sLea) in monolayer and spheroid cells.
3.3 Rolling velocity measurements on E-selectin coated microtubes
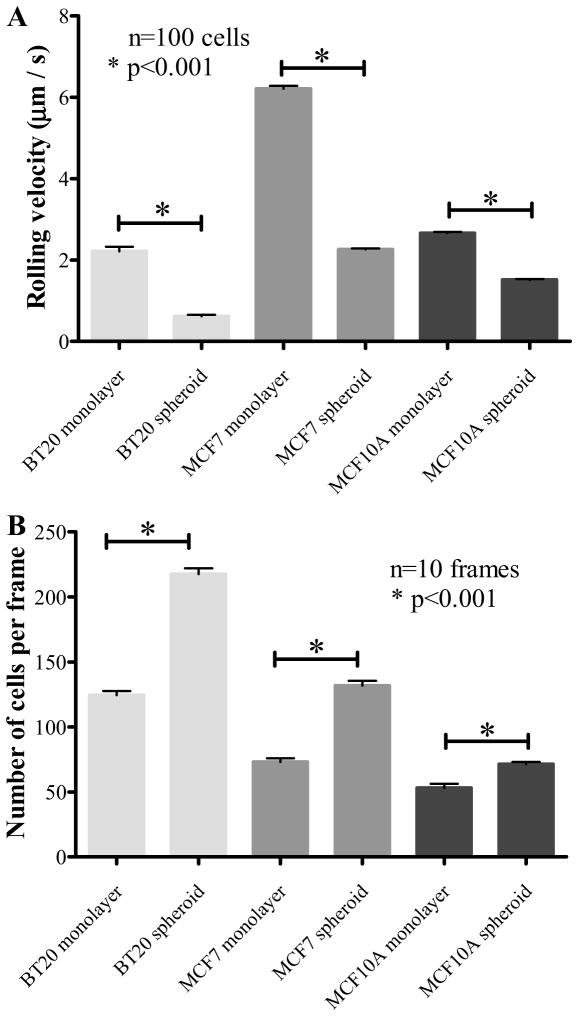
The cell rolling assay on E-selectin coated microtubes as described in Section 2.6 showed that monolayer cells exhibited a weaker adhesion (higher rolling velocity) as opposed to spheroid cells that exhibited a stronger adhesion (lower rolling velocity) on microtubes functionalized with human recombinant E-selectin (Fig. 3A). The highly invasive BT20 cells showed the lowest rolling velocity in monolayer morphology (2.2 ± 1.1 μm/s) followed by MCF7 cells (6.2 ± 0.69 μm/s). MCF10A monolayer cells also showed a stronger interaction (2.66 ± 0.29 μm/s) with E-selectin although it is not physiologically relevant in the context of cancer metastasis because they are non-tumorigenic cells. The spheroid cells showed a significantly lower rolling velocity when compared to monolayer cells (p<0.01). The rolling velocity for BT20, MCF7 and MCF10A cells grown as spheroids were 0.6 ± 0.33 μm/s, 2.26 ± 0.21 μm/s, 1.51 ± 0.17 μm/s respectively. The expression of E-selectin ligands is most relevant when the cells leave the primary site and enter the systemic circulation and the likelihood of this fate can perhaps be estimated by determining the migratory potential of the cell lines in vitro. Thus, although MCF10A cells showed a stronger interaction with E-selectin they do not possess the migratory potential to enter the circulation as revealed by the in vitro scratch assay (Supplementary Fig. 2S). The stronger interaction of breast cancer cell lines propagating as spheroids are perhaps more likely to enter the systemic circulation as exhibited by their increased migratory potential (Supplementary Fig. 2S).
Fig. 3.
(A.) Rolling velocity of monolayer and spheroid cells (1×10⁶ cells/mL) perfused through E-selectin coated microtubes at 1dyn/cm2. (B.) The number of cells per frame indicating the fraction of cells from monolayer and spheroid morphology interacting with E-selectin coated microtubes under flow.
3.4 Soluble E-selectin binding to spheroid and monolayer cells
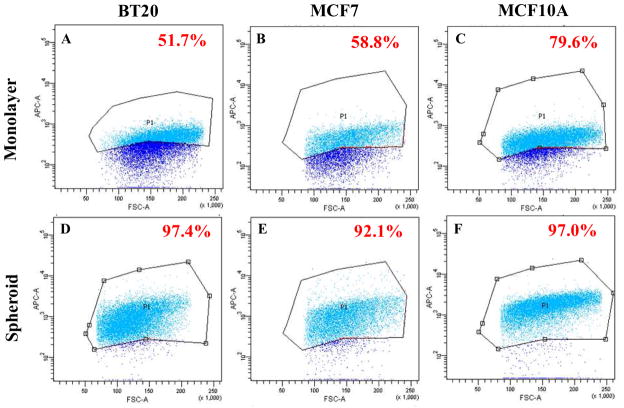
In our rolling experiments we noticed that the number of cells that interacted with E-selectin functionalized microtubes were significantly higher for spheroid cells when compared to monolayer cells for all three cell lines (Fig. 3B). Representative video frames for spheroid and monolayer morphology for all three cell lines are given in Supplementary Fig. 3S. These figures indicate the number of cells interacting with E-selectin coated microtubes. This suggests that a greater fraction of cells in the spheroid morphology were capable of interacting with E-selectin in comparison to cells from the monolayer morphology. Flow cytometry scatter plots for soluble E-selectin binding to spheroid and monolayer cells indicated that 51.7% of BT20 monolayer cells (Fig. 4A), 58.8% of MCF7 monolayer cells (Fig. 4B), 79.6% of MCF10A monolayer cells (Fig. 4C) bound to fluorescent E-selectin as opposed to 97.4% of BT20 spheroid cells (Fig. 4D), 92.1% of MCF7 spheroid cells (Fig. 4E) and 97.0% of MCF10A spheroid cells (Fig. 4F), respectively. Confocal fluorescence microscopy images for soluble E-selectin binding revealed that monolayer cells have a weak and diffuse staining pattern for soluble E-selectin when compared to spheroid cells that show a relatively strong and cortical staining pattern for soluble E-selectin (Supplementary Fig. 4S).
Fig. 4.
Scatter plots from flow cytometry experiments indicating the percentage of cells binding to soluble E-selectin in BT20 (A and D), MCF7 (B and E) and MCF10A (C and F) in monolayer (A–C) and spheroid (D–F) morphology.
3.5 Heterogeneous co-culture spheroids on PDMS
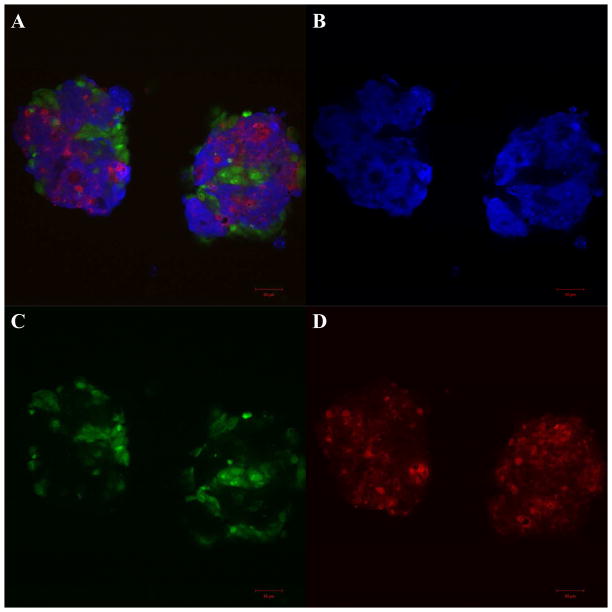
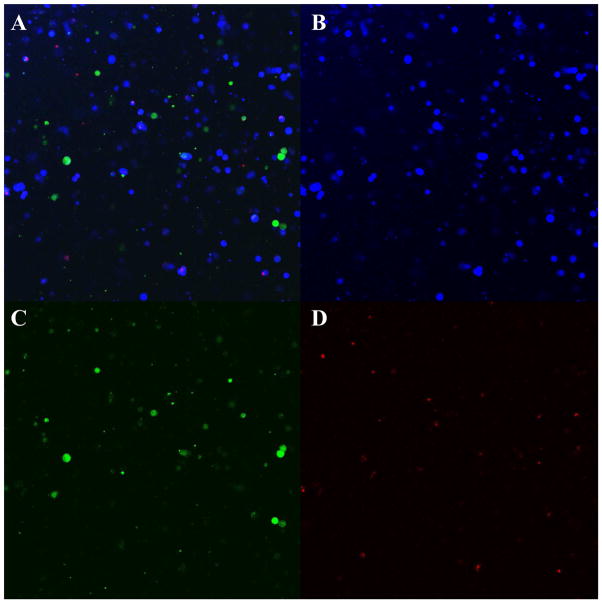
BT20 cells labeled with CellTracker blue, MCF7 cells labeled with CellTracker green and MCF10A cells labeled with CellTracker red were mixed in equal ratio and seeded on PDMS cured in 24-well plates. These cells formed tightly packed heterogeneous spheroids by the end of 48h (Fig. 5A). More often we observed the breast cancer cells BT20 (Fig. 5B) and MCF7 (Fig. 5C) and the non-tumorigenic MCF10A cells (Fig 5D) associate amongst themselves and other cell types in co-culture allowing for homotypic and heterotypic interactions in our model. These images show that a heterogeneous co-culture model for breast cancer can be developed by culturing cell lines with different levels of aggressiveness on PDMS. The co-culture spheroids were composed of all three cell types in comparable ratio by the end of 48h (Supplementary Fig. 5S). The percentage of BT20, MCF7 and MCF10A cells within co-culture spheroids 48h after culture were 33.7±2.2%, 31.4±0%, 32.7±3.7% respectively (n=2 flow cytometry experiments). Co-culture spheroids can be generated without the requirement of any expensive bio-reactors or extended time period of culture. The spatial heterogeneity allows cell-cell interactions between different cell types and thus creates the opportunity to study the effect of the heterotypic interactions on the adhesion properties of the cells in co-culture.
Fig. 5.
Confocal microscopy images of co-culture spheroids with BT20 (blue) MCF7 (green) and MCF10A (red) cells on PDMS (A) by the end of 48h. Individual fields showing BT20 (B), MCF7 (C) and MCF10A (D) cells. [Scale bars=50 μm]
3.6 Soluble E-selectin binding to cells in co-culture spheroids
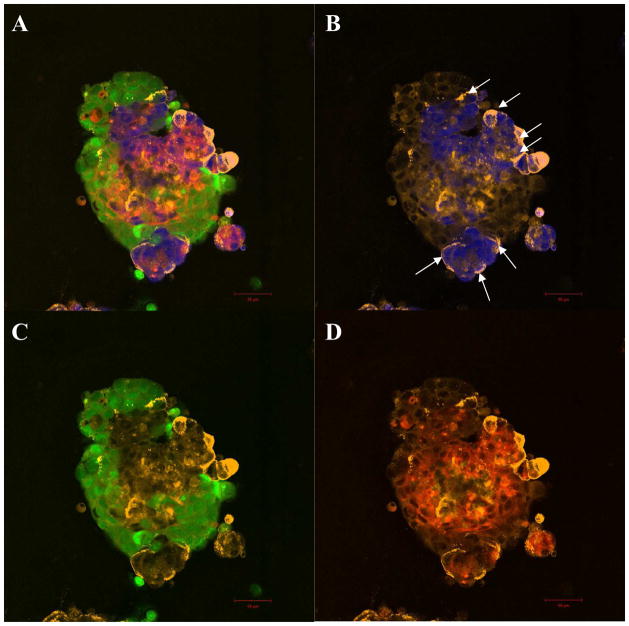
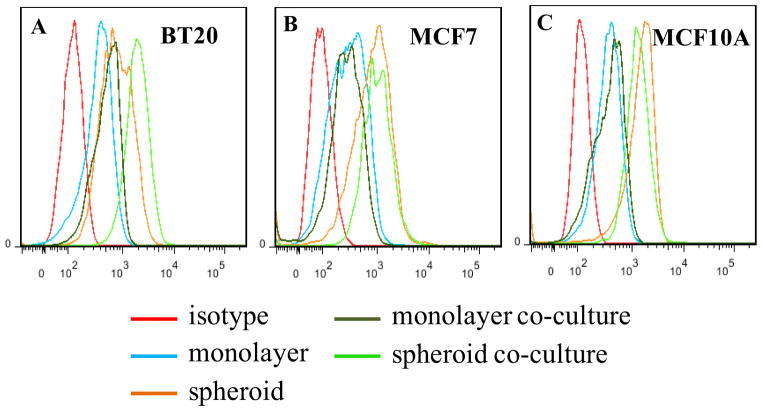
To determine the adhesion properties of cells in co-culture, soluble E-selectin binding was assayed on co-culture spheroids labeled with CellTracker probes. A representative confocal image for soluble E-selectin binding to whole co-culture spheroid is shown in Fig. 6A. The strong and cortical staining pattern of soluble E-selectin (orange) corresponds to BT20 cells (blue) within co-culture spheroids (indicated by arrow heads in Fig. 6B). Super imposition of soluble E-selectin labeling with each specific cell type shows increased binding of soluble E-selectin to BT20 cells in co-culture (Fig. 6B). The staining patterns of soluble E-selectin (orange) are relatively weak and diffuse in comparison for MCF7 (green) cells (Fig. 6C) or MCF10A (red) cells (Fig. 6D) in co-culture. Co-culture spheroids were dissociated to analyze soluble E-selectin binding to individual cells collected from co-culture. Flow cytometry histograms indicate that BT20 cells in co-culture show increased binding to soluble E-selectin when compared to homotypic spheroids composed of BT20 cells alone (Fig. 7A). BT20 cells in co-culture showed the greatest shift in fluorescent intensity peak when compared to monolayer, homotypic spheroids or monolayer co-culture. No shift in fluorescent intensity peak was observed for MCF7 and MCF10 cells in co-culture when compared to their homotypic spheroids (Fig. 7B and 7C).
Fig. 6.
Confocal microscopy images of soluble E-selectin (orange) binding to whole co-culture spheroids with BT20 (blue) MCF7 (green) and MCF10A (red) cells on PDMS (A). Superimposed images of soluble E-selectin with individual cell types in co-culture indicate preferential binding of soluble E-selectin to BT20 cells in co-culture (B) when compared to MCF7 (C) or MCF10A cells (D) in co-culture. [Scale bars=50 μm]
Fig. 7.
Flow cytometry histograms indicate a shift in fluorescent intensity peak for soluble E-selectin binding in monolayer, spheroid, monolayer co-culture and spheroid co-culture with respect to isotype control for BT20 (A), MCF7 (B) and MCF10A (C) cells.
3.7 Invasiveness of monolayer, homotypic spheroids and co-culture spheroids
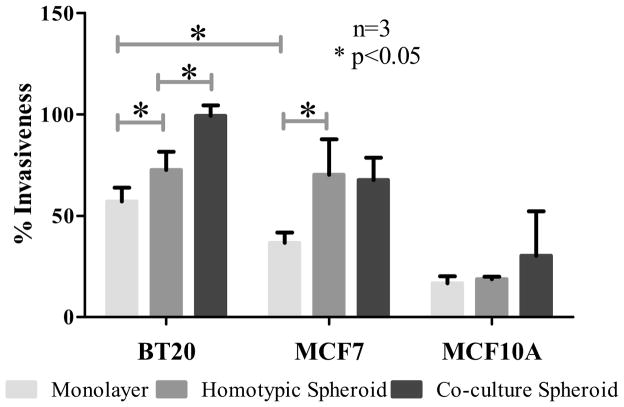
Matrigel invasion assay was performed on monolayer, homotypic and co-culture spheroids to determine their invasiveness. The spheroids were dissociated before seeding them in invasion chambers as mentioned in Section 2.9. The question of whether the increased expression of E-selectin ligands in homotypic and co-culture spheroids correlated with increased invasiveness of the cell lines was addressed. Matrigel invasion assay indicated that BT20 monolayer cells were significantly more invasive than MCF7 monolayer cells (Fig. 8) and BT20 and MCF7 spheroids were significantly more invasive than their monolayer counterparts (Fig. 8). From the soluble E-selectin binding assay it is clear that BT20 cells in co-culture spheroids bound to a greater amount of E-selectin when compared to MCF7 and MCF10A cells in co-culture spheroids. The co-culture spheroids were dissociated and seeded on Matrigel coated chambers and the number of cells invading the Matrigel were manually counted by visualization using CellTracker probes. A representative 10x image of an invasion chamber in Fig. 9A shows that there were more BT20 cells (Fig. 9B) compared to MCF7 (Fig. 9C) or MCF10A (Fig. 9D) cells. The percentage invasion also indicated that BT20 cells in co-culture spheroids were significantly more invasive than BT20 homotypic spheroids (Fig. 8) and there was no significant difference in the invasiveness of MCF7 and MCF10A cells in co-culture when compared to their homotypic spheroids.
Fig. 8.
Quantification of the ability of cells in monolayer, homotypic spheroid and co-culture spheroids to invade Matrigel-coated transwell plates.
Fig. 9.
Fluorescent images showing BT20 (blue) MCF7 (green) and MCF10A (red) cells from co-culture spheroids invading the Matrigel (A). Individual fields indicate that the number of BT20 cells invading the matrigel (B) is higher than the number of MCF7 (C) or MCF10A (D) cells invading the Matrigel-coated transwell.
3.8 Expression of hypoxia inducible factors
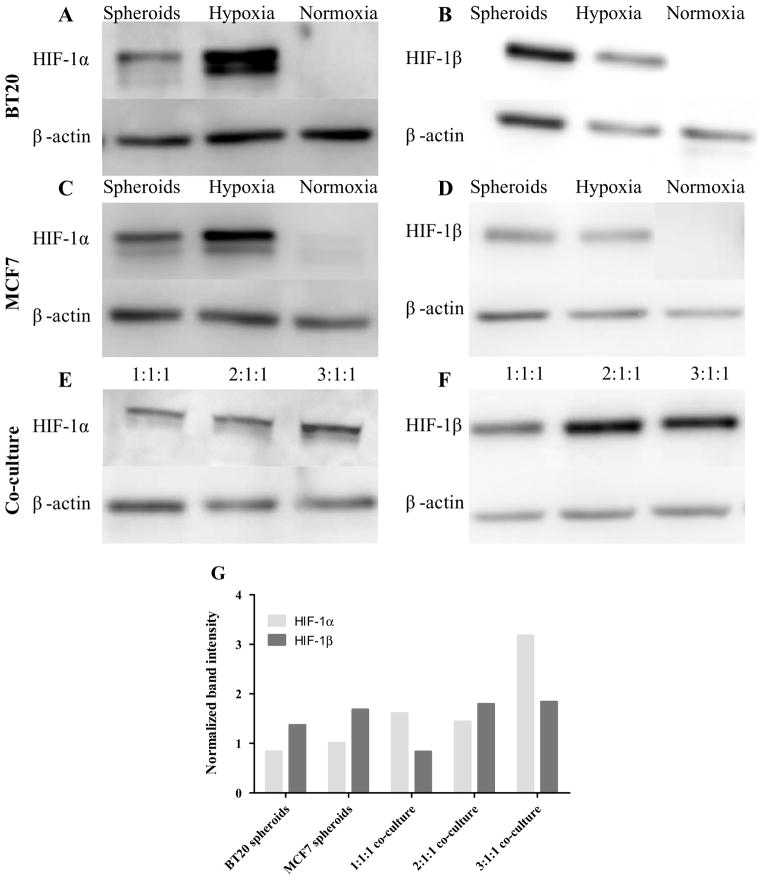
To identify the missing link between spheroid morphology and increased adhesion phenotype exhibited by breast cancer cells, we determined the expression of hypoxia inducible factors (HIF-1α and HIF-1β) in monolayer, homotypic spheroids and co-culture spheroids using western blot procedure as described in Section 2.8. As a positive control for hypoxic conditions, monolayer cells treated were with cobalt chloride. It was observed that BT20 and MCF7 spheroids expressed both HIF-1α (Fig. 10A and 10C) and HIF-1β (Fig. 10B and 10D), whereas monolayer cells did not express these hypoxia inducible factors. To determine if there an increased expression of these factors in co-culture conditions, we increased the ratio of BT20 cells in co-culture while maintaining the total cell number the same and an increase in expression of HIF-1α with increasing proportions of BT20 cells in co-culture was observed (Fig. 10E). The band intensity was computed and normalized with respect to respective loading control. The normalized band intensity was found to increase for HIF-1α expression in co-culture spheroids and co-culture spheroids with increasing proportions of BT20 cells (Fig. 10G) whereas there was no discernible change in HIF-1β expression (Fig. 10F and 10G).
Fig. 10.
Western blot membranes showing the expression of HIF-1α and HIF-1β in spheroid, monolayer (Normoxia) and monolayer cells treated with cobalt chloride (Hypoxia) in BT20 (A and B), MCF7 (C and D) and co-culture spheroids (E and F). The ratio indicated in the figure corresponds to BT20:MCF7:MCF10A cells in co-culture. The band intensity computed using ImageJ indicates that expression of HIF-1α increased in co-culture conditions (G).
4. Discussion
The metastasis of primary tumors accounts for 90% of deaths in cancer patients [26]. The metastatic cascade is initiated by the adhesion and extravasation of primary tumor cells that enter the circulation. The mechanism of cancer cell adhesion to the blood vessel wall is believed to be similar to that of leukocyte recruitment from the bloodstream to an inflammation site [27]. Although the mechanism may be similar the molecules that mediate tethering, rolling and adhesion of cancer cells to the endothelium differ from that of leukocytes as discussed in a recent review [28]. Adhesion is primarily mediated by E-selectin on activated endothelium and glycoproteins on cancer cells [29]. Breast cancer is a highly metastatic form of neoplasia and is known to often lead to metastasis even after surgical removal of the primary tumor [30]. The primary focus of this paper was to study the adhesion of breast cancer cells to E-selectin in vitro that may lead to better understanding of breast cancer invasion and metastasis.
Breast cancer cell lines are used as model systems for studying the molecular basis of breast cancer progression. The relative heterogeneity in the established breast cancer cell lines have been particularly useful in studying important aspects of breast cancer such as the prevalence of cancer stem cells [31] and specific subpopulations that bear close resemblance to functionally distinct primary cancer subtypes [32]. The use of conventional planar cell culture to study breast cancer cell lines reduces the potential of these cell lines as a model for studying breast cancer. In this study, we used spheroid cell culture using polydimethylsiloxane, for characterizing the adhesion of breast cancer cell lines to human recombinant E-selectin. We focused on a highly invasive breast cancer cell line BT20, moderately invasive breast cancer cell line MCF7 and non-tumorigenic mammary epithelial cell line MCF10A. We have previously elucidated the advantages of PDMS based spheroid cell culture technique over other conventional methods for generating multi-cellular tumor spheroids [12]. The hydrophobic PDMS substrate allows for the formation of spheroids (Fig. 1D–F). The ability of these spheroids to closely recapitulate the in vivo biochemical gradients [8] allows for cell-cell interaction in a more physiologically relevant scenario.
First, the expression of E-selectin ligands on spheroids derived from breast cancer cell lines (BT20, MCF7) and the non-tumorigenic epithelial cell line (MCF10A) were characterized and compared to the expression with their respective monolayer morphology (Fig. 2). Significantly increased expression of several E-selectin ligands on cell lines propagating in spheroid morphology was found. In particular, sialyl Lewis X was upregulated in all of the cell lines propagating as spheroids. Sialyl lewis X is an important glycosylated ligand with oligosaccharides bearing sialic acid, fucose and sulfate at the end of O-liked glycans [33]. It was found that sialyl lewis X is specifically upregulated in invasive breast carcinomas [34] and serum glycans profile analysis revealed that patients with progressive cancer show a significant increase in sialylation and fucosylation of O-linked glycans [35].
Increased expression of E-selectin ligands in cells propagating as spheroids suggested to study the interaction of these cells with human recombinant E-selectin using a flow based rolling assay developed by our group. Previous works demonstrated this method to isolate hematopoietic stem cells from human bone marrow cells that express CD34 when perfused through P-selectin coated microrenathane microtubes [36]. The rolling assay has also been used to induce apoptotic signals to rolling cells on selectin-coated channels [6]. More recently, a modification of this assay using natural halloysite nanotubes was reported to isolate CTCs from patient blood samples [5]. The cell rolling assay revealed that cells grown as spheroids had significantly lower rolling velocity (stronger interaction) when compared to monolayer cells at the same shear stress (Fig. 3A). We also found that the number of cells interacting with E-selectin coated microtubes was much higher in cells that propagated as spheroids (Fig. 3B and Fig. 4). These results, taken together, demonstrate that spheroid cell culture can alter the adhesion phenotype of cancer cells. This support the idea that spheroid cell culture can replace conventional monolayer culture for cancer research and for the first time demonstrates the change in adhesion phenotype with altered morphology of cells. The non-tumorigenic MCF10A spheroids show increased expression of E-selectin ligands and interact with E-selectin but do not exhibit the necessary migratory potential exhibited by cancer cells (Fig. 2S). Previous studies report that transfecting MCF10A cell line with genes that can induce migratory or invasive phenotype results in a dramatic change in their ability to proliferate and migrate in vitro [37] and colonize organs in nude mice in vivo [38].
The heterogeneity associated with tumors is the primary reason for resistance seen to conventional treatments [39]. Several studies in the past have elucidated the advantages of tumor structures formed in vitro validating the use of multicellular aggregates as an enabling model for cancer research as reviewed in [40]. In the current study, we recapitulated the heterogeneity by co-culturing cell lines with different levels of invasiveness as 3D spheroids (Fig. 5). Though MCF10A cells are non-tumorigenic, they have been shown to increase the invasive phenotype of breast-cancer cells [41]. When injected with the metastatic breast cancer cell line MDA-MB-231, MCF10A cells were shown to facilitate tumor progression in immunocompromised mice [41]. These effects were attributed to the heterotypic cell-cell communication involving paracrine signaling between the two cell types [41]. Interaction between subpopulations of cells with different levels of invasiveness is known to play a key role in the behavior of cells within a tumor [42]. Metastasis is initiated by a specific subpopulation that acquires an aggressive phenotype when compared to the other cells in a primary tumor [16]. This is termed clonal dominance and is often reported as an accepted model of breast cancer metastasis [43]. Our co-culture model includes all of these aspects of heterotypic interactions in 3D. This allows a more in vivo like culture environment to evaluate the effect of these interactions on the adhesion phenotype of these cells in co-culture.
Soluble E-selectin binding to co-culture spheroids indicated preferential binding of E-selectin to BT20 cells, the most invasive cells in co-culture (Fig. 7). Quantitative analysis of soluble E-selectin binding using flow cytometry also revealed that BT20 cells in co-culture bound to the highest degree to soluble E-selectin compared to MCF7 and MCF10A cells in co-culture (Fig. 8). Consistent with the theory of clonal dominance, the most invasive subpopulation must leave the site of primary tumor to result in a metastatic disease. To evaluate this we performed Matrigel invasion assay on cells grown as monolayer, homotypic and co-culture spheroids to determine the invasiveness of these cell lines. The invasion assay indicated that breast cancer spheroid cells were invasive than monolayer cells and that BT20 cells in co-culture showed the greatest potential to invade Matrigel compared to other cells in co-culture (Fig. 9). The ability of BT20 cells in co-culture to maximally bind to soluble E-selectin combined with the observation of its ability to invade Matrigel to the greatest degree establishes our co-culture model as a platform for performing investigative studies in breast cancer metastasis and invasiveness.
To identify the link between spheroid morphology and increased adhesion phenotype we studied the expression of hypoxia inducible factors in tumor spheroids (Fig. 10). Tumor hypoxia refers to regions of severe oxygen deprivation in rapidly dividing cells that constitute the tumor, which is mostly due lack of well formed blood vessels. The cellular response to hypoxia is often mediated by changes in gene expression [44, 45]. A regulatory gene that functions under hypoxic conditions is the hypoxia-inducible factor (HIF) which is known to promote tumor progression by expressing genes that help in increasing angiogenesis and metastasis [46]. HIF-1 is an important member of this family of transcription factors and it has multiple implications for cancer biology [47]. It is a heterodimer composed of two subunits (HIF-1α and HIF-1β) and their degradation is deactivated in response to hypoxia resulting in nuclear translocation where they exercise their function as a transcription factor [48]. It has been previously reported that hypoxia regulates the expression of adhesion molecules in cancer cells [49]. It was shown that colorectal cancer cell lines cultured under hypoxic conditions showed an increase in expression of sialyl Lewis X and sialyl Lewis A ligands [49]. Hypoxia also induces a shift in metabolism of cancer cells called Warburg’s effect [50]. Hypoxic microenvironment induces the expression of glucose transporters and glycolytic enzymes strongly suggesting that several nucleotide sugar biosynthetic pathways are regulated by hypoxia in solid tumors including glycosylation of E-selectin ligands [51]. The expression of HIF-1α and HIF-1β in our tumor spheroids could possibly explain the increased adhesive phenotype of spheroid cells (Fig. 10). Recently, it was also shown that epithelial-to-mesenchymal transition (EMT) induces E-selectin ligand expression in cancer cells [52]. The most aggressive cell subpopulations undergo EMT to leave the primary site [16] during the metastatic cascade. This could possibly explain the increase in expression of HIF-1α in co-culture spheroids (Fig 10G) which would lead to increased adhesive properties of BT20 cells in co-culture. Given these results, spheroid cell culture could replace conventional monolayer culture for performing investigative studies in the field of cancer adhesion and our co-culture model can be used for studying several aspects of tumor heterogeneity such as resistance to drugs, induction of epithelial-to-mesenchymal transition, angiogenesis and other events that occur during breast cancer metastasis.
5. Conclusions
In this work we conducted experiments to identify the relationship between spheroid morphology and E-selectin mediated adhesion phenotype of breast cancer cells and we extended our spheroid cell culture to develop a co-culture model for breast cancer heterogeneity. In the first part of this paper, we observed that cells from spheroids showed increased expression of E-selectin ligands and a higher fraction of cells from the spheroid morphology bound to soluble E-selectin. Our in vitro rolling assay revealed a stronger interaction of spheroid cells with E-selectin coated microtubes when perfused under physiologically relevant shear stress. Based on confocal microscopy and flow cytometry experiments on co-culture spheroids, it was concluded that heterotypic interactions favor the adhesion of the most invasive cell type (BT20) to E-selectin. Matrigel invasion assay revealed that apart from showing increased binding to soluble E-selectin, BT20 cells in co-culture were also the most invasive. Thus, co-culture increases the invasiveness of the most invasive cell type and also favors the adhesion of these cells to E-selectin under flow.
Supplementary Material
Acknowledgments
The authors would like to thank the cytometry core (Veterinary School, Cornell University) supported in part by the ESSCF, NYS-DOH, Contract #123456. Opinions expressed are solely of the author; they do not necessarily reflect the view of ESSCB, the NYS-DOH, or NYS.
The authors would like to thank Microscopy and Imaging Facility (MIF) at Weill Hall, Cornell University. This study was funded by NIH grant No. CA143876 to M.R.K.
Footnotes
Publisher's Disclaimer: This is a PDF file of an unedited manuscript that has been accepted for publication. As a service to our customers we are providing this early version of the manuscript. The manuscript will undergo copyediting, typesetting, and review of the resulting proof before it is published in its final citable form. Please note that during the production process errors may be discovered which could affect the content, and all legal disclaimers that apply to the journal pertain.
References
- 1.Pantel K, Brakenhoff RH. Dissecting the metastatic cascade. Nat Rev Cancer. 2004;4(6):448–56. doi: 10.1038/nrc1370. [DOI] [PubMed] [Google Scholar]
- 2.Kannagi R. Carbohydrate-mediated cell adhesion involved in hematogenous metastasis of cancer. Glycoconj J. 1997;14(5):577–84. doi: 10.1023/a:1018532409041. [DOI] [PubMed] [Google Scholar]
- 3.Zen K, Liu DQ, Guo YL, Wang C, Shan J, Fang M, et al. CD44v4 is a major E-selectin ligand that mediates breast cancer cell transendothelial migration. PLoS One. 2008;3(3):e1826. doi: 10.1371/journal.pone.0001826. [DOI] [PMC free article] [PubMed] [Google Scholar]
- 4.Takada A, Ohmori K, Yoneda T, Tsuyuoka K, Hasegawa A, Kiso M, et al. Contribution of carbohydrate antigens sialyl Lewis A and sialyl Lewis X to adhesion of human cancer cells to vascular endothelium. Cancer Res. 1993;53(2):354–61. [PubMed] [Google Scholar]
- 5.Hughes AD, Mattison J, Western LT, Powderly JD, Greene BT, King MR. Microtube device for selectin-mediated capture of viable circulating tumor cells from blood. Clin Chem. 2012;58(5):846–53. doi: 10.1373/clinchem.2011.176669. [DOI] [PubMed] [Google Scholar]
- 6.Rana K, Liesveld JL, King MR. Delivery of apoptotic signal to rolling cancer cells: a novel biomimetic technique using immobilized TRAIL and E-selectin. Biotechnol Bioeng. 2009;102(6):1692–702. doi: 10.1002/bit.22204. [DOI] [PubMed] [Google Scholar]
- 7.Hsu JW, Yasmin-Karim S, King MR, Wojciechowski JC, Mickelsen D, Blair ML, et al. Suppression of prostate cancer cell rolling and adhesion to endothelium by 1alpha,25-dihydroxyvitamin D3. Am J Pathol. 2011;178(2):872–80. doi: 10.1016/j.ajpath.2010.10.036. [DOI] [PMC free article] [PubMed] [Google Scholar]
- 8.Hirschhaeuser F, Menne H, Dittfeld C, West J, Mueller-Klieser W, Kunz-Schughart LA. Multicellular tumor spheroids: an underestimated tool is catching up again. J Biotechnol. 2010;148(1):3–15. doi: 10.1016/j.jbiotec.2010.01.012. [DOI] [PubMed] [Google Scholar]
- 9.Vaupel P, Kallinowski F, Okunieff P. Blood flow, oxygen and nutrient supply, and metabolic microenvironment of human tumors: a review. Cancer Res. 1989;49(23):6449–65. [PubMed] [Google Scholar]
- 10.Locasale JW, Cantley LC. Altered metabolism in cancer. BMC Biol. 2010;8:88. doi: 10.1186/1741-7007-8-88. [DOI] [PMC free article] [PubMed] [Google Scholar]
- 11.Kim JW, Dang CV. Cancer’s molecular sweet tooth and the Warburg effect. Cancer Res. 2006;66(18):8927–30. doi: 10.1158/0008-5472.CAN-06-1501. [DOI] [PubMed] [Google Scholar]
- 12.Chandrasekaran S, DeLouise LA. Enriching and characterizing cancer stem cell sub-populations in the WM115 melanoma cell line. Biomaterials. 2011;32(35):9316–27. doi: 10.1016/j.biomaterials.2011.08.056. [DOI] [PubMed] [Google Scholar]
- 13.Polyak K. Heterogeneity in breast cancer. J Clin Invest. 2011;121(10):3786–8. doi: 10.1172/JCI60534. [DOI] [PMC free article] [PubMed] [Google Scholar]
- 14.Polyak K. Breast cancer: origins and evolution. J Clin Invest. 2007;117(11):3155–63. doi: 10.1172/JCI33295. [DOI] [PMC free article] [PubMed] [Google Scholar]
- 15.Greaves M, Maley CC. Clonal evolution in cancer. Nature. 2012;481(7381):306–13. doi: 10.1038/nature10762. [DOI] [PMC free article] [PubMed] [Google Scholar]
- 16.Chaffer CL, Weinberg RA. A perspective on cancer cell metastasis. Science. 2011;331(6024):1559–64. doi: 10.1126/science.1203543. [DOI] [PubMed] [Google Scholar]
- 17.Hanahan D, Weinberg RA. Hallmarks of cancer: the next generation. Cell. 2011;144(5):646–74. doi: 10.1016/j.cell.2011.02.013. [DOI] [PubMed] [Google Scholar]
- 18.Harlozinska A. Progress in molecular mechanisms of tumor metastasis and angiogenesis. Anticancer Res. 2005;25(5):3327–33. [PubMed] [Google Scholar]
- 19.Elenbaas B, Weinberg RA. Heterotypic signaling between epithelial tumor cells and fibroblasts in carcinoma formation. Exp Cell Res. 2001;264(1):169–84. doi: 10.1006/excr.2000.5133. [DOI] [PubMed] [Google Scholar]
- 20.Buess M, Nuyten DS, Hastie T, Nielsen T, Pesich R, Brown PO. Characterization of heterotypic interaction effects in vitro to deconvolute global gene expression profiles in cancer. Genome Biol. 2007;8(9):R191. doi: 10.1186/gb-2007-8-9-r191. [DOI] [PMC free article] [PubMed] [Google Scholar]
- 21.DeClerck YA. Interactions between tumour cells and stromal cells and proteolytic modification of the extracellular matrix by metalloproteinases in cancer. Eur J Cancer. 2000;36(10):1258–68. doi: 10.1016/s0959-8049(00)00094-0. [DOI] [PubMed] [Google Scholar]
- 22.Repesh LA. A new in vitro assay for quantitating tumor cell invasion. Invasion Metastasis. 1989;9(3):192–208. [PubMed] [Google Scholar]
- 23.Tong D, Czerwenka K, Sedlak J, Schneeberger C, Schiebel I, Concin N, et al. Association of in vitro invasiveness and gene expression of estrogen receptor, progesterone receptor, pS2 and plasminogen activator inhibitor-1 in human breast cancer cell lines. Breast Cancer Res Treat. 1999;56(1):91–7. doi: 10.1023/a:1006262501062. [DOI] [PubMed] [Google Scholar]
- 24.Liang CC, Park AY, Guan JL. In vitro scratch assay: a convenient and inexpensive method for analysis of cell migration in vitro. Nat Protoc. 2007;2(2):329–33. doi: 10.1038/nprot.2007.30. [DOI] [PubMed] [Google Scholar]
- 25.Fu OY, Hou MF, Yang SF, Huang SC, Lee WY. Cobalt chloride-induced hypoxia modulates the invasive potential and matrix metalloproteinases of primary and metastatic breast cancer cells. Anticancer Res. 2009;29(8):3131–8. [PubMed] [Google Scholar]
- 26.Mehlen P, Puisieux A. Metastasis: a question of life or death. Nat Rev Cancer. 2006;6(6):449–58. doi: 10.1038/nrc1886. [DOI] [PubMed] [Google Scholar]
- 27.Strell C, Entschladen F. Extravasation of leukocytes in comparison to tumor cells. Cell Commun Signal. 2008;6:10. doi: 10.1186/1478-811X-6-10. [DOI] [PMC free article] [PubMed] [Google Scholar]
- 28.Geng Y, Marshall JR, King MR. Glycomechanics of the metastatic cascade: tumor cell-endothelial cell interactions in the circulation. Ann Biomed Eng. 2012;40(4):790–805. doi: 10.1007/s10439-011-0463-6. [DOI] [PubMed] [Google Scholar]
- 29.Orr FW, Wang HH, Lafrenie RM, Scherbarth S, Nance DM. Interactions between cancer cells and the endothelium in metastasis. J Pathol. 2000;190(3):310–29. doi: 10.1002/(SICI)1096-9896(200002)190:3<310::AID-PATH525>3.0.CO;2-P. [DOI] [PubMed] [Google Scholar]
- 30.Howell A. An early peak of relapse after surgery for breast cancer. Breast Cancer Res. 2004;6(6):255–7. doi: 10.1186/bcr946. [DOI] [PMC free article] [PubMed] [Google Scholar]
- 31.Charafe-Jauffret E, Ginestier C, Iovino F, Wicinski J, Cervera N, Finetti P, et al. Breast cancer cell lines contain functional cancer stem cells with metastatic capacity and a distinct molecular signature. Cancer Res. 2009;69(4):1302–13. doi: 10.1158/0008-5472.CAN-08-2741. [DOI] [PMC free article] [PubMed] [Google Scholar]
- 32.Neve RM, Chin K, Fridlyand J, Yeh J, Baehner FL, Fevr T, et al. A collection of breast cancer cell lines for the study of functionally distinct cancer subtypes. Cancer Cell. 2006;10(6):515–27. doi: 10.1016/j.ccr.2006.10.008. [DOI] [PMC free article] [PubMed] [Google Scholar]
- 33.Konstantopoulos K, Thomas SN. Cancer cells in transit: the vascular interactions of tumor cells. Annu Rev Biomed Eng. 2009;11:177–202. doi: 10.1146/annurev-bioeng-061008-124949. [DOI] [PubMed] [Google Scholar]
- 34.Jeschke U, Mylonas I, Shabani N, Kunert-Keil C, Schindlbeck C, Gerber B, et al. Expression of sialyl lewis X, sialyl Lewis A, E-cadherin and cathepsin-D in human breast cancer: immunohistochemical analysis in mammary carcinoma in situ, invasive carcinomas and their lymph node metastasis. Anticancer Res. 2005;25(3A):1615–22. [PubMed] [Google Scholar]
- 35.Kyselova Z, Mechref Y, Kang P, Goetz JA, Dobrolecki LE, Sledge GW, et al. Breast cancer diagnosis and prognosis through quantitative measurements of serum glycan profiles. Clin Chem. 2008;54(7):1166–75. doi: 10.1373/clinchem.2007.087148. [DOI] [PubMed] [Google Scholar]
- 36.Narasipura SD, Wojciechowski JC, Charles N, Liesveld JL, King MR. P-Selectin coated microtube for enrichment of CD34+ hematopoietic stem and progenitor cells from human bone marrow. Clin Chem. 2008;54(1):77–85. doi: 10.1373/clinchem.2007.089896. [DOI] [PubMed] [Google Scholar]
- 37.Sun XG, Rotenberg SA. Overexpression of protein kinase Calpha in MCF-10A human breast cells engenders dramatic alterations in morphology, proliferation, and motility. Cell Growth Differ. 1999;10(5):343–52. [PubMed] [Google Scholar]
- 38.Giunciuglio D, Culty M, Fassina G, Masiello L, Melchiori A, Paglialunga G, et al. Invasive phenotype of MCF10A cells overexpressing c-Ha-ras and c-erbB-2 oncogenes. Int J Cancer. 1995;63(6):815–22. doi: 10.1002/ijc.2910630612. [DOI] [PubMed] [Google Scholar]
- 39.Turner NC, Reis-Filho JS. Genetic heterogeneity and cancer drug resistance. Lancet Oncol. 2012;13(4):e178–85. doi: 10.1016/S1470-2045(11)70335-7. [DOI] [PubMed] [Google Scholar]
- 40.Kunz-Schughart LA. Multicellular tumor spheroids: intermediates between monolayer culture and in vivo tumor. Cell Biol Int. 1999;23(3):157–61. doi: 10.1006/cbir.1999.0384. [DOI] [PubMed] [Google Scholar]
- 41.Poczobutt JM, Tentler J, Lu X, Schedin PJ, Gutierrez-Hartmann A. Benign mammary epithelial cells enhance the transformed phenotype of human breast cancer cells. BMC Cancer. 2010;10:373. doi: 10.1186/1471-2407-10-373. [DOI] [PMC free article] [PubMed] [Google Scholar]
- 42.Heppner GH, Miller FR. The cellular basis of tumor progression. Int Rev Cytol. 1998;177:1–56. doi: 10.1016/s0074-7696(08)62230-5. [DOI] [PubMed] [Google Scholar]
- 43.Weigelt B, Peterse JL, van’t Veer LJ. Breast cancer metastasis: markers and models. Nat Rev Cancer. 2005;5(8):591–602. doi: 10.1038/nrc1670. [DOI] [PubMed] [Google Scholar]
- 44.Keith B, Simon MC. Hypoxia-inducible factors, stem cells, and cancer. Cell. 2007;129(3):465–72. doi: 10.1016/j.cell.2007.04.019. [DOI] [PMC free article] [PubMed] [Google Scholar]
- 45.Hill RP, Marie-Egyptienne DT, Hedley DW. Cancer stem cells, hypoxia and metastasis. Semin Radiat Oncol. 2009;19(2):106–11. doi: 10.1016/j.semradonc.2008.12.002. [DOI] [PubMed] [Google Scholar]
- 46.Rankin EB, Giaccia AJ. The role of hypoxia-inducible factors in tumorigenesis. Cell Death Differ. 2008;15(4):678–85. doi: 10.1038/cdd.2008.21. [DOI] [PMC free article] [PubMed] [Google Scholar]
- 47.Calzada MJ, del Peso L. Hypoxia-inducible factors and cancer. Clin Transl Oncol. 2007;9(5):278–89. doi: 10.1007/s12094-007-0055-y. [DOI] [PubMed] [Google Scholar]
- 48.Semenza GL. Targeting HIF-1 for cancer therapy. Nat Rev Cancer. 2003;3(10):721–32. doi: 10.1038/nrc1187. [DOI] [PubMed] [Google Scholar]
- 49.Koike T, Kimura N, Miyazaki K, Yabuta T, Kumamoto K, Takenoshita S, et al. Hypoxia induces adhesion molecules on cancer cells: A missing link between Warburg effect and induction of selectin-ligand carbohydrates. Proc Natl Acad Sci U S A. 2004;101(21):8132–7. doi: 10.1073/pnas.0402088101. [DOI] [PMC free article] [PubMed] [Google Scholar]
- 50.Weljie AM, Jirik FR. Hypoxia-induced metabolic shifts in cancer cells: moving beyond the Warburg effect. Int J Biochem Cell Biol. 2011;43(7):981–9. doi: 10.1016/j.biocel.2010.08.009. [DOI] [PubMed] [Google Scholar]
- 51.Shirato K, Nakajima K, Korekane H, Takamatsu S, Gao C, Angata T, et al. Hypoxic regulation of glycosylation via the N-acetylglucosamine cycle. J Clin Biochem Nutr. 2011;48(1):20–5. doi: 10.3164/jcbn.11-015FR. [DOI] [PMC free article] [PubMed] [Google Scholar]
- 52.Sakuma K, Aoki M, Kannagi R. Transcription factors c-Myc and CDX2 mediate E-selectin ligand expression in colon cancer cells undergoing EGF/bFGF-induced epithelial-mesenchymal transition. Proc Natl Acad Sci U S A. 2012;109(20):7776–81. doi: 10.1073/pnas.1111135109. [DOI] [PMC free article] [PubMed] [Google Scholar]
Associated Data
This section collects any data citations, data availability statements, or supplementary materials included in this article.


