Abstract
The low strain-rate viscosity of glass-forming cryoprotective agents (CPAs) in the vicinity of the glass transition is studied experimentally. Data on the mechanical behavior in this regime is necessary to the long-term goal of developing planning tools for cryopreservation via vitrification (vitreous means glassy in Latin); such tools will provide guidelines for reducing thermal stress with its devastating effects. While the flow behavior of some glass-forming CPAs is well documented in the literature for the upper part of the cryogenic temperature range (where the CPA has a comparatively low viscosity), it is the flow behavior near the glass transition temperature (where the CPA behaves as nearly a solid with an extremely high viscosity) which is critical to the analysis of stress that develops in the cryopreserved material. If the elevated viscosity limits the material's ability to flow—in order to accommodate the thermal strain resulting from large temperature gradients, especially at the high cooling rates necessary to form glass—structural damage may follow. Information on the behavior of the CPA in the lower part of the cryogenic temperature range is largely unavailable. A new measurement device is presented in this study, in which a solid rod is pulled from a long narrow cup containing a CPA, producing an essentially one-dimensional and isothermal field of flow. The viscosity and relaxation time of the CPA is inferred from measurements of the resulting load on the rod when extracted at a constant velocity. The current study reports on experimental data near glass transition of 7.05M DMSO, a reference CPA solution, and the CPA cocktails VS55 and DP6.
Keywords: Viscosity, Glass Transition, Cryoprotective Agents, DMSO, DP6, VS55, Experimental Study
Introduction
Vitrification (vitreous in Latin means glassy) is an alternative to conventional preservation of biological materials at cryogenic temperatures, with applications in cell, tissue, and organ storage [1]. The presence of high concentrations of CPAs that interact strongly with water prevent the water molecules from forming ice. It has been found that depressing the homogeneous nucleation temperature until it equals the glass transition temperature permits vitrification of macroscopic biological systems. Prevention of freezing means that water in the tissue remains liquid during cooling. However, as cooling progresses, the molecular motions in the liquid permeating the tissue decrease and, eventually, an “arrested liquid” state—known as a glass—is achieved. Vitrification does not have any of the biologically damaging effects associated with freezing [2,3]. No appreciable degradation occurs over time in living matter trapped within a vitreous matrix, and vitrification is potentially applicable to all biological systems.
Vitrification often requires relatively high cooling rates, which result in non-uniform temperature distributions in the specimen. The resulting non-uniformity in temperature leads to non-uniform thermal expansion [4-9], which—when the specimen is of a significant size—may result in structural damage [10], with fracture formation as its most dramatic outcome [11]. Cryopreservation by vitrification is performed after the biological solutions are substituted with CPA solutions, either by the process of perfusion, diffusion, or a combination thereof. Once fully loaded, a large fraction of the tissue volume is occupied by CPA (in the range of two thirds to three quarters in soft tissues). Thus, the mechanical properties of the CPA—in particular its viscosity and relaxation time—can be expected to significantly influence the transition of the specimen into and out of cryogenic storage; these are the properties targeted in the current study.
Similar to other known glass forming materials, the viscosity of the CPA increases exponentially with decreasing temperature. For practical engineering calculations, the CPA becomes effectively solid below its glass transition temperature, Tg. While several definitions are common for the glass transition temperature, when measured with differential calorimetry scanning (DSC) [12] this transition occurs over a significant temperature range, rather than at a unique temperature. For example, glass transition in glycerol occurs over a 9K temperature range during rewarming, when subject to a rewarming rate of 10 K/min [12]; this implies a transition range between the common definitions of Tg,onset and Tg,end. In another study, Brockbank and co-workers [13] have shown a glass transition temperature range of 3 K for 3M DMSO, and a range of up to 8 K for relevant concentration combinations of CPA cocktails combining DMSO and polyethylene glycol. In general, the glass transition temperature range increases with increasing concentration. The glass transition effect can even be sensed for several degrees Kelvin beyond the above definition of glass transition temperature range, since the boundaries of this region are somewhat loosely defined. An alternative measurement technique of the glass transition temperature based on thermal expansion measurements has also been presented recently [5,6].
The variation of viscosity with temperature around Tg is of great importance in stress analysis of vitrification [14-17]. Since viscosity data on CPAs is typically available only at the upper part of the cryogenic temperature range—usually above the heterogeneous nucleation temperature (above -40°C for most relevant CPAs)—previous stress analyses have approximated the viscosity by extrapolation between the heterogeneous nucleation point and the glass transition temperature, as measured from DSC studies (around -132°C for DMSO solutions [6]); following an acceptable engineering practice, those studies assumed a viscosity value of 1012 Pa-s at Tg. The current study presents an experimental apparatus and a technique to measure the viscosity near glass transition. With such data available, the need for extrapolation of viscosity values can be eliminated.
The current paper focuses on the viscosity and relaxation time of the CPAs VS55 and DP6, and the reference solution of 7.05 M DMSO. These particular CPAs are chosen because the relevant data complements previously published data on thermal expansion for the same CPAs [4-9], and on the viscoelasticity of blood vessels vitrified in their presence [16,18]. Incorporating this newly developed data into stress analysis is expected to shed more light on the process of tissue vitrification, with the ultimate goal of developing planning tools for cryopreservation (see for examples [12,13,19]).
Related Work
Viscosity of various polymers, glasses, and chemical compounds has been extensively measured using a variety of techniques. Different techniques, several of which are mentioned here, are limited to certain ranges of viscosity and temperature, with the following examples. Falling sphere viscometry [20-22] is very limited in the magnitude of viscosity that can be directly measured. Rotating-disk viscometry [23,24] can measure viscosities of up to 1012 Pa-s, but the temperature range of the systems used is limited [23]. While high viscosities can also be measured with a three-point bend test at low temperatures [21,25], the required shaped specimen may not be easy to fabricate. In the so-called “sandwich method” [23] a specimen is bonded onto two parallel plates. One plate is stationary, while the other plate is subjected to a constant load and the resulting displacement is monitored. While high viscosities can be measured with the application of the sandwich method, a specimen must be fabricated at temperatures near glass transition. In penetrometry, an incompressible probe is driven into the test material under a constant load while the resulting displacement is recorded as a function of time. While reasonably high viscosities can be measured with the application of penetrometry (in the range of 108 to 1011 Pa-s), this technique has not been applied below -70°C [25]. The technique presented in the current paper shares some similarities with the sandwich method and penetrometry. It allows the measurement of viscosities on the order of 1011 Pa-s at temperatures lower than -100°C, and it is applicable to a material that cannot be shaped into a solid-like specimen.
Experimental Setup
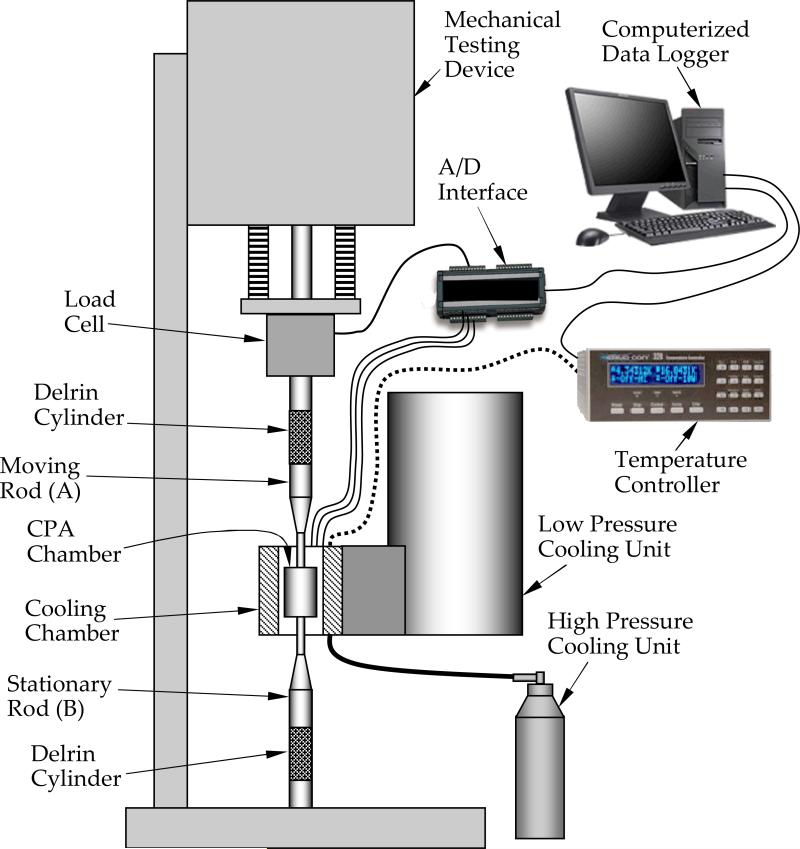
With reference to Fig. 1, the experimental apparatus can be conveniently described as consisting of two systems: a thermal system and a mechanical testing system. The objective of the thermal system is to rapidly cool the specimen under conditions typical of vitrification, and to maintain its temperature constant during the mechanical test (a single experimental run may take up to several hours). The thermal system has been designed recently for a series of studies on thermal expansion of vitrified blood vessels [5,6], stress-strain behavior of vitrified blood vessels [18], and stress relaxation in vitrified blood vessels [16]. The thermal system is presented here in brief only, for the completeness of presentation.
Figure 1.
Schematic illustration of the experimental system
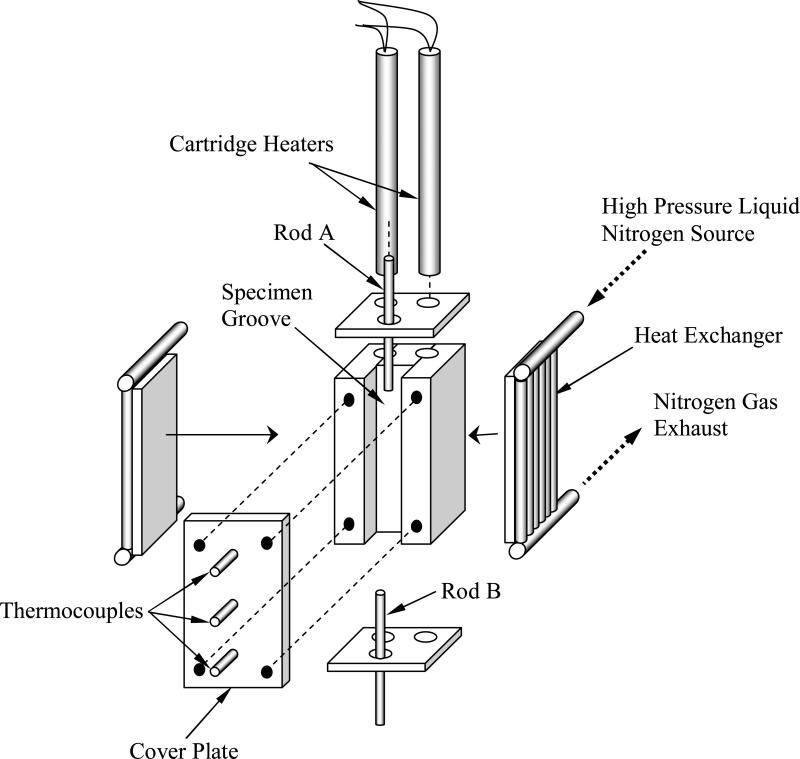
In general, thermal control is achieved by creating a constant heat sink, by means of liquid nitrogen cooling, and compensating the cooling power with electrical heaters embedded in the cooling chamber (see also Fig. 2). Two units are used for cooling: a low pressure unit, to maintain a constant cryogenic testing temperature, and a high pressure unit, for initial rapid cooling. The low pressure unit is essentially a liquid nitrogen container at standard atmospheric pressure, with an extended beam to conduct heat from the cooling chamber to the boiling liquid nitrogen. Two identical cartridge-electrical heaters (Gaumer, model A301-125) are embedded in the cooling chamber, at the end of the extended beam. The cartridge heaters are connected in parallel to a temperature controller and power supplier in one unit (Cryo-Con Model 32). A thermocouple is connected to the cooling chamber to provide feedback to the control system; this thermocouple is located between the electrical heaters (not shown in Fig. 2). The high pressure unit consists of a two-liter nitrogen container, pressurized to 30 psi with compressed air, and a pair of tube array heat exchangers, connected onto both sides of the cooling chamber (Fig. 2). The high pressure cooling unit is operated manually, while the low pressure cooling unit is operated continually in a temperature-control mode. A series of three T-type thermocouples is placed on the cover plate of the cooling chamber arrayed in the axial direction relative to the CPA chamber as illustrated in Fig. 3; the inclusion of these thermocouples is the only modification of the previously reported thermal system needed to measure the temperature in the CPA chamber.
Figure 2.
Schematic illustration of cooling chamber assembly
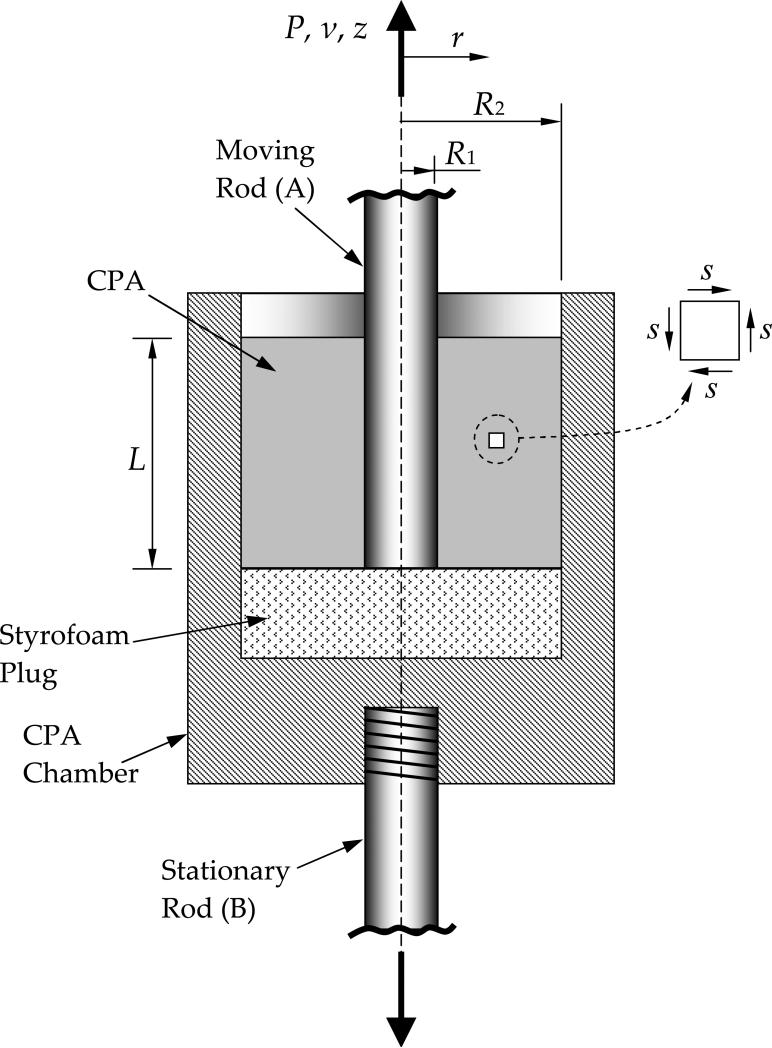
Figure 3.
Schematic illustration of the CPA chamber (not drawn to scale)
The mechanical testing device (eXpert 1KN-12-M with extended load range; Admet, Inc.) has been modified by the manufacturer for the purpose of this series of studies [5,6,16,18]. The sample (CPA) is contained in the CPA chamber, as illustrated in Fig. 3. Moving Rod A (R1=1 mm in Fig. 3) is immersed in the sample to a depth L (typically 25 mm) at one end, and is connected to a load cell (either Futek LSB300: 220N or Futek LSB302: 1332 N, depending on operation conditions) at the other end. By contrast with previous studies, rods A and B, comprise three cylindrical sections. Two of the three sections are made of stainless steel, while an intermediate section is made of delrin, which thermally insulates the sample from its surroundings (thermal conductivity of less than 1 W/m-K).
Temperature data is logged continually by means of a USB-based analog to digital (A/D) converter and multiplexer in one unit (OMEGA, OMB-DAQ 55, 0.015% uncertainty, 22 bit conversion), which is connected to the same computer used for mechanical system control (Fig. 1). Temperature data collected from the thermal system includes the control variable, the three thermocouples on the cooling chamber cover plate (Fig. 2), and the temperatures along Rods A and B, above and below the delrin section. The mechanical testing device is controlled by the computer, via an RS232 port, where load and displacement data are also logged throughout experimentation. The actual mechanical testing is performed by extracting Rod A at a constant velocity from the CPA sample; data analysis based on the load versus time results is described below in the data analysis section.
Materials Tested
The current study includes viscosity measurements of a reference solution of 7.05M DMSO, and of the cryoprotectant cocktails DP6 and VS55. In general, DMSO is one of the most widely used CPAs, and one of the better characterized CPAs in terms of physical properties. DP6 and VS55 are cocktails which have drawn significant attention in recent years. DP6 is a cocktail of 234.4 DMSO (3M), 228.3 propylene glycol (3M), and 2.4 HEPES in EuroCollins solution. VS55 is a cocktail of 242.14 DMSO (3.1M), 168.38 propylene glycol (2.2M), 139.56 formamide (3.1M), and 2.4 HEPES in EuroCollins solution. The two cocktails are similar, excepting the exclusion of formamide from DP6. In return, the DP6 contains a higher concentration of propylene glycol. The reference 7.05M DMSO solution contains the same overall mass of solutes as in the cocktail of VS55; 7.05M DMSO and VS55 were found to have similar thermal expansion in previous studies [4], but 7.05M DMSO has a much higher tendency to vitrify at comparable cooling rates. The mixtures of DP6 and VS55 were prepared by Organ Recovery Systems, Inc. The 7.05M DMSO solution was prepared at the Biothermal Technology Laboratory at Carnegie Mellon University.
Data Analysis
With reference to Fig. 3, the deforming CPA occupies an annular region within the CPA chamber; it is subject to zero velocity on the outer surface, and to a constant axial velocity at its inner surface equal to the velocity of the moving rod, vo. Since the fluid domain is long compared to the annular thickness (typical ratio of 25 to 1), the r-z shear stresses (see inset in Fig. 3) and the associated strains are expected to dominate; they are expected to vary only in the radial direction, leading to an essentially one-dimensional strain distribution. Since the moving rod and CPA rest on a styrofoam plug, having negligible mechanical strength, the load transmitted through the bottom of the sample is assumed to be negligible. There is likewise negligible load transmitted through the upper surface of the annular region, which is exposed to atmospheric pressure. Given the high viscosities typical of glass transition that are of interest here and the low velocities, gravitational forces, as well as inertial forces, are negligible compared to viscous forces. Under these conditions, the upward vertical force exerted by the rod is fully balanced by the downward force at the outer radius. For the simple Couette flow in the annular region, the axial load must be balanced by the average shear stress acting over the cylindrical surface located at any radius r. Hence, the variation of the shear stress, s, with radial position can be calculated as the load divided by the cylindrical surface area:
| (1) |
where P is the axial force, r is the radial position, and L is the embedded length. (The negative sign is consistent with the standard definition for the shear stress, and will be consistent with the relation between velocity and strain-rate.)
A simple Maxwell fluid model, consisting of linear elastic and viscous elements in series, is used to interpret experimental data; the applicability of this model is taken up in the discussion section below. The relation between stress and strain-rate, , for a Maxwell fluid has the form [26,27]:
| (2) |
where η is the viscosity, G is the shear modulus, and ṡ denotes the time derivative of the stress. The relationship between the strain rate and the local axial velocity, v, is;
| (3) |
Combining Eqs. (1), (2), and (3) yields:
| (4) |
Equation (4) is integrated with respect to r from inner radius, R1, where v equals vo, to the outer radius, R2, where the velocity is zero; integration yields:
| (5) |
Equation (5) is a first order differential equation for P as a function of time, which is subject to the initial condition of zero axial force; integration leads to an exponential function of time:
| (6) |
For long times, the force approaches a steady state value, PSS , from which the viscosity can be inferred:
| (7) |
In order to verify the 1D solution presented above, finite element calculations were also conducted on the full 2D (axi-symmetric) flow field, using the actual dimensions of the specimen, and assuming linear material response and small displacements. The load versus displacement relation at Rod A was found to be within 1% of the above 1D solution, which validates the underlying zero-end effect approximation used for the proposed data analysis. This close agreement would hold assuming linear-elastic, linear-viscous (Newtonian), and Maxwell-fluid models, the latter fitting the data very closely as shown below. Furthermore, given the low strain rate and the low strain associated with the flow, any additional non-Newtonian response of the fluid, which is unrevealed by this experiment, is unlikely to produce enhanced end effects.
Results and Discussion
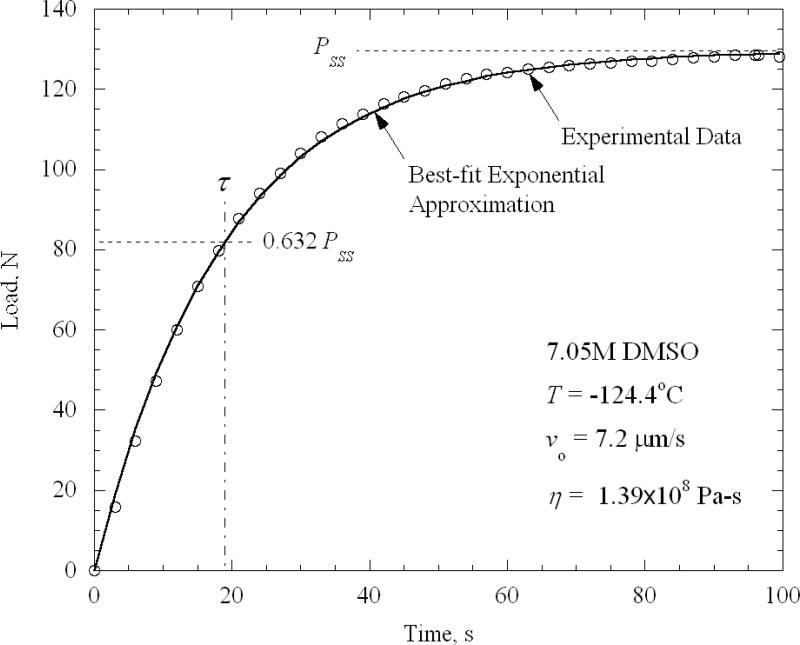
The loading history of a typical experiment for 7.05M DMSO is displayed in Fig. 4. This experiment corresponds to an average temperature in the cup of -124.4°C, and a velocity, vo, of 7.2×10⁻⁶ m/s. Also displayed in Fig. 4 is the best-fit curve, Eq. (6), in which the best-fit parameters Pss and τ have been substituted. The viscosity is extracted from these parameters using Eq. (7). Preliminary experiments were conducted to determine the effect of velocity. The axial force was found to be essentially proportional to the velocity, signaling a strain-rate-independent viscosity, typical of low strain rates. (Moreover, for each experiment the average strain rate was found to be less than 1/τ—the ratio ranging from less than 0.1 to a maximum of 0.3—signaling a low strain-rate regime.) The same response of linear load increase followed by asymptotic approach to a constant value developed even for the lowest velocities, suggesting no yielding effects, such as are captured by a Bingham plastic, for example. Given the consistently close fit of Eq. (6) with experimental data, a more complex model than Maxwell fluid is deemed unwarranted to explain this particular class of flow. The non-Newtonian character of the fluid, as revealed by these experiments, is thus confined to linear elasticity superposed on a Newtonian-viscous response, as given by a Maxwell-fluid model.
Figure 4.
Load history for a typical experiment on 7.05M DMSO at -124.4°C.
In total, 33, 18, and 23 constant velocity experiments were performed on DMSO, VS55, and DP6, respectively. Due to the wide range of viscosity values measured, spanning over two orders of magnitude, the corresponding duration of experiments ranged from 60 seconds to 4.8 hours. Due to limitations of the mechanical testing setup, the load was limited to 850 N. For experiments run within a few degrees of the glass transition temperature, the steady load would have been reached well above this upper load limit, even at the slowest operable speed (10-7 m/s). Therefore, different experiments were terminated at varying points along the curve to steady state. The duration range of experiments is summarized in Table 1, where the total time of each experiment is normalized by the best-fit time constant, τ; nearly all experiments were conducted for a period of at least one time constant. As could be expected from the increase of viscosity with decreasing temperature, the duration of experiments relative to their time constants increases as the temperature increases. The ranges of the coefficient of determination, R2, from all parametric estimations are also listed in Table 1. Very good agreement is found between the measured load versus time and the exponential function of time, Eq. (6); this agreement supports modeling the CPA as an ideal Maxwell fluid. Uncertainty analysis for a single experimental run is presented in Appendix A, corresponding, for example, to the mismatch between experimental data and best-fit results in Fig. 4.
Table 1.
Summary of Parametric Estimation Data
| 7.05 M DMSO | VS55 | DP6 | ||||
|---|---|---|---|---|---|---|
| Min. | Max. | Min. | Max. | Min. | Max. | |
| Duration range of experiments measured in time constants, τ | 0.94 | 5.31 | 1.59 | 5.52 | 1.56 | 11.34 |
| Coefficient of determination range, R2 | 0.9959 | 0.9999 | 0.9950 | 0.9997 | 0.9953 | 0.9997 |
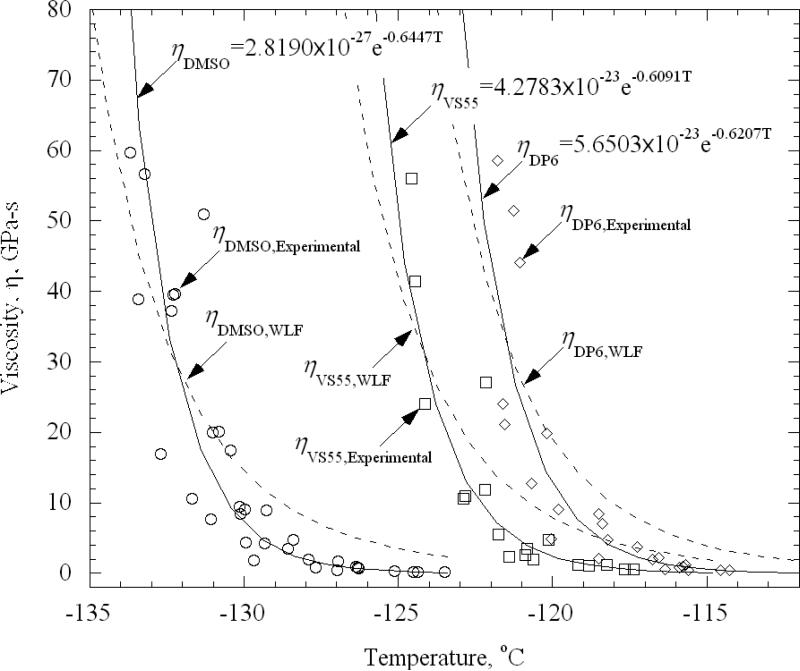
The viscosity as a function of temperature from all experiments is displayed in Fig. 5, where a rapid increase of viscosity with decreasing temperature is observed towards the glass transition temperature. Several models for the behavior of viscosity as a function of temperature have been investigated, where the best-fit results were obtained with a simple exponential model:
| (8) |
where ηo and b are best-fit parameters; the fitted curves are also displayed in Fig. 5.
Figure 5.
Experimental results and best-fit approximation for viscosity assuming an exponential variation of viscosity with temperature, Eq. 8, and with the WLF model, Eq. (9).
Another viscosity model of interest is the modified Williams-Landel-Ferry model (WLF) [28]:
| (9) |
where ηA is a reference viscosity and c1, c2, and T0 are the corresponding model parameters. Several approaches may be used to fit the WLF model parameters [29], out of which the best results were obtained by setting c1 = 17.44 K, c2 = 51.6 K, and T0 as the glass transition temperature [29]. Here, the glass transition temperature was based on the DSC measurements. In another best-fit effort (not displayed) T0 was selected as the glass transition temperature as defined, in conjunction with the best-fit of Eq. (8), as the temperature at which the viscosity reaches a value of 1012 Pa-s; this exercise did not yield better results. While both fits (e.g., the exponential and the WLF) might be acceptable, the simple exponential appears to better represent the trend displayed by experimental data (note that the coefficient of agreement R2 is a poor measure of comparison on a semi-log scale, where the weight of mismatch is shifted towards the upper viscosity values, making disagreements at lower viscosity values less significant). Not surprisingly, given the relatively narrow range of temperatures tested, more than one model can fit the data reasonably well. Perhaps if data were obtained over a larger temperature range, the more conventional WLF model would be superior, but this would be out of the measurement range of the current experimental apparatus.
The mismatch between compiled experimental data from different experimental runs and the best-fit displayed in Fig. 5 is associated with additional sources of uncertainty to the one presented in Appendix A, which is associated with repeatability in experimentation. Since the viscosity is an exponential function of temperature, one of the factors that most affects repeatability is temperature uncertainty between independent experiments (for example, difference in temperature set-point after restarting the system at a later date), as opposed to uncertainty between different measurements in a specific experimental run. For DMSO, for example, an uncertainty temperature range of ±0.8 K (Appendix A) between different experiments at the same nominal temperature corresponds to a change in viscosity in a range of ±60%, or a factor of 4 between the range values of +0.8 K and -0.8 K (note that 1 out of 20 measurements is likely to exceed this range). Other effects are also likely to affect the repeatability, such as the degree of temperature uniformity within the fluid domain. This suggests the need to perform multiple experiments and base the analysis on the best-fit approximation.
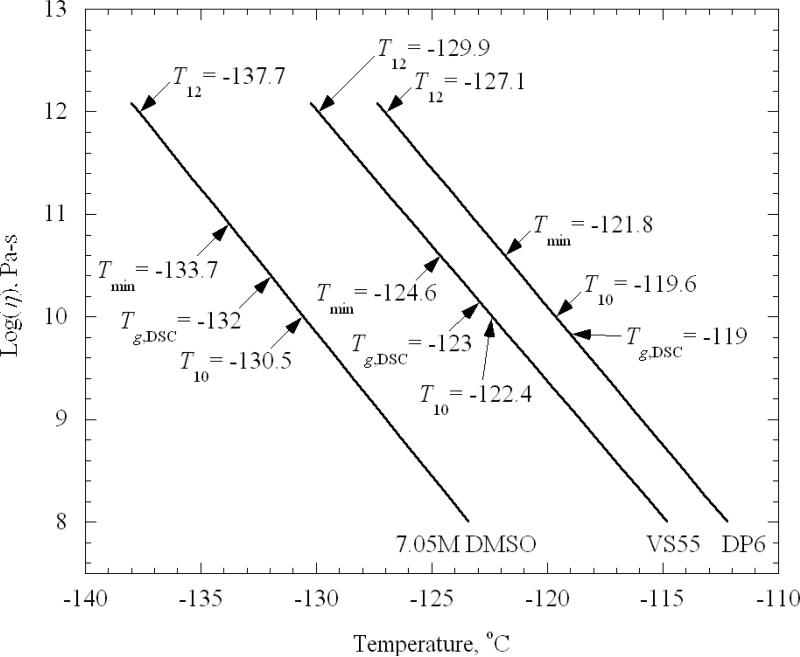
Figure 6 displays the viscosity dependency upon temperature on a semi-logarithmic scale, based on the best-fit exponential approximations presented in Fig. 5. Also shown in Fig. 6 are several temperature points relevant to the current discussion: T12 denotes the temperature at which the viscosity extrapolates to a value of 1012 Pa-s, a common definition of the glass transition temperature [29]; Tmin denotes the lowest temperature at which experimental data were obtained for that CPA; Tg,DSC denotes the glass transition temperature measured by differential scanning calorimetry, corresponding to the peak overshoot during heating [4,30] (for other definitions see Ref. [31]); and, T10 denotes the temperature at which the viscosity reaches a value of 1010 Pa-s.
Figure 6.
Best-fit results for viscosity as a function of temperature, where T12 denotes the temperature at which the viscosity extrapolates to a value of 1012 Pa-s, Tmin denotes the lowest temperature at which experimental data were obtained for that CPA, Tg,DSC denotes the glass transition temperature measured by differential scanning calorimetry (corresponding to the peak overshoot during rewarming), and T10 denotes the temperature at which the viscosity reaches a value of 1010 Pa-s.
From the best-fitted experimental results in Fig. 6 and the specified temperatures, the following observations can be made:
The minimum temperature achieved during experimentation was from 1.6K to 2.8K lower than the Tg,DSC..
The viscosity value at Tg,DSC is found to be two orders of magnitude lower than the 1012 Pa-s value [28]. The temperature difference been these two viscosity levels is in the range of 5.7K (7.05M DMSO) to 8.1K (DP6).
Given an estimated uncertainty in temperature measurements of 0.8K, Tg,DSC is very close to the temperature at which the viscosity value reached 1010 Pa-s on the best-fitted curves (1.5K, 0.6K, and 0.4K for 7.05M DMSO, VS55, and DP6, respectively).
In order to put these observations into context, one must bear in mind that the glass transition occurs over a range of temperatures [32]. For glycerol, for example, this transition occurs over a 9K range [12], and for CPA cocktails combining DMSO with Polyethylene Glycol a range of 8K was found [13]. Given that Tg,DSC, obtained from the overshoot peak temperature during rewarming (corresponding to the upper end of the transition), the temperature at which the measured viscosity extrapolates to 1012 Pa-s appears to be within the transition range. Previous analyses of stress development during cryopreservation [11,14,15] had extrapolated viscosity from high temperatures and assumed that the viscosity equals 1012 Pa-s at the measured Tg,DSC. Now, with direct measurements of viscosity at the low temperatures reported here, stress analyses can take advantage of more reliable data on viscosity versus temperature and its rate of change.
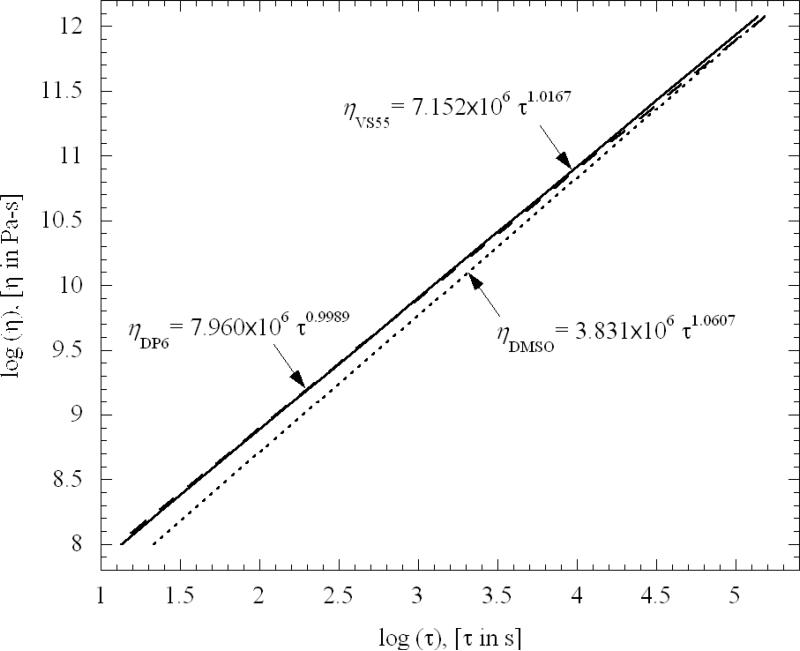
The procedure of fitting the measured load versus time to the exponential function of time, Eq. (6), leads to best-fit values for both viscosity and relaxation time. The relaxation time was also found to increase rapidly with decreasing temperature. Figure 7 displays the relationship between the viscosity and the relaxation time, on a log-log scale; each viscosity value is paired with the relaxation constant at the same temperature. It can be seen from Fig. 7 that the viscosity is virtually proportional to the relaxation time. The proportionality is nearly the same for the three curves—in the range of 3.8 to 8 MPa. For a perfect Maxwell fluid, that is a Weichert model with one elastic and one viscous element, this proportionality would be the elastic shear modulus of the fluid. The true shear modulus of fluids such as those studied here is expected to be on the order of 1 GPa in the glassy state. Not surprisingly, the present experiments--with relatively low strain rates, on order of 10-4 s-1—probably capture only the response corresponding to the longest time constant. With this low strain rate, all other contributions to the Weichert model would have fully relaxed near the beginning of the experiments.
Figure 7.
Best-fit relationship between viscosity and relaxation time, suggesting that the shear modulus of the Maxwell fluid model is constant over the experimental temperature range for all three CPAs.
Conclusions
Vitrification is currently one of the most promising techniques for cryopreserving biological tissues. In vitrification, the natural fluids are replaced with CPA, which remain in an arrested liquid state when rapidly cooled, avoiding the detrimental effects of crystal formation. In sufficiently bulky tissues, cooling rates that are necessary to ensure vitrification can often lead to substantial temperature gradients, stress development, and structural damage in the form of fractures. The process of stress development depends upon a number of process and material parameters, including the rate at which viscosity increases with decreasing temperature. The current study seeks to provide data previously unavailable on the viscosity of CPA in the relevant temperature range as the glass transition temperature is approached.
The experimental setup features a cup containing CPA, from which an embedded rod is slowly extracted. The temperature control system cools the sample sufficiently rapidly to ensure vitrification, while maintaining a constant test temperature thereafter. The rod is extracted at constant velocity and the force on the rod is measured as a function of time. An essentially one dimensional analysis of the flow during experimentation is appropriate due to the elongated shape of the annular fluid region. The observed time history of force fits very well the predictions of a Maxwell fluid model, from which a steady viscosity and a relaxation time are extracted.
Viscosities over the range from 109 Pa-s to 1011 Pa-s were measured for three CPAs of interest. The viscosity as a function of temperature was well fitted by an exponential function of temperature. As one measure of the glass transition temperature, the viscosity-temperature fit is extrapolated to1012 Pa-s. The resulting temperature is plausibly in the range of glass transition, approximately 6K to 8K below the upper end of the glass transition range obtained from DSC measurements of the overshoot-peak temperature during rewarming. The relaxation time for all fluids was found to be proportional to their viscosity over the corresponding temperature range, with a nearly constant proportionality in the range of 3.8 to 8 MPa (depending on the CPA), interpretable as the shear modulus G of the Maxwell fluid model. Finding a shear modulus that is nearly three orders of magnitude less than the expected glassy value suggests that relaxation processes with much shorter time constants are not captured by these low strain-rate tests (10-4 s-1). On the other hand, low strain rates are expected to be pertinent to cryopreservation, given the modest cooling rates of typical protocols, particularly as glass transition is approached (typically 0.1K per minute).
Acknowledgements
This study has been supported in part by National Institute of Health (NIH), grant number R01HL069944.
Appendix A. Uncertainty analysis
Following standard practice [16], the uncertainty in this procedure is estimated as:
| (A1) |
where xi are the independent variables. In the current study, the independent sources of uncertainty are the observed steady-state load, Pss, the outer radius of the stainless steel rod and inner radius of the brass sample cup, R1 and R2, respectively, the length of the stainless steel rod submerged in CPA, L, and the velocity that the rod is extracted, vo, which is translated to a strain rate.
Uncertainty in load cell measurement is caused by nonlinearity (±0.05% of full scale), hysteresis (±0.05% of full scale), non-repeatability (±0.05% of full scale), and temperature shift (±0.0014%/°C of actual load). Uncertainty in radii measurement is estimated as 0.01 mm. Uncertainty in L originates from the uncertainty in the CPA volume injected into the CPA chamber; an uncertainty of 0.29 mm is estimated when using a 1 mL syringe. Another source of uncertainty in L is the gradual extraction of the upper rod from the CPA, which may be as much as 2.5 mm over the duration of the experiment.
Uncertainty in temperature measurements is introduced by A/D conversion (22 bits at 0.333Hz) in the data acquisition module, cold-junction compensation, and the quality of the thermocouple material. The combined effect of these uncertainties is estimated as ±0.8°C.
Uncertainty was calculated for each experiment based on Eq. (A.1) and the above data. Uncertainty in viscosity calculations based on experimental data ranged from 2.9 and 8.4% in 7.05 M DMSO experiments, between 2.3 and 10.8% in VS55 experiments, and between 3.6 and 11.1% in DP6 experiments.
References
- 1.Luyet BJ. The vitrification of organic colloids and of protoplasm. Biodynamica. 1937;1(29):1–14. [Google Scholar]
- 2.Song YC, Khirabadi BS, Lightfoot FG, Brockbank KGM, Taylor MJ. Vitreous cryopreservation maintains the function of vascular grafts. Nature Biotechnology. 2000;18:296–299. doi: 10.1038/73737. [DOI] [PubMed] [Google Scholar]
- 3.Taylor MJ, Song YC, Brockbank KGM. Vitrification in tissue preservation: new developments. In: Fuller BJ, Lane N, Benson EE, editors. Life in the Frozen State. CRC Press; New York: 2004. pp. 603–641. [Google Scholar]
- 4.Plitz J, Rabin Y, Walsh JR. The effect of thermal expansion of ingredients on the cocktails VS55 and DP6. Cell Preservation Technology. 2004;2(3):215–226. [Google Scholar]
- 5.Jimenez-Rios JL, Rabin Y. Thermal Expansion of blood vessels in low cryogenic temperatures Part I: A new experimental device. Cryobiology. 2006;52:269–283. doi: 10.1016/j.cryobiol.2005.12.005. [DOI] [PMC free article] [PubMed] [Google Scholar]
- 6.Jimenez Rios JL, Rabin Y. Thermal Expansion of blood vessels in low cryogenic temperatures, Part II: Vitrification with VS55, DP6, and 7.05 M DMSO. Cryobiology. 2006;52:284–294. doi: 10.1016/j.cryobiol.2005.12.006. [DOI] [PMC free article] [PubMed] [Google Scholar]
- 7.Rabin Y, Bell E. Thermal expansion measurements of cryoprotective agents. Part I: A new experimental apparatus. Cryobiology. 2003;46:254–263. doi: 10.1016/s0011-2240(03)00042-7. [DOI] [PubMed] [Google Scholar]
- 8.Rabin Y, Bell E. Thermal expansion measurements of cryoprotective agents. Part II: measurements of DP6 and VS55, and comparison with DMSO. Cryobiology. 2003;46:264–270. doi: 10.1016/s0011-2240(03)00041-5. [DOI] [PubMed] [Google Scholar]
- 9.Rabin Y, Plitz J. Thermal expansion of blood vessels and muscle specimens permeated with DMSO, DP6, and VS55 at cryogenic temperatures. Annals of Biomedical Engineering. 2005;33:1213–1228. doi: 10.1007/s10439-005-5364-0. [DOI] [PubMed] [Google Scholar]
- 10.Rabin Y, Steif PS. Solid mechanics aspect of cryobiology. In: Baust JG, Baust JM, editors. Advances in Biopreservation. CRC Taylor & Francis; Boca Raton: 2006. pp. 359–382. Chap. 13. [Google Scholar]
- 11.Rabin Y, Steif PS, Hess KC, Jimenez-Rios JL, Palastro MC. Fracture formation in vitrified thin films of cryoprotectants. Cryobiology. 2006;53:75–95. doi: 10.1016/j.cryobiol.2006.03.013. [DOI] [PMC free article] [PubMed] [Google Scholar]
- 12.Angell CA. Liquid Fragility and the Glass Transition in Water and Aqueous Solutions. Chem. Rev. 2002;102:2627–2650. doi: 10.1021/cr000689q. [DOI] [PubMed] [Google Scholar]
- 13.Brockbank KGM, Walsh JR, Song YC, Taylor MJ. Vitrification: preservation of cellular implants. In: Ashammakhi N, Ferretti P, editors. Topics in Tissue Engineering. 2003. Chapter 12. [Google Scholar]
- 14.Steif PS, Palastro MC, Rabin Y. The effect of temperature gradients on stress development during cryopreservation via vitrification. Cell Preservation Technology. 2007;5(2):104–115. doi: 10.1089/cpt.2007.9994. [DOI] [PMC free article] [PubMed] [Google Scholar]
- 15.Steif PS, Palastro MC, Rabin Y. Continuum mechanics analysis of fracture progression in the vitrified cryoprotective agent DP6. ASME Biomechanical Engineering. 2008;130(2):021006. doi: 10.1115/1.2898716. [DOI] [PMC free article] [PubMed] [Google Scholar]
- 16.Jimenez-Rios JL, Steif PS, Rabin, Y. Y. Stress-strain measurements and viscoelastic response of blood vessels cryopreserved by vitrification. Annals of Biomedical Engineering. 2007;35(12):2077–2086. doi: 10.1007/s10439-007-9372-0. [DOI] [PMC free article] [PubMed] [Google Scholar]
- 17.Steif PS, Palastro MC, Rabin Y. Analysis of the effect of partial vitrification on stress development in cryopreserved blood vessels. Medical Engineering & Physics. 2006;29(6):661–670. doi: 10.1016/j.medengphy.2006.07.010. [DOI] [PMC free article] [PubMed] [Google Scholar]
- 18.Jimenez-Rios JL, Rabin Y. A new device for mechanical testing of blood vessels at cryogenic temperatures. Journal of Experimental Mechanics. 2007;47:337–346. doi: 10.1007/s11340-007-9038-8. [DOI] [PMC free article] [PubMed] [Google Scholar]
- 19.Angell CA, Fan J, Liu C, Lu Q, Sanchez E, Xu K. Li-conducting ionic rubbers for lithium battery and other applications. Solid State Ionics. 1994;69:343–353. [Google Scholar]
- 20.Schichman SA, Amey RL. Viscosity and local liquid structure in dimethyl sulfoxide-water mixtures. The Journal of Physical Chemistry. 1971;75:98–102. [Google Scholar]
- 21.Laughlin WT, Uhlmann DR. Viscous flow in simple organic liquids. The Journal of Physical Chemistry. 1972;29(16):2317–2325. [Google Scholar]
- 22.Miner CS, Dalton NN. Glycerol. Reinhold; New York: 1953. [Google Scholar]
- 23.Hiki Y, Kobayashi H, Takahashi H. Shear viscosity of inorganic glasses and polymers. Journal of Alloys and Compounds. 2000;310:378–381. [Google Scholar]
- 24.Plazek DJ, Bero CA, Chay I-C. The recoverable compliance of amorphous materials. Journal of Non-Crystalline Solids. 1994;172-174:181–190. [Google Scholar]
- 25.McLin MG, Angell CA. Viscosity of salt-in-polymer solutions near the glass transition temperature by penetrometry, and pseudo-macromolecule behaviour at a critical composition in NaClO4 – PPO (4000) Polymer. 1996;37(21):4713–4721. [Google Scholar]
- 26.Aklonis J, MacKnight W, Mitchel S. Introduction to Polymer Viscoelasticity. Wiley & Sons; New York: 1972. p. 249. [Google Scholar]
- 27.Ward IM. Mechanical Properties of Solid Polymers. Wily & Songs; New York: 1971. p. 475. [Google Scholar]
- 28.Williams ML, Landel RF, Ferry JD. The Temperature Dependence of Relaxation Mechanisms in Amorphous Polymers and Other Glass-forming Liquids. Journal of American Chemical Society. 1955;77:3701–3707. [Google Scholar]
- 29.Byrd RB, Curtiss CF, Armstrong RC, Hassager O. Dynamics of Polymeric Liquids. 2nd Edition John Wiley and Sons; 1989. [Google Scholar]
- 30.Mehl P. Nucleation and crystal growth in a vitrification solution tested for organ cryopreservation by vitrification. Cryobiology. 1993;30:509–518. doi: 10.1006/cryo.1993.1051. [DOI] [PubMed] [Google Scholar]
- 31.Rabin Y, Taylor MJ, Walsh JR, Baicu S, Steif PS. Cryomacroscopy of vitrification, Part I: A prototype and experimental observations on the cocktails VS55 and DP6. Cell Preservation Technology. 2005;3(3):169–183. doi: 10.1089/cpt.2005.3.169. [DOI] [PMC free article] [PubMed] [Google Scholar]
- 32.Angell CA. The old problems of glass and the glass transition, and the many new twists. Proc. Natl. Acad. Sci. 1995;92:6675–6682. doi: 10.1073/pnas.92.15.6675. [DOI] [PMC free article] [PubMed] [Google Scholar]


