Abstract
Magnetic resonance histology (MRH) has become a valuable tool in evaluating drug-induced toxicity in preclinical models. However, its application in renal injury has been limited. This study tested the hypothesis that MRH could detect image-based biomarkers of chronic disease, inflammation, or age-related degeneration in the kidney, laying the foundation for more extensive use in evaluating drug toxicity. We examined the entire intact kidney in a spontaneous model of chronic progressive nephropathy. Kidneys from male Sprague Dawley rats were imaged at 8 weeks (n=4) and 52 weeks (n=4) on a 9.4T system dedicated to MR microscopy. Several potential contrast mechanisms were explored to optimize the scanning protocols. Full coverage of the entire kidney was achieved with isotropic spatial resolution at 31 microns (voxel volume=30 pL) using a gradient recalled echo sequence. Isotropic spatial resolution of 15 microns (voxel volume<4 pL) was achieved in a biopsy core specimen. Qualitative age-related structural changes, such as renal cortical microvasculature, tubular dilation, interstitial fibrosis, and glomerular architecture, were apparent. The nondestructive 3D images allowed measurement of quantitative differences of kidney volume, pelvis volume, main vessel volume, glomerular size, as well as thickness of the cortex, outer medulla, and inner medulla.
INTRODUCTION
This study explored the potential of magnetic resonance histology (MRH) as a feasible tool to assess structural changes of the entire kidney in 3 dimensions. The kidney is a particularly critical organ because of its vulnerability to drug-induced nephrotoxicity. Furthermore, the recent use of chronic disease models (such as for cardiac insufficiency) to screen for toxicity (Knoll et al., 2007; Robert, 2007) necessitates a method to document pre-existing disease to compare to post-treatment endpoints. The goal of this study was to analyze in rats chronic progressive nephropathy (CPN), which is a spontaneous model of chronic kidney disease (CKD), using MRH to define the baseline changes that can be seen with this methodology. Establishment of the imaging protocol and analysis parameters of young and aged kidneys can provide a background against which nephrotoxicity-associated lesions can be evaluated in future studies.
Numerous studies have examined structural and physiological changes that occur in the kidney with aging, including loss of renal cortical microvasculature, arteriosclerosis (thickening of arterial walls), glomerulosclerosis (expansion of the mesangial extracellular matrix with eventual compression and obliteration of glomerular capillary loops), interstitial fibrosis, and tubular atrophy (Schaefer et al., 1994; Ruiz-Torres et al., 1998; Baylis, 2005). Glomeruli increased in diameter with advancing age (Johnson and Cutler, 1980), while the number of functioning glomeruli decreased with age (Tauchi et al., 1971; McLachlan, 1978; Goyal, 1982; Tan et al., 2009). Compared to the medullary regions, the cortex was preferentially affected by age-related changes (Tauchi et al., 1971; Lindeman and Goldman, 1986). Additionally, while vascular rarefaction is often most marked in the cortical interstitium, remodeling of the vasa rectae and vascular bundles has also been reported (Woolf et al., 2009). Although histological and ultrastructural evaluation of age-related morphological changes provides considerable useful data, all these studies have been hindered by their two-dimensional approach. Specifically, these studies examined the kidney in a limited field of view and depth of penetration on planar sections, which generally have undergone significant shrinkage and distortion from fixation.
Studies using MRI, such as structural and spectroscopic imaging, have been used to examine renal anatomy (Farmer et al., 1989; Racz et al., 2002; Bendel et al., 2005). For example, studies have investigated ureteral obstruction, inflammatory response of kidney macrophages, and renal toxicity models using bromoethylamine and mercuric chloride (Farmer et al., 1989; Chevalier, 2008; Hedlund et al., 1991; Williams et al., 2007). In addition, kidney specimens have also been assessed at high magnetic fields, including a study by Sarkar et al. (Sarkar et al., 1988) at 100×100×700 μm3 (7 nL) on a 9.4 T system, and Beeman et al. (Beeman et al., 2011) at 62×62×78 μm3 (300 pL) on a 19 T system. However, these studies were limited in resolution and signal-to-noise ratio (SNR).
This study used MRH to provide three-dimensional microscopic images to complement traditional histology. MRH allows one to assess the entire organ nondestructively in three dimensions, and exploit contrast dependent on the water in the tissue (Johnson et al., 1993; MacKenzie-Graham et al., 2004; Benveniste et al., 2000). Several novel applications of MRH in pathology and toxicology have provided quantitative assessments of tissue structures (Johnson et al., 2011; Lester et al., 1999; Maronpot et al., 2004). In this study, MRH was employed to evaluate age-associated changes from 4 young 8-week-old kidneys to 4 aged 52-week-old kidneys of Sprague Dawley rats. MRH provided quantitative measures of kidney volume, pelvis volume, main vessel volume, glomerular size, as well as thickness of the cortex, outer medulla, and inner medulla. Protocols were optimized to allow segmentation and visualization of the main vessels in the kidney, segmentation of the pelvis, and isolation of the glomeruli.
MATERIALS AND METHODS
Biological Support
All animal studies were performed at the Duke Center for In Vivo Microscopy (CIVM) and were approved by the Duke Institutional Animal Use and Care Committee, which adheres to the NIH Guide for the Care and Use of Laboratory Animals. Kidneys from 4 young (8-week-old) and 4 old (52-week-old) male Sprague Dawley rats (SAS-SD rats, Charles River, Raleigh, NC) were imaged. All animals were well hydrated prior to any procedure. Briefly, the rats were anesthetized and maintained on inhalant anesthesia. A midline abdominal incision was made and a catheter was inserted into the heart. Conventional transcardiac perfusion fixation was used with inflow to the left ventricle and outflow from the right atrium. Each rat was perfused with a saline flush followed by a solution of 50 mM Magnevist contrast agent (Bayer HealthCare Pharmaceuticals, Wayne, NJ) dissolved in 10% formalin. Both the saline and Magnevist solution were perfused at a rate of 20 mL/minute for 5 minutes using a microsyringe pump (780200 Dual Channel Syringe Pump, KD Scientific Inc., Holliston, MA). Magnevist was used as the active stain to decrease the T1 relaxation (Johnson et al., 2002). The renal artery, renal vein, and ureter were ligated, and the kidney was excised. The kidney was stored in 2.5 mM Magnevist and 10% formalin for 24 hours before imaging. From each animal, one kidney was used for imaging and the second was stored in 10% buffered formalin for histopathology. Thus, 8 kidneys were imaged and the 8 contralateral kidneys from the same animals were sectioned for pathology. Each kidney in its native form was fit loosely in an acrylic holder filled with fomblin (Ausimont USA, Inc., Thorofare, NJ) to limit susceptibility and tissue-air interface artifacts.
Histology
A pilot study revealed that the histological assessment of the kidney after the MRH technique was not optimal. Tissue preservation was poor; however, basic structures (glomeruli, tubules, and vessels) could be identified. Therefore, in order to best assess the type and severity of background disease, the non-imaged contralateral kidney from each rat was used for histology. Chronic progressive nephropathy of rats affects both kidneys; the presence of disease in one kidney is indicative of disease in the other. Kidneys that were used for conventional histology were stored in 10% formalin, processed routinely, embedded in paraffin, and sectioned at 5-μm thickness. Two sagittal sections, approximately 1 mm apart, were examined per kidney. Sections were stained with hematoxylin and eosin (H&E) and were evaluated by a board-certified veterinary pathologist (REC). Because the imaged tissue could be examined via histology to assess basic structures, the punch biopsy specimen was also processed for light microscopy, and approximately 80–100 serial 5-μm H&E sections of the biopsy were examined. These serial sections were digitally scanned using an Aperio digital slide scanner (ScanScope, Aperio Technologies, Inc., Vista, CA) for analysis.
Contrast Measurement and Pulse Sequence Selection
All MRH imaging was performed on a 9.4 T system (400 MHz vertical bore Oxford superconducting magnet) dedicated to MR microscopy (Johnson et al., 2007). The system consists of an 89-mm vertical bore (54-mm clear bore) superconducting magnet with maximum gradient amplitudes of 2000 mT/m (Resonance Research, Inc., Billerica, MA), and is controlled by a GE Signa console adapted for MR microscopy (Epic 12.4X, GE Medical Systems, Milwaukee, WI). An 18-mm diameter x 36-mm long quadrature RF coil (m2m Imaging Corp., Cleveland, OH) was used.
Data were analyzed using MATLAB (MathWorks Inc., Natick, MA). Visualization and volume-rendering of the data were accomplished using a combination of ImageJ <http://rsbweb.nih.gov/ij/>, Avizo (Visualization Sciences Group, Burlington, MA), and Vitrea (Vital Images, Inc., Minnetonka, MN). The Student’s t-test was used to test for equal means between the two age groups. P values < 0.05 were considered significant.
Initial studies were designed to find the optimal contrast and contrast-to-noise ratio (CNR) between the pelvis and the surrounding tissues. Contrast measurements were performed on relatively low-resolution images (30×30×15 mm3 field of view, 256×256×128 matrix, isotropic resolution of 117×117×117 μm3 [1.6 nL], and 62.5kHz bandwidth) to save time. Three imaging sequences were explored on one specimen from each group of rats (8-weeks-old and 52-weeks-old). T1-weighted images were acquired using a spin echo sequence with TR=50 ms, TE=9.3 ms. T2-weighted images were generated using a Carr Purcell Meiboom Gill (CPMG) sequence with TR=200 ms, 8 echoes, and inter-echo spacing of 5.5 ms. The data were post-processed by performing a Fourier Transform along the echo direction. The multi-echo Fourier encoding process has been described by Sharief et al. (Sharief and Johnson, 2006). The first echo (TR=200, TE=5.5 ms) of the CPMG sequence was used as a proton density-weighted image. T2*-weighted images were acquired using a gradient echo sequence with a TR=50 ms, TE=6.5 ms, and 60° flip angle. The contrast and CNR measurements suggested that T1- and T2*-weighted images would provide the best results. Thus, all 8 specimens were scanned to produce T1- and T2*-weighted images at considerably higher spatial resolution yielding isotropic resolution of 31×31×31 μm3 [30 pL] (field of view of 32×32×16 mm3, 1024×1024×512 matrix). The T1-weighted spin echo sequence used TR=50 ms, TE= 9.3 ms. The T2*-weighted gradient echo sequence used TR=50 ms, TE=6.5 ms, flip angle=60°. The biopsy specimens were imaged at the highest resolution (15×15×15 μm3 using the T1-weighted spin echo (TR/TE=50/9.3 ms). The dynamic range was extended using a segmented acquisition to enhance the high frequencies of Fourier Space (Johnson et al., 2007).
Biopsy Core Sections
After the whole kidneys (4 young and 4 aged) were imaged, a 3-mm ×5-mm biopsy core was taken from one young and one aged specimen to image at higher resolution and quantify glomerular volumes. The punch was taken dorsoventrally to cover repeating patterns of the kidney in the cortex and some of the medulla. This core was placed in a 6-mm tube and imaged in a 6.5-mm solenoid RF coil on the 9.4 T MR system. T1-weighted images were collected with a matrix of 512×512×512 over an 8×8×8 mm3 field of view, yielding isotropic resolution of 15×15×15 μm3 (3.8 pL).
RESULTS
Initial Analysis
Data for these studies are available via our method to share information with the scientific community, CIVMSpace <http://www.civm.duhs.duke.edu/lx201107/index.html>. Four potential sources of contrast were explored: 1) spin-lattice relaxation (T1), 2) spin-spin relaxation (T2), 3) proton density (PD), and 4) susceptibility-induced decay (T2*). These four volumetric datasets (T1, T2, PD, and T2* shown in Figure 1B–E) were used to evaluate the best contrast and contrast-to-noise ratio (CNR) of the pelvis and surrounding tissues. The contrast was calculated as the ratio of the signal difference to the signal sum in Eq. [1] and the CNR was calculated as the ratio of the difference between two signal intensities to the standard deviation of background noise floor in Eq [2].
Figure 1.

A) The regions of interest (ROIs) for the pelvis (PV), inner medulla (IM), outer medulla (OM), cortex (CO), and background noise (BG) are shown. (A) T1-weighted spin echo image TR=50 ms; (B) TE=9.3 ms. (C) T2-weighted image. (D) Proton density (PD) image. (E) T2*-weighted image.
| [1] |
| [2] |
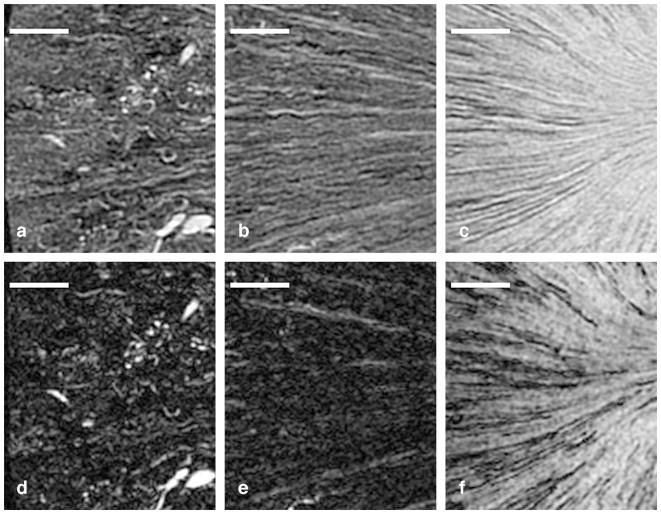
The contrast and CNR were determined between the pelvis and the neighboring regions (Figure 1A), pelvis and cortex, pelvis and outer medulla, and pelvis and inner medulla. The highest contrast and CNR between the pelvis and all other regions were seen in the T2* images (Figure 2A and 2B), so T2*-weighted images were used to segment the pelvis. In higher-resolution images, considerable signal loss was noted from magnetic susceptibility effects in smaller structures, e.g., vessels, renal region boundaries, glomeruli, and kidney boundaries (Figure 3). Thus, T1-weighted spin echo images were used to analyze structures other than the pelvis (Figures 5 and 6). Comparison between T1- and T2*-weighted images acquired at higher resolution (31×31×31 μm3 = 31 pL) is shown in Figure 3. Limited signal comes from fibrotic regions in the T1-weighted images (Figure 3A–C). The T2* images also show low signal in these regions, but signal dropout also occurs in many other smaller structures (vessels, region boundaries, and glomeruli) (Figure 3D–F). In particular, Figure 3A clearly shows outlines of arterioles and glomeruli, but these outlines are less evident in Figure 3D. Tubules (Figure 3B) and collecting ducts (Figure 3C) can be seen, but the T2* image (Figure 3E–F) shows more dropouts. Large structures, such as the pelvis, were relatively immune to susceptibility-induced signal dropout. Thus, T2*-weighted images were useful for segmenting the pelvis, and T1-weighted images were better for following smaller anatomic structures.
Figure 2.
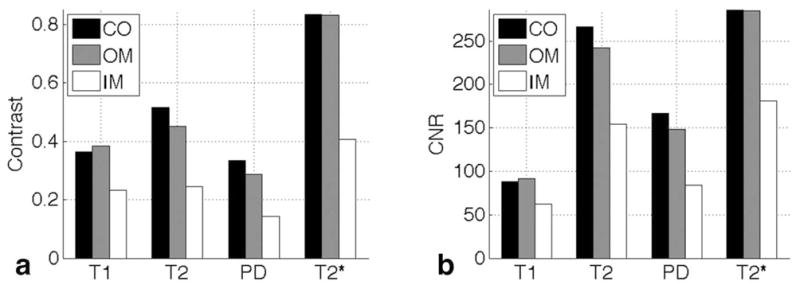
The contrast in (A) and contrast-to-noise ratio in (B) of the pelvis compared with the three kidney regions (CO), outer medulla (OM), and inner medulla (IM)(CO, OM, and IM) with all 4 image types.
Figure 3.
Comparison of T1-weighted images (A–C) and T2*-weighted images (D–F) in three regions in an aged kidney. Structure is seen in all three regions in the T1-weighted images, including the cortex with glomeruli and arterioles in (A), the outer medulla with tubules in (B), and the inner medulla with collecting ducts in (C). However, there is significant signal dropout in the T2*-weighted images in the glomeruli (D), the tubule bundles in the outer medulla (E), and the collecting ducts in the inner medulla (F). Scale bars = 1 mm.
Figure 5.
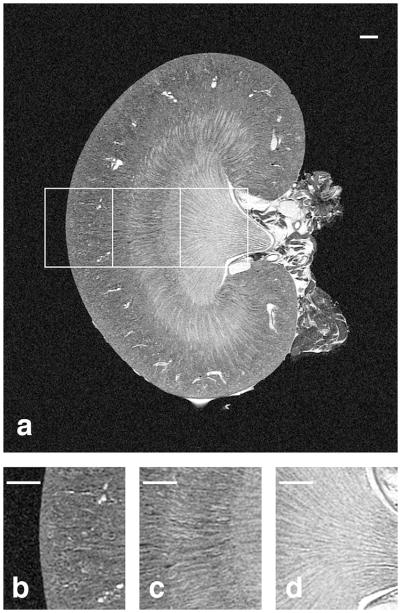
The coronal slice from a T1-weighted volume of an 8-week old kidney is shown in (A) with magnified regions shown in (B–D). The cortex with numerous glomeruli and arterioles can be seen in (B), the stripes of the outer medulla with tubules can be seen in (C), and the inner medulla with collecting ducts and the renal calyx can be seen in (D). Scale bars = 1 mm.
Figure 6.
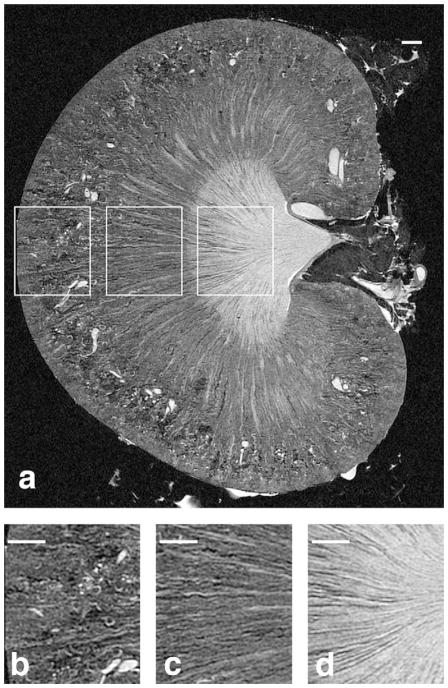
The coronal slice from a T1-weighted volume of a 52-week old kidney is shown in (A) with magnified regions shown in (B–D). Fewer, enlarged glomeruli and arterioles can be seen in (B) compared to the younger kidney, there are more spaces in the tubules of the outer medulla (C), and the collecting ducts in (D) are less densely packed in the aged kidney. Scale bars = 1 mm.
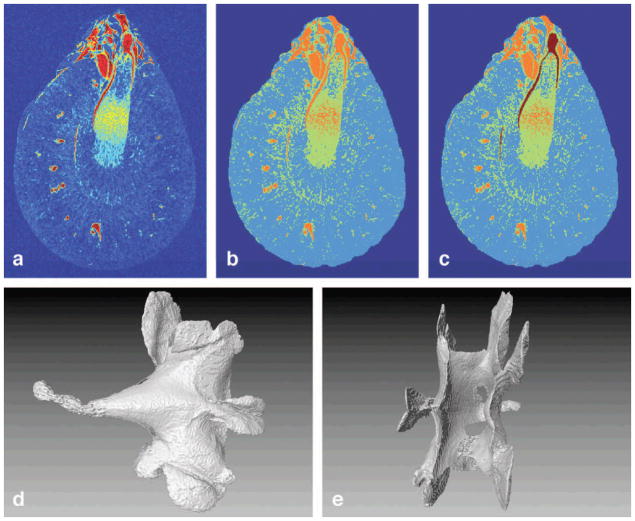
The pelvis was segmented using the T2* images (Figure 4) using a K-mean clustering algorithm that partitions data into disjoint subsets by minimizing the sum of squares of each data point value to the centroid of each cluster (Hartigan, 1979; Bishop, 1995; Ibanez, 2003; Agrawal et al., 2005). K-means clustering has been used previously in clinical MRI to segment tissue (Dimitriadou et al., 2004; Docquier et al., 2009; Shi et al., 2005; Shi et al., 2011). First, background noise outside of the kidney was removed by thresholding (Figure 4A–B). Next, voxels from the isolated kidney were grouped into 3 clusters (Figure 4B)—the first, highest-intensity cluster represented major vessels and pelvis. The second cluster, median-intensity cluster represented vessel walls and tubules. The third, lowest-intensity cluster represented kidney parenchyma. The pelvis was almost completely isolated from other high-intensity data points and was easily segmented by using a single seed region-growing algorithm (Figure 4C). Volume renderings of the isolated pelvis are shown in Figure 4D and 4E.
Figure 4.
(A) An axial slice with a colormap. Thresholding was used to remove the background and the clustering algorithm was used to differentiate three distinct signals (B). (C) The high-contrast pelvis was an isolated structure in the cluster with the highest intensity and was easily segmented. (D) and (E) Volume renderings of the segmented pelvis from two different angles.
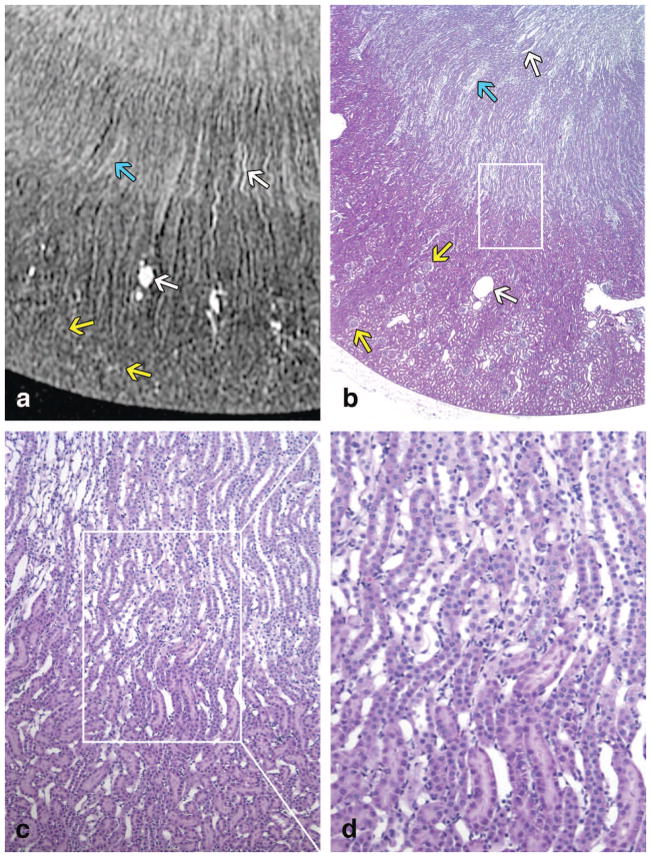
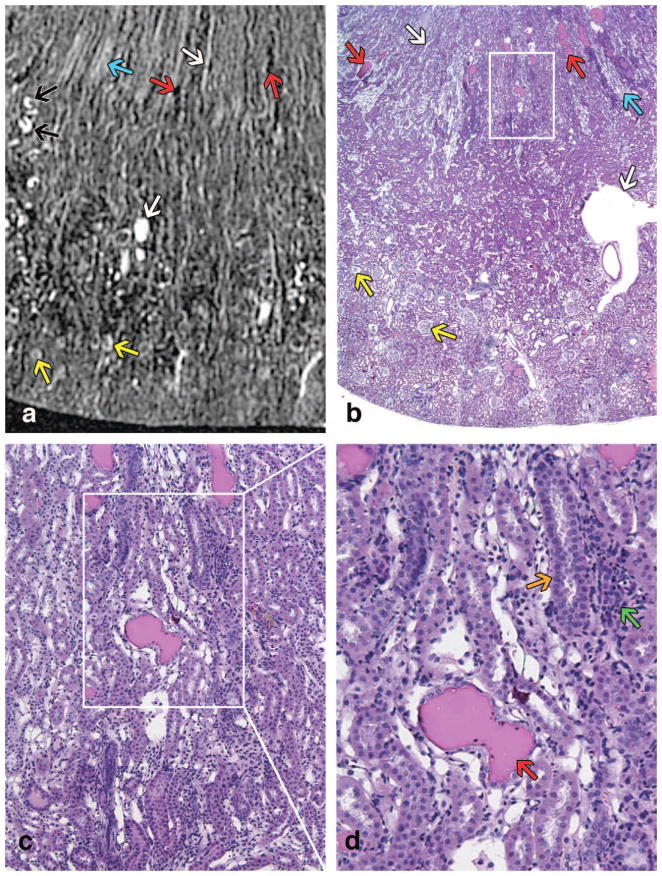
Age-associated remodeling can be seen in coronal sections from 3D T1 images of the young (Figure 5) and old specimens (Figure 6). Three regions are compared in Figures 5A and 6A. The glomeruli in the younger rat (Figure 5B) were smaller and more densely packed than those of the older rat (Figure 6B). The aged rat kidney had a more heterogeneous MRH architecture, with large regions of lower signal often radiating from the outer medulla to the cortex (Figure 6). This MRH change was consistent with the pattern of tubular dilation and atrophy with concurrent interstitial fibrosis commonly seen in aged rats (; Tauchi et al., 1971; Haley and Bulger, 1983; Thomas et al., 1998). The young kidney did not exhibit significant structural abnormalities (Figure 5). Of note, the signal loss was predominant in the cortical regions of the aged kidney. Mild fibrosis was also present in the outer and inner medullary regions (Figure 6A, 6C, 6D).
Histological sections of the contralateral kidney confirm these findings and are directly compared with MRH images in the young kidney (Figure 7) and in the old kidney (Figure 8). Vessels, capillary bundles, and glomeruli are indicated with color specific arrows in both figures. All three regions, (cortex, outer medulla [OM], and inner medulla [IM]) of the kidney were observed in the young specimen and both the inner and outer stripes of the outer medulla were visible (Figure 7A–B). Because the old kidney is larger, only the cortex and outer medulla can be seen in these images (Figure 8A–B). The inner and outer stripes of the OM were indistinct in the old specimens. Additionally, dilated tubules with protein casts were found in the aged kidney, which are indicated with red arrows in Figure 8A, 8B, 8D. Dilated tubules without protein casts are noted with black arrows in Figure 8A. These identified structures were confirmed by their 3D size and location in the entire MRH dataset. Tubular basophilia (regeneration) and foci of interstitial inflammation are noted via histology (Figure 8D). Glomeruli in older rats were multifocally sclerotic and obsolescent. These tubulointerstitial and glomerular lesions, indicative of chronic progressive nephropathy of rats, were not present in the young kidney. Of note, contrast-filled vascular spaces were difficult to distinguish from contrast-filled tubules on a single 2D MRH image. Therefore, these structures were tracked and confirmed in the volumetric space, and hence, the 3D nature of MRH was essential for proper interpretation of architecture.
Figure 7.
A T1-weighted image of a young specimen is shown in (A). Similar regions of the kidney are shown in a histology slice (H&E) of a contralateral kidney in (B) with magnified regions shown in (C–D). (B), (C), and (D) are taken at 20x, 100x, and 200x, respectively. The CO, outer stripe of the OM, inner stripe of the OM, and the IM can be seen in both (A) and (B). In each (A) and (B), there is one white arrow pointing at a vessel in the OM, one white arrow pointing at a vein in the CO, one blue arrow pointing at vascular bundles (vasa rectae) in the OM, and two yellow arrows pointing at glomeruli.
Figure 8.
A T1-weighted image of an old specimen is shown in (A). Similar regions of the kidney are shown in a histology slice (H&E) of a contralateral kidney in (B) with magnified regions in (C–D). All 4 images are at the same magnification as the respective images of the young kidney in Figure 7. Only the CO and a portion of the OM can be seen in both (A) and (B) because the older kidney is larger. In each (A) and (B), there is one white arrow pointing at a vessel in the OM, one white arrow pointing at a vein in the CO, one blue arrow pointing at vasa rectae in the OM, two yellow arrows pointing at glomeruli, and two red arrows pointing at dilated tubules with protein casts. In (A), there are additional black arrows pointing to dilated tubules without protein casts. A 200x histology slice in (D) includes a red arrow pointing at a protein cast inside a dilated tubule, an orange arrow pointing at tubular basophilia (regeneration), and a green arrow pointing at foci of interstitial inflammation.
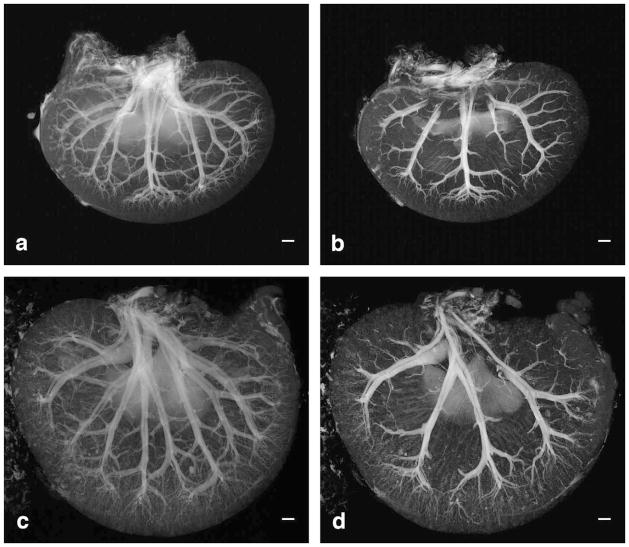
Vascular branching can be visualized in the young (Figure 9A) and aged kidneys (Figure 9C) shown in the standard deviation intensity projection (SDIP) images. SDIPs map 3D datasets into a plane by projecting the standard deviation along the third dimension. SDIPs can enhance structures with high contrast and intensity, while maintaining differential signal of overlapping structures. This differential signal effect on the overlapping arteries and veins can be seen in Figure 9A and 9C. The small arteries in the cortical regions are more clearly defined in the young kidney than the aged kidney. The older specimen shows lower contrast between vessels and background tissue, because the standard deviation is higher in the parenchyma. This may be related to the larger heterogeneity in the older specimen due to interstitial fibrosis, degenerative and atrophied tubules, and inflammatory cell infiltrates. The main arteries and veins are separable as they traverse the kidney, and the veins are thinner-walled and larger in diameter than the arteries.
Figure 9.
Standard deviation intensity projections (SDIP) are taken from 9.4-mm slabs that cover almost the entire thickness of the young (A) and aged kidney (C). SDIPs are taken from 2.5-mm slabs that cover one ventral side of the young (B) and aged kidney (D). Scale bars = 1 mm.
Glomeruli Measurements
A 3D Hough Transform was used to segment the glomeruli. Traditionally, the Hough Transform is used to detect linear edges in a 2D image (Duda, 1972), but a similar technique can be used to detect circular edges (Kimme et al., 1975) or spherical edges in 3D volume data. The technique for this study was based on a 2D circular Hough Transform implemented by Peng et al. (Peng et al., 2007), which was extended into 3D volume to search for spheres. The algorithm uses the spatial gradient as an edge detector, and operates similarly to a traditional Hough Transform. However, instead of using parameters for a line with radius and angle, the algorithm uses parameters of radius of a sphere and coordinates for the sphere center. The additional dimension and parameters increased the operation’s complexity and thus, initial measurements were taken to limit the range of the parameters and simplify the operation. First, the algorithm found the coordinates of the spheres, and second, the radii of the spheres were measured. This allowed glomeruli first to be localized without knowing the exact size or radius of the glomeruli, as the coordinates and radii are independent parameters. Specifically, the first step detected locations of glomeruli with a small radius search range. The second step detected individual glomeruli with a larger radius search range, which maintained reasonable computational time and detection sensitivity. The detection strategy was complicated by the small size and irregularity of the glomeruli. Initially, false positives were filtered out automatically based on the mean and standard deviation of data points in the detected sphere, or based on the radial distribution of data point values in the sphere. The remaining false positives were filtered manually.
3D spherical analysis was essential in detecting the glomeruli accurately, as a slice-by-slice circular analysis using 2D Hough Transform would not be able to detect glomeruli (Figure 10). Mean glomeruli diameters were 152 ± 25 μm for the young kidney and 177 ± 23 μm for the aged kidney. Both the young and the aged kidney diameter distributions, thus the volumetric distributions, were normal using the Jarque-Bera test (p≪0.01). The Jarque-Bera is used to test against the null hypothesis that the volume distributions come from Gaussian distributions. The two datasets were determined to be independent random samples from normal distributions with mean values that were not equal (p≪0.01). Thus the glomeruli volume, assuming a spherical shape, increased significantly with age. Histologic evaluation of 80–100 serial sections of the core biopsy specimen revealed mild multifocal segmental glomerulosclerosis in the older rat and normal glomeruli in the younger one. Additionally, small foci of interstitial fibrosis and inflammation, which were associated with tubular dilation, were present in the older rat whereas the tubulointerstitium was normal in the young rat.
Figure 10.
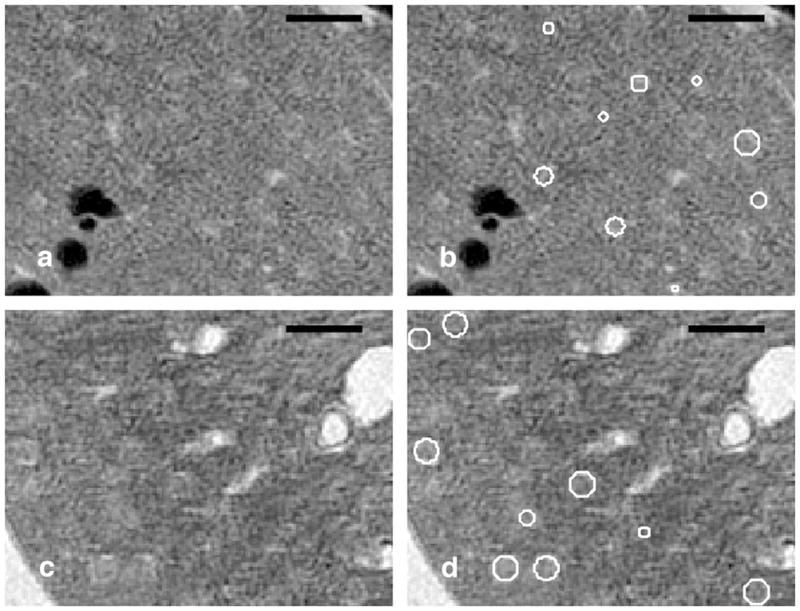
These images demonstrate the robustness of the detection of glomeruli using the 3D spherical Hough Transform that a 2D slice-by-slice analysis would not detect. A 15-μm slice from the 8-week old kidney is shown in (A) with the overlay of the detected glomeruli in B). A 15-μm slice from the 52-week old kidney is shown in (C) with the overlay of the detected glomeruli (D). Scale bars = 500 μm.
Previous studies have also measured diameters of the glomeruli using scanning electron microscope (SEM) and transmission electron microscope (TEM) images (Johnson and Cutler, 1980; Haley and Bulger, 1983). However, these studies were limited because measurements were taken manually on 2D histology slices. The technique for this study quantifies the glomeruli in 3D, a capability inherent in magnetic resonance histology. Detection of the glomeruli was validated using optical sections (H&E) that were generated from the same tissue. Figure 11 shows a sample slice of a 52-week biopsy section. Figure 11A shows a 5-μm histological slice. MR images were registered to the optical section using vascular landmarks. The glomeruli (green spherical regions overlaid on the MRH slice) indicated by white arrows (Figure 11C) correspond with the glomeruli indicated by black arrows on the histological slice (Figure 11A). The match between the optical and MR sections is not perfect, due in part to distortion in the H&E from dehydration and physical sectioning. Note that additional glomeruli are shown on Figure 11C, but these are not indicated by the white arrows. These glomeruli are above the displayed slice in physical space and are included for visualization purposes only. Figure 11D shows the rendered vessels and all glomeruli in the 3D space above the displayed slice.
Figure 11.

Images of a renal biopsy from a 52-week old kidney. A 5-μm optical section of the cortex sliced dorsoventrally is shown in (A). A 15-μm slice from the 3D MR section has been registered to the histologic section using vascular landmarks (B). Volume-rendered glomeruli are overlaid on top of the MRH slice (C). A slice 15 μm above the visible slice is selected to display glomeruli that are both on the slice and above the immediately visible slice. The glomeruli indicated by the white arrows in (C) correspond to the glomeruli indicated in the histology slice by black arrows in (A). All glomeruli above the displayed slice and rendered vessels protruding from the slice are shown in (D).
Analysis and Rendering
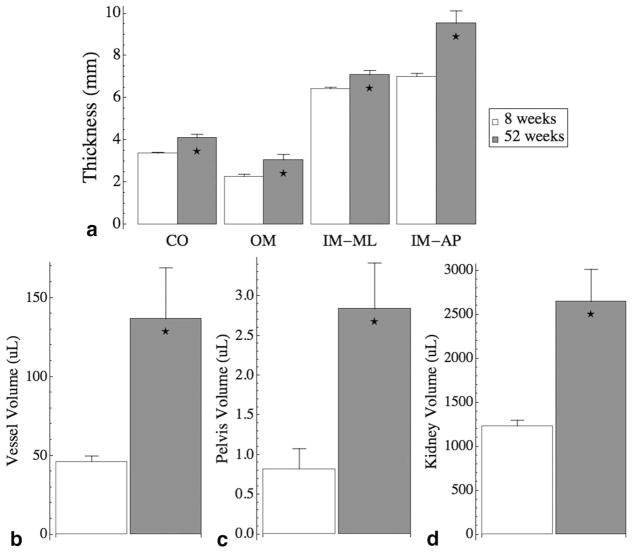
Kidney volume was determined by simple thresholding segmentation. The pelvis and major vessel volumes were determined by k-means clustering, and the thickness of the renal regions were measured manually from coronal slices. Both the cortex and the outer medulla were measured radially for 5 measurements around the kidney on each slice for a total of 11 slices through the dataset, which formed a 3D sector of the kidney. The thickness of the inner medulla was measured in one mediolateral direction and in one anteroposterior direction on each slice, for a total of 11 slices. These structures all significantly increased with age from 8 weeks (n=4) to 52 weeks (n=4) (Figure 12). The thickness of the cortex increased from 3.37 ± 0.048 mm to 4.11 ± 0.158 mm (p<0.01), the outer medulla increased from 2.28 ± 0.106 mm to 3.06 ± 0.261 mm (p<0.05), the inner medulla measured mediolaterally increased from 6.43 ± 0.076 mm to 7.09 ± 0.207 mm (p<0.05), and the inner medulla measured anteroposteriorly increased from 7.01 ± 0.147 mm to 9.54 ± 0.581 mm (p<0.01) (Figure 12A). The major vessel volume increased from 46.1 ± 3.67 μL to 137 ± 32.3 μL (p<0.05) (Figure 12B). The pelvis volume increased from 0.822 ± 0.255 μL to 2.84 ± 0.577 μL (p<0.05) (Figure 12C), and the kidney volume increased from 1230 ± 67.0 μL to 2650 ± 366 μL (p<0.01) (Figure 12D). These increases corresponded with increase of body mass of 254 ± 13.6 g to 563 ± 18.7 g (p≪0.01). The errors listed here for each of the age groups are standard errors (n=4 for young kidneys and n=4 for aged kidneys).
Figure 12.
Measurements show structural changes from 8-week-old kidneys (n=4, white bars) to 52-week-old kidneys (n=4, gray bars). (A) The measured thicknesses of the cortex (CO), outer medulla (OM), inner medulla measured mediolaterally (IM-ML), and the inner medulla measured anteroposteriorly (IM-AP). (B) The major vessel volumes, (C) the pelvis volumes, and (D) the kidney volume. All structural changes are significant with age. Error bars represent standard error.
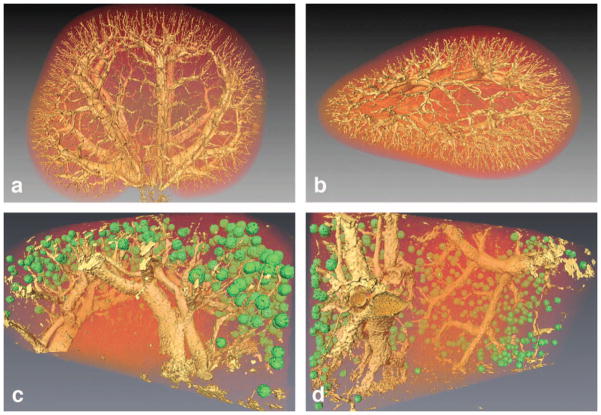
Figure 13 shows the 3D volume-rendered images of the entire 52-week-old aged kidney from two different angles (Figure 13A, 13B). The pelvis was isolated and removed from this volume-rendering using the k-means clustering described previously. Figure 13C and 13D show volume-rendered images from the biopsy core of the older specimen. The glomeruli isosurface was thresholded at 34% of the highest glomeruli intensity using a green colormap. The rest of the volume data was thresholded at 78% using a yellow-shaded isosurface. Both isosurfaces were overlaid on a volume texture of the entire kidney section using a red colorfield set at an alpha of 0.4. Interlobar veins and arteries traverse the kidney radially from the medulla to the corticomedulary junction where they bend and run perpendicularly as arcuate vessels. The locations of the glomeruli correspond well with the ends of the interlobular arteries towards the afferent arterioles (Figure 13C and 13D).
Figure 13.
Volume-rendered images of a 52-week-old kidney are shown in the coronal plane in (A) and in the axial plane in (B). Volume-rendered image of the isolated glomeruli from a biopsy core of an aged kidney are displayed in two orientations in (C) and (D). The green glomeruli and the yellow vessels are shaded triangulation isosurfaces that are overlaid on volume textures of the entire dataset.
DISCUSSION
Magnetic resonance histology (MRH) has been explored previously in a number of studies. To the best of our knowledge, this is the first demonstration of quantitative MRH to study renal injury. MRH has many appealing aspects such as surveying entire specimens, analyzing volumes, comparing volumetric ratios, and assessing 3D branching; however, MRH does not have the specificity or spatial resolution that is routinely obtained by optical sections. Alternatively, optical sectioning, staining, image acquisition, and volume reconstruction are not practical approaches to survey entire specimens. Optical imaging and MRH are fundamentally different, complementary approaches. The purpose of this project was to optimize a MRH protocol that would produce images comparable to histology as well as provide additional information, which cannot be obtained with traditional 2D image analysis. We have demonstrated here some of the unique attributes of MRH to quantitatively assess the age-related changes in architecture and identify lesions characteristic of chronic progressive nephropathy (CPN) of rats. By assessing multiple MRH imaging sequences, we determined that a T1 image is best for assessment of overall renal architecture and visualization of smaller structures, whereas a T2* image allows specific segmentation of high contrast regions. Because contrast material entered tubular lumens, it was occasionally difficult to distinguish contrast-filled vessels from contrast-filled dilated tubules on 2D images; nonetheless, these structures were identified and confirmed in the volume, which emphasize why 3D MRH of the entire specimen was essential in this study. The nondestructive nature of MRH has allowed quantitative measure of decreased intrarenal vasculature. Global qualitative features can also be evaluated including regional fibrosis and tissue inhomogeneity. However, these regions are dark and the exact origin of these signal voids is unknown. Further research is needed to evaluate these regions and one such possibility is a phase sensitive technique called susceptibility. Susceptibility imaging is quantitative and can determine whether the contents of these regions are more paramagnetic or diamagnetic (Li et al., 2011). Since the specimen remains intact, it was possible to make linear and volumetric measures in the whole organ without the errors induced by dehydration and physical sectioning. The biopsy core specimens imaged at 15-μm isotropic resolution are, we believe, the highest-resolution MR images ever obtained in the kidney. At this resolution, it now becomes possible to acquire three-dimensional stereologic images of glomerular size and distribution, a task that would be particularly challenging using conventional methods. While there is ongoing effort in our laboratory and elsewhere to further increase the spatial resolution and image quality, this work has established the foundation of MRH to obtain quantitative measurements in a feasible manner, with the hope that future enhancements of efficiency will allow high throughput screening, which can be used to measure safety effects in the renal system. Future experiments will be directed at obtaining similar quality MRI images in survival studies to allow tracking of disease progression. Additionally, survival studies will allow acquisition of baseline measurements of background kidney disease for use in the longitudinal assessment of nephrotoxicity in the setting of chronic renal insufficiency.
Acknowledgments
The authors wish to thank Sina Farsiu, Stephanie Chiu, Sally Gewalt, Brian Berridge, Laurence Hedlund, Samuel Johnston, and Sally Zimney for their discussions, contributions, and editorial assistance. All work was performed at the Duke Center for In Vivo Microscopy, an NCRR National Biomedical Technology Research Center (P41 RR005959), with additional funding from NCI U24 CA092656 and NIBIB T32 GM008555.
ABBREVIATIONS
- BG
Background
- CKD
Chronic Kidney Disease
- CNR
Contrast-to-Noise Ratio
- CO
Cortex
- CPMG
Carr Purcell Meiboom Gill
- CPN
Chronic Progressive Nephropathy
- ECM
Extracellular Matrix
- GBM
Glomerular Basement Membrane
- H&E
Hematoxylin and Eosin
- IM
Inner Medulla
- IM-AP
Inner Medulla Anteroposteriorly
- IM-ML
Inner Medulla Mediolaterally
- MR
Magnetic Resonance
- MRI
Magnetic Resonance Imaging
- MRH
Magnetic Resonance Histology
- OM
Outer Medulla
- PD
Proton Density
- PV
Pelvis
- RF
Radio Frequency
- ROI
Region of Interest
- SDIP
Standard Deviation Intensity Projection
- SEM
Scanning Electron Microscope
- TE
Echo Time
- TEM
Transmission Electron Microscope
- TR
Repetition Time
Footnotes
DECLARATION OF CONFLICT OF INTEREST OR FINANCIAL DISCLOSURES
None
References
- Agrawal R, Gehrke J, Gunopulos D, Raghavan P. Automatic subspace clustering of high dimensional data. Data Mining and Knowledge Discovery. 2005;11:5–33. [Google Scholar]
- Baylis C. Changes in renal hemodynamics and structure in the aging kidney; sexual dimorphism and the nitric oxide system. Exp Gerontol. 2005;40:271–278. doi: 10.1016/j.exger.2005.01.008. [DOI] [PMC free article] [PubMed] [Google Scholar]
- Beeman SC, Zhang M, Gubhaju L, Wu T, Bertram JF, Frakes DH, Cherry BR, Bennett KM. Measuring glomerular number and size in perfused kidneys using MRI. Am J Physiol Renal Physiol. 2011;300:F1454–1457. doi: 10.1152/ajprenal.00044.2011. [DOI] [PubMed] [Google Scholar]
- Bendel P, Margalit R, Koudinova N, Salomon Y. Noninvasive quantitative in vivo mapping and metabolism of boronophenylalanine (BPA) by nuclear magnetic resonance (NMR) spectroscopy and imaging. Radiat Res. 2005;164:680–687. doi: 10.1667/rr3450.1. [DOI] [PubMed] [Google Scholar]
- Benveniste H, Kim K, Zhang L, Johnson GA. Magnetic resonance microscopy of the C57BL mouse brain. Neuroimage. 2000;11:601–611. doi: 10.1006/nimg.2000.0567. [DOI] [PubMed] [Google Scholar]
- Bishop CM. Neural networks for pattern recognition. Clarendon Press; Oxford University Press; New York: 1995. [Google Scholar]
- Brandis A, Bianchi G, Reale E, Helmchen U, Kuhn K. Age-dependent glomerulosclerosis and proteinuria occurring in rats of the Milan normotensive strain and not in rats of the Milan hypertensive strain. Lab Invest. 1986;55:234–243. [PubMed] [Google Scholar]
- Chevalier RL. Chronic partial ureteral obstruction and the developing kidney. Pediatr Radiol. 2008;38(Suppl 1):S35–40. doi: 10.1007/s00247-007-0585-z. [DOI] [PubMed] [Google Scholar]
- Dimitriadou E, Barth M, Windischberger C, Hornik K, Moser E. A quantitative comparison of functional MRI cluster analysis. Artif Intell Med. 2004;31:57–71. doi: 10.1016/j.artmed.2004.01.010. [DOI] [PubMed] [Google Scholar]
- Docquier PL, Paul L, Menten R, Cartiaux O, Francq B, Banse X. Measurement of bone cyst fluid volume using k-means clustering. Magn Reson Imaging. 2009;27:1430–1439. doi: 10.1016/j.mri.2009.05.017. [DOI] [PubMed] [Google Scholar]
- Duda RDaHPE. Use of Hough transform to detect lines and curves in pictures. Communications of the ACM. 1972;15:11–15. [Google Scholar]
- Farmer THR, Johnson GA, Cofer GP, Maronpot RR, Dixon D, Hedlund LW. Implanted coil MR microscopy of renal pathology. Magnetic Resonance in Medicine. 1989;10:310–323. doi: 10.1002/mrm.1910100304. [DOI] [PubMed] [Google Scholar]
- Goyal VK. Changes with age in the human kidney. Exp Gerontol. 1982;17:321–331. doi: 10.1016/0531-5565(82)90032-8. [DOI] [PubMed] [Google Scholar]
- Haley DP, Bulger RE. The aging male rat: structure and function of the kidney. Am J Anat. 1983;167:1–13. doi: 10.1002/aja.1001670102. [DOI] [PubMed] [Google Scholar]
- Hartigan JaWM. A k-means clustering algorithm. Appl Stat. 1979;28:100–108. [Google Scholar]
- Hedlund LW, Maronpot RR, Johnson GA, Cofer GP, Mills GI, Wheeler CT. Magnetic resonance microscopy of toxic renal injury induced by bromoethylamine in rats. Fundamental Applied Toxicology. 1991;16:787–797. doi: 10.1016/0272-0590(91)90164-y. [DOI] [PubMed] [Google Scholar]
- Ibanez L, Schroeder W, Ng L, Cates J. The ITK Software Guide. Kitware, Inc; 2003. [Google Scholar]
- Johnson GA, Ali-Sharief A, Badea A, Brandenburg J, Cofer G, Fubara B, Gewalt S, Hedlund LW, Upchurch L. High-throughput morphologic phenotyping of the mouse brain with magnetic resonance histology. NeuroImage. 2007;37:82–89. doi: 10.1016/j.neuroimage.2007.05.013. [DOI] [PMC free article] [PubMed] [Google Scholar]
- Johnson GA, Badea A, Jiang Y. Quantitative neuromorphometry using magnetic resonance histology. Toxicol Pathol. 2011;39:85–91. doi: 10.1177/0192623310389622. [DOI] [PMC free article] [PubMed] [Google Scholar]
- Johnson GA, Benveniste H, Black RD, Hedlund LW, Maronpot RR, Smith BR. Histology by magnetic resonance microscopy. Magnetic Resonance Quarterly. 1993;9:1–30. [PubMed] [Google Scholar]
- Johnson GA, Cofer GP, Fubara B, Gewalt SL, Hedlund LW, Maronpot RR. Magnetic resonance histology for structural phenotyping. Journal of Magnetic Resonance Imaging. 2002;16:423–429. doi: 10.1002/jmri.10175. [DOI] [PubMed] [Google Scholar]
- Johnson JE, Jr, Cutler RG. Effects of hypophysectomy on age-related changes in the rat kidney glomerulus: observations by scanning and transmission electron microscopy. Mech Ageing Dev. 1980;13:63–74. doi: 10.1016/0047-6374(80)90130-x. [DOI] [PubMed] [Google Scholar]
- Kaplan C, Pasternack B, Shah H, Gallo G. Age-related incidence of sclerotic glomeruli in human kidneys. Am J Pathol. 1975;80:227–234. [PMC free article] [PubMed] [Google Scholar]
- Kimme C, Ballard D, Sklansky J. Finding Circles by an Array of Accumulators. Communications of the Acm. 1975;18:120–122. [Google Scholar]
- Knoll R, Postel R, Wang J, Kratzner R, Hennecke G, Vacaru AM, Vakeel P, Schubert C, Murthy K, Rana BK, Kube D, Knoll G, Schafer K, Hayashi T, Holm T, Kimura A, Schork N, Toliat MR, Nurnberg P, Schultheiss HP, Schaper W, Schaper J, Bos E, Den Hertog J, van Eeden FJ, Peters PJ, Hasenfuss G, Chien KR, Bakkers J. Laminin-alpha4 and integrin-linked kinase mutations cause human cardiomyopathy via simultaneous defects in cardiomyocytes and endothelial cells. Circulation. 2007;116:515–525. doi: 10.1161/CIRCULATIONAHA.107.689984. [DOI] [PubMed] [Google Scholar]
- Lester DS, Johannessen JN, Pine PS, McGregor GN, Johnson GA. Virtual neuropathology: A new approach to preclinical pathology using magnetic resonance imaging microscopy. Spectroscopy. 1999;14:17–22. [Google Scholar]
- Li W, Wu B, Liu C. Quantitative susceptibility mapping of human brain reflects spatial variation in tissue composition. NeuroImage. 2011;55:1645–1656. doi: 10.1016/j.neuroimage.2010.11.088. [DOI] [PMC free article] [PubMed] [Google Scholar]
- Lindeman RD, Goldman R. Anatomic and physiologic age changes in the kidney. Exp Gerontol. 1986;21:379–406. doi: 10.1016/0531-5565(86)90044-6. [DOI] [PubMed] [Google Scholar]
- MacKenzie-Graham A, Lee EF, Dinov ID, Bota M, Shattuck DW, Ruffins S, Yuan H, Konstantinidis F, Pitiot A, Ding Y, Hu G, Jacobs RE, Toga AW. A multimodal, multidimensional atlas of the C57BL/6J mouse brain. J Anat. 2004;204:93–102. doi: 10.1111/j.1469-7580.2004.00264.x. [DOI] [PMC free article] [PubMed] [Google Scholar]
- Maronpot RR, Sills RC, Johnson GA. Applications of magnetic resonance microscopy. Toxicologic Pathology. 2004;32:42–48. doi: 10.1080/01926230490451707. [DOI] [PubMed] [Google Scholar]
- McLachlan MS. The ageing kidney. Lancet. 1978;2:143–145. doi: 10.1016/s0140-6736(78)91522-2. [DOI] [PubMed] [Google Scholar]
- Outwater EK, Siegelman ES, Kim B, Chiowanich P, Blasbalg R, Kilger A. Ovarian Brenner tumors: MR imaging characteristics. Magn Reson Imaging. 1998;16:1147–1153. doi: 10.1016/s0730-725x(98)00136-2. [DOI] [PubMed] [Google Scholar]
- Outwater EK, Siegelman ES, Talerman A, Dunton C. Ovarian fibromas and cystadenofibromas: MRI features of the fibrous component. J Magn Reson Imaging. 1997;7:465–471. doi: 10.1002/jmri.1880070303. [DOI] [PubMed] [Google Scholar]
- Peng T, Balijepalli A, Gupta SK, LeBrun T. Algorithms for on-line monitoring of micro spheres in an optical tweezers-based assembly cell. Journal of Computing and Information Science in Engineering. 2007;7:330–338. [Google Scholar]
- Racz I, Tory K, Gallyas F, Jr, Berente Z, Osz E, Jaszlits L, Bernath S, Sumegi B, Rabloczky G, Literati-Nagy P. BGP-15 - a novel poly(ADP-ribose) polymerase inhibitor - protects against nephrotoxicity of cisplatin without compromising its antitumor activity. Biochem Pharmacol. 2002;63:1099–1111. doi: 10.1016/s0006-2952(01)00935-2. [DOI] [PubMed] [Google Scholar]
- Robert J. Preclinical assessment of anthracycline cardiotoxicity in laboratory animals: Predictiveness and pitfalls. Cell Biology and Toxicology. 2007;23:27–37. doi: 10.1007/s10565-006-0142-9. [DOI] [PubMed] [Google Scholar]
- Ruiz-Torres MP, Bosch RJ, O’Valle F, Del Moral RG, Ramirez C, Masseroli M, Perez-Caballero C, Iglesias MC, Rodriguez-Puyol M, Rodriguez-Puyol D. Age-related increase in expression of TGF-beta1 in the rat kidney: relationship to morphologic changes. J Am Soc Nephrol. 1998;9:782–791. doi: 10.1681/ASN.V95782. [DOI] [PubMed] [Google Scholar]
- Sarkar SK, Holland GA, Lenkinski RE, Mattingly MA, Kinter LB. Renal imaging studies at 1.5 and 9.4 T: effects of diuretics. Magn Reson Med. 1988;7:117–124. doi: 10.1002/mrm.1910070114. [DOI] [PubMed] [Google Scholar]
- Schaefer L, Teschner M, Ling H, Oldakowska U, Heidland A, Schaefer RM. The aging rat kidney displays low glomerular and tubular proteinase activities. Am J Kidney Dis. 1994;24:499–504. doi: 10.1016/s0272-6386(12)80908-5. [DOI] [PubMed] [Google Scholar]
- Sharief AA, Johnson GA. Enhanced T2 contrast for MR histology of the mouse brain. Magnetic Resonance in Medicine. 2006;56:717–725. doi: 10.1002/mrm.21026. [DOI] [PubMed] [Google Scholar]
- Shi L, Heng PA, Wong TT. Functional MRI activation detection using genetic K-means clustering. Proceedings of 2005 International Conference on Machine Learning and Cybernetics; 2005. pp. 1680–1685. [Google Scholar]
- Shi L, Wang D, Chu WC, Burwell GR, Wong TT, Heng PA, Cheng JC. Automatic MRI segmentation and morphoanatomy analysis of the vestibular system in adolescent idiopathic scoliosis. Neuroimage. 2011;54(Suppl 1):S180–188. doi: 10.1016/j.neuroimage.2010.04.002. [DOI] [PubMed] [Google Scholar]
- Tan JC, Workeneh B, Busque S, Blouch K, Derby G, Myers BD. Glomerular function, structure, and number in renal allografts from older deceased donors. J Am Soc Nephrol. 2009;20:181–188. doi: 10.1681/ASN.2008030306. [DOI] [PMC free article] [PubMed] [Google Scholar]
- Tauchi H, Tsuboi K, Okutomi J. Age changes in the human kidney of the different races. Gerontologia. 1971;17:87–97. doi: 10.1159/000211811. [DOI] [PubMed] [Google Scholar]
- Thomas SE, Anderson S, Gordon KL, Oyama TT, Shankland SJ, Johnson RJ. Tubulointerstitial disease in aging: evidence for underlying peritubular capillary damage, a potential role for renal ischemia. J Am Soc Nephrol. 1998;9:231–242. doi: 10.1681/ASN.V92231. [DOI] [PubMed] [Google Scholar]
- Troiano RN, Lazzarini KM, Scoutt LM, Lange RC, Flynn SD, McCarthy S. Fibroma and fibrothecoma of the ovary: MR imaging findings. Radiology. 1997;204:795–798. doi: 10.1148/radiology.204.3.9280262. [DOI] [PubMed] [Google Scholar]
- Wiggins RC, Wiggins JE, Goyal M, Sanden SK, Wharram BL, Shedden KA, Misek DE, Kuick RD. Podocyte hypertrophy, “adaptation,” and “decompensation” associated with glomerular enlargement and glomerulosclerosis in the aging rat: Prevention by calorie restriction. Journal of the American Society of Nephrology. 2005;16:2953–2966. doi: 10.1681/ASN.2005050488. [DOI] [PubMed] [Google Scholar]
- Williams JB, Ye Q, Hitchens TK, Kaufman CL, Ho C. MRI detection of macrophages labeled using micrometer-sized iron oxide particles. J Magn Reson Imaging. 2007;25:1210–1218. doi: 10.1002/jmri.20930. [DOI] [PubMed] [Google Scholar]
- Woolf AS, Gnudi L, Long DA. Roles of Angiopoietins in Kidney Development and Disease. Journal of the American Society of Nephrology. 2009;20:239–244. doi: 10.1681/ASN.2008020243. [DOI] [PubMed] [Google Scholar]
- Yagihashi S, Kaseda N. Age-Related-Changes of Glomerular Basement-Membrane in Normal Rats. Tohoku Journal of Experimental Medicine. 1978;126:27–49. doi: 10.1620/tjem.126.27. [DOI] [PubMed] [Google Scholar]


