

Abstract
Purpose
To describe the intraoperative use of handheld spectral domain optical coherence tomography (SDOCT) imaging in macular surgery.
Design
Prospective, observational case series.
Methods
A handheld SDOCT device was used to obtain preincision optical coherence tomography imaging in patients undergoing vitrectomy for macular diseases. After removal of the internal limiting membrane or the epiretinal membrane, repeat intraoperative imaging was obtained. Spectral domain optical coherence tomography findings were characterized.
Results
An efficient technique was established for obtaining intraoperative SDOCT imaging. A total of eight patients were included in the study. Four patients underwent surgery for macular hole, three patients for epiretinal membrane, and one for vitreomacular traction. Comparison of the preincision and intraoperative SDOCT images demonstrated distinct changes in retinal contour and macular hole configuration. Intraoperative SDOCT imaging identified additional membranes in two patients.
Conclusion
The intraoperative use of handheld SDOCT imaging provides an efficient method for visualizing macular pathology. This technology may, in certain cases, help confirm or identify diseases that may be difficult to visualize during surgery.
Keywords: epiretinal membrane, Fourier domain OCT, handheld, intraoperative, macular hole, OCT, optical coherence tomography, spectral domain optical coherence tomography, vitreomacular traction
Optical coherence tomography (OCT) is a rapid, noncontact, and noninvasive method of imaging intraocular tissue that has significantly contributed to the understanding, diagnosis, treatment, and follow-up of retinal diseases.1–5 Spectral domain optical coherence tomography (SDOCT) provides a number of advantages over conventional time-domain OCT systems. By eliminating the need for a scanning mirror, SDOCT offers higher acquisition speed and, thus, the ability to obtain significantly more images in a shorter period of time (approximately 20,000 A-scans per second compared with 400 A-scans per second on time-domain OCT). This increased speed minimizes patient movement artifact and improves image resolution. Some studies suggest that the higher resolution obtained with SDOCT imaging may improve the detection of abnormalities.6 –10 The ability to obtain volume maps of an entire region and the improved registration with SDOCT allow one to accurately follow changes in the same anatomic area on subsequent imaging. Some units also have added features such as fluorescein angiography, autofluorescence, indocyanine green angiography, and scanning laser ophthalmoscope capability.
An important limitation of typical OCT units is that they are stationary and require a compliant patient who can sit upright. Thus, uncooperative pediatric patients and those with limited mobility (i.e., because of musculoskeletal disorders) or access (i.e., hospital floor patients or those in isolation) may not be properly imaged. A portable SDOCT unit (Bioptigen Inc., Research Triangle Park, NC) is now available that allows imaging of such patients. We have recently described methods of imaging children with shaken baby syndrome and those with albinism using this handheld SDOCT unit and have characterized novel retinal SDOCT findings in these two entities.10,11
An additional value of the handheld SDOCT system is the capability to obtain noncontact intraoperative images in the supine position. In the current study, we report our experience in using a handheld SDOCT imaging device to obtain high-resolution, cross-sectional images in patients undergoing surgery for full-thickness macular hole (FTMH), epiretinal membrane (ERM), or vitreomacular traction. Our objectives are to describe the technique of obtaining reliable intraoperative SDOCT images, to characterize the intraoperative findings, and to identify how these images compare with the preoperative scan and with the surgeon’s assessment of the macular status.
Materials and Methods
This study was approved by the Institutional Review Board of Duke University Medical Center. Consecutive patients undergoing vitrectomy surgery for macular diseases were enrolled in the study. All patients provided informed consent.
Patients were imaged with a portable SDOCT workstation consisting of a handheld SDOCT scanning head connected, through a flexible fiberoptic cable, to a mobile cart housing the computer–spectrometer unit and viewing screen (Bioptigen Inc.). The handheld scanning head can operate while positioned at any angle, allowing its use in the supine patient.
Retinal SDOCT imaging was performed in the operating room at Duke University Eye Center immediately before and during vitrectomy surgery. All images were obtained with the attending surgeon (C.A.T.) at the head of the bed (Figure 1). During image acquisition, the probe was typically stabilized by resting the hand on the wrist rest, which was temporarily raised to the level of the forehead. Alternatively, the surgeon could stabilize the hand-piece by resting several fingers on the patient’s forehead. An assistant operated the computer software while images were obtained by the surgeon.
Fig. 1.

Portable SDOCT workstation.
During each imaging session, three types of scans were obtained. Horizontal and vertical scans were obtained for each setting. The settings included summed 10-mm linear B-scans (40 repeated B-scans of 1,000 A-scans each), 10 × 10-mm volumetric scans (100 B-scans of 1,000 A-scans each), and 5 × 5-mm volumetric scans (200 B-scans of 500 A-scans). These customized settings obtained radial B-scans 100 μm apart on the 10 × 10-mm volumetric scans compared with 25-μm spacing on the 5 × 5-mm scans. The volumetric scans produced a three-dimensional representation of the retinal layers. By axially projecting the volumetric scans, a two-dimensional image analogous to a fundus photo, called a summed voxel projection (SVP), was created (Figures 2 and 3).
Fig. 2.

Preoperative SDOCT of Case 1 captured immediately before surgery. A, SVP from a 10 × 10-mm volumetric scan outlining the areas scanned in B–D. B, Vertical 10 × 10-mm scan showing a FTMH, cystic thickening of the retina at the hole margin (white arrow), and partial posterior vitreous separation. C, Vertical scan demonstrating partial vitreous separation (red arrow), cystic thickening of the parafoveal region, and normal hyperreflectivity of the ILM before removal. D, Vertical scan demonstrating normal juxtafoveal retinal contour and ILM hyperreflectivity before surgery.
Fig. 3.

Intraoperative SDOCT of Case 1 obtained immediately after ILM removal. A, SVP of the areas scanned. The dark spot in the lower right corner is a preretinal hemorrhage. Asterisks show corresponding location on B-scans of B–D. B, Retinal distortion, residual adherent ILM (white arrow), and decreased reflectivity of the outer retina and shadowing (blue arrow) corresponding to a focal hemorrhage at the margin of ILM peeling. This site had a normal retinal contour before surgery. C and D, Note the hyperreflective areas along the inner retinal surface that correspond to the remaining ILM (yellow star). In contrast, there is a less intense hyperreflectivity in the areas in which the ILM was peeled corresponding to the nerve fiber layer.
For each imaging session, the reference arm length was adjusted according to the axial length of the patient’s eye, which in most cases was estimated by the patient’s age using a table.12 If patients had documented axial lengths from previous surgeries, those measurements were used. We also adjusted for the patient’s refractive error (spherical equivalent). The handheld SDOCT unit has a focusing adjustment of 21 diopters (D) (−10 to + 11 D). Additional fine focusing was performed at the time of imaging. Focusing changes of <2 D did not seem to significantly affect the clarity of the images.
The postprocessing software used was InVivoVue 1.2 (Bioptigen Inc.). The SVP images obtained with the handheld probe held at the head of the bed appear flipped and inverted on the display monitor because the InvivoVue postprocessing software did not allow us to correct for the orientation of the handheld probe at the time of imaging. A more detailed description of the image-processing algorithm used to enhance image quality is described in our previous publication.10
Preincision SDOCT images were obtained after administration of retrobulbar anesthesia with the patients in the supine position without a lid speculum. Balanced salt solution or artificial tears was used to maintain corneal surface integrity and to improve the clarity of the images. Three-port pars plana vitrectomy surgery was performed in all patients. The Alcon 25-gauge vitrectomy system (Alcon Laboratories, Inc., Fort Worth, TX) was used in five patients and the 20-gauge system in the remainder. The posterior hyaloid was separated in eyes without a complete posterior vitreous detachment. Indocyanine green angiography was added over the posterior pole in the fluid-filled eye in patients undergoing macular hole (MH) surgery. Preservative-free triamcinolone was used to visualize the hyaloid in some patients with ERM. The Tano diamond-dusted membrane scraper and forceps were used to peel the internal limiting membrane (ILM) along with any membranes off the fovea. Cannulas were then plugged, and repeat intraoperative SDOCT images were obtained in all patients. An additional sterile drape was placed from the patient’s upper lid, over the forehead, and off the field to protect from inadvertent contact with the handheld probe cord. The handheld probe was placed into a sterile plastic bag, adjusted in such a way that the lens surface of the probe was aligned with a hole in the bag (created earlier by the surgeon), and suspended over the eye for noncontact imaging. Methylcellulose was placed over the ocular surface. After acquisition of the images, the additional drape was removed and the surgeon resumed the surgery.
Macular hole measurements were obtained with MatLab software (Version 7.0, Mathworks Inc., Natick, MA) and verified with ImageJ (freeware, National Institutes of Health, Bethesda, MD). The scan selected for measurements was the one with the largest hole diameter. Four measurements were calculated from each SDOCT image corresponding to the center of the hole. These included the base diameter, measured at the level of the retinal pigment epithelium; the minimum diameter, defined as the minimal extent of the hole; the maximum diameter, defined as the maximum distance between hole edges; and the hole height, measured as the distance between the retinal pigment epithelium and the inner most aspect of the hole (greatest height).
Results
A total of eight adult patients (eight eyes) were enrolled and successfully imaged. There were four women and four men with a mean age of 63.5 years (range, 45– 81 years; Table 1). Four patients were phakic and four were pseudophakic. Four patients underwent vitrectomy for MH repair, three for ERM, and one for VMT. The MH was idiopathic in all patients.
Table 1.
Patient Demographics and Surgical Findings
| Case | Patient Demographics
|
Surgical Findings
|
|||||||||
|---|---|---|---|---|---|---|---|---|---|---|---|
| Gender | Age | Etiology for Surgery | Past Ocular History | Visual Acuity | Phakic Status | PVD | Gauge of Vitrectomy | Complete PVD | Visualization Aid | Successful Closure of MH | |
| 1 | F | 58 | Stage 3 FTMH | None | 20/50 | Phakic | No | 20 | No | ICG | Yes |
| 2 | F | 81 | Stage 4 FTMH | AMD, CE/IOL | 20/250–1 | Pseudophakic | Yes | 25 | Yes | ICG | Yes |
| 3 | M | 68 | Stage 3 FTMH | Fuchs corneal dystrophy | 20/300 | Pseudophakic | No | 20 | No | ICG | Yes |
| 4 | F | 69 | Stage 3 FTMH | ERM, CE/IOL | HM | Pseudophakic | No | 25 | No | ICG | Yes |
| 5 | M | 70 | ERM | BRVO, CME | 20/80 | Phakic | Yes | 25 | Yes | PF Kenalog | N/A |
| 6 | M | 45 | ERM | PDR, CME | 200 E | Phakic | No | 20 | No | N/A | N/A |
| 7 | F | 55 | ERM | None | 20/64– | Phakic | Yes | 25 | Yes | N/A | N/A |
| 8 | M | 62 | VMT | PDR, CME, CE/IOL | 20/400 | Pseudophakic | Yes | 25 | Yes | PF Kenalog | N/A |
AMD, age-related macular degeneration; BRVO, branch retinal vein occlusion; CE/IOL, cataract extraction with intraocular lens; CME, cystoid macular edema; ERM, epiretinal membrane; F, female; FTMH, full thickness macular hole; M, Male; PDR, proliferative diabetic retinopathy; PF, preservative free; PVD, posterior vitreous detachment; SF6, sulfur hexafluoride.
There was a learning curve in localizing the area of interest and obtaining reliable, high-quality scans. Manual alignment was challenging because of several factors. The most important of these was motion artifact associated with stabilization of the handheld probe because small horizontal or angular movements of the imager’s hand would shift alignment off the pupil. Other challenges included the lack of real-time fundus image correlation and occasional poor SVP image quality. Orientation during scanning was more challenging because the SVP image and scans were inverted on the viewing screen because of the hand-held scanner location over the patient’s forehead.
Despite such challenges, our ability to image improved significantly over the course of the study. The SVPs were particularly helpful in identifying landmarks such as retinal vessels and the optic nerve, which could be used for orientation during imaging. We, thus, found that the wider field of view on the SVP obtained with the 10 × 10-mm scans, compared with the 5 × 5-mm scans, was advantageous in aiding orientation. The vessel pattern on the SVP was also useful in assessing image quality. Motion artifact during volumetric scans typically resulted in a broken vascular pattern on the SVP (Figure 4). We also found that operating the Bioptigen system in “free run” mode allowed the selection of an optimal SDOCT volume set to capture and save. With experience, each imaging session lasted 4 minutes to 5 minutes, and individual scans were acquired in 5.8 seconds. We instilled Systane artificial tears (Alcon Laboratories) every two or three scans as needed to maintain ocular surface integrity during preoperative imaging. We found that images obtained with artificial tears lubricating the cornea produced higher quality images compared with balanced salt solution. During surgery, Methocel 2% (Omnivision GmbH, Puchheim, Germany) gel over the cornea did not seem to impair image quality.
Fig. 4.

Spectral domain optical coherence tomography of Patient 7. A, Diffuse epiretinal membrane with focal area of discontinuity. Note multiple thin strands between the retinal surface and the membrane (white arrow). B, Irregular retinal contour with release of attachments after membrane peeling. C, SVP of preincision scan showing normal vessel appearance. D, SVP of preincision scan showing motion artifact and a broken vascular pattern.
Preincision SDOCT images confirmed the disease of interest in all cases. Comparison of the preoperative and intraoperative SDOCT images yielded a number of observations (Tables 2 and 3). These included focal, iatrogenic traumatic changes (Figure 3), ILM defects, and distinction between areas with remaining and removed ILM (Figures 3 and 5). Residual ERMs or ILM (Figure 6) and the absence of a previously visualized operculum or posterior hyaloid face were also observed (Figures 2 and 3). In addition, alterations in the retinal contour and MH configuration were observed in all cases.
Table 2.
Pre- and Intraoperative OCT Findings in Patients Undergoing MH Surgery
| Preoperative OCT Findings
|
Intraoperative OCT Findings
|
|||||||||||
|---|---|---|---|---|---|---|---|---|---|---|---|---|
| Case No. | ERM | Visualize ILM | CME | SRF | Operculum/Prehole Opacity | Additional Preoperative Findings | Residual Foveal ILM | Residual ERM | Change in SRF | Change in CME | Change in Reflectivity | Iatrogenic Changes |
| 1 | N | Y | Y | N | N | N/A | N | N/A | N | Y | Increased ILM R | R thickening with adherent strand (ILM) at edge |
| 2 | N | Y | Y | N | N | N/A | Y | N/A | N | N | N | N |
| 3 | N | Y | Y | N | Y—posterior hyaloid face | N/A | N | N/A | N | N | N | Focal shadowing from heme at ILM edge |
| 4 | N | Y | Y | Y | Y—posterior hyaloid face | Focal hyper R at RPE level, opacities in mid-level of hole | N | N | N | Y | N | N |
CME, cystoid macular edema; N, no; N/A, not applicable; R, reflectivity; RPE, retinal pigment epithelium; SRF, subretinal fluid; Y, yes.
Table 3.
Preincision and Intraoperative OCT Findings in Patients Undergoing ERM Surgery
| Case No. | ERM Characteristics | Retinal Contour | Characteristics of Hyaloid | Residual Central ERM | Retinal Contour | Iatrogenic Findings |
|---|---|---|---|---|---|---|
| 5 | Diffuse without focal traction | Irregular with moderate thickening | N/A | No | Irregular thickening with increase in ragged appearance; increased hyperreflectivity of inner retinal layers; faint membrane/strands at foveal edges | Focal excrescences with shadowing; edge of membrane/ILM directed anteriorly |
| 6 | Diffuse with multiple firm attachments; double layer of ERM/schisis | Ragged contour; diffuse CME with large cysts | Hyperreflectivity anterior to hyaloid face | No | Normalization of retinal contour with reduced ragged appearance | Two focal excrescences with shadowing |
| 7 | Diffuse ERM with multiple, focal, firm attachments; area of discontinuity | Irregular thickening; multiple attachment to ERM | N/A | Residual perifoveal ERM | Irregular with persistent traction from ERM and persistence of ragged appearance | Focal retinal elevation with shadowing |
| 8 | Diffuse without focal traction | Cystic edema with foveal traction elevation; hyperreflectivity of outer layers | Focal, firm attachment to foveal center | No | Absence of focal elevation; diffuse thickening with hyperreflectivity of outer layers; focal hyperreflective dots along retinal surface (possibly triamcinolone particles) | Focal retinal elevation |
CME, cystoid macular edema; N/A, not applicable.
Fig. 5.

Comparison of the preoperative and intraoperative SDOCT of Patient 1 demonstrating change in the MH configuration. A, Preoperative image demonstrating a FTMH and cystic retinal thickening. The red lines depict the MH height and the base diameter. B, Postoperative scan showing a more peaked appearance of the hole edge and a smaller base diameter. Also, note the distinction of the hyperreflectivity along the retinal surface in the area with remaining ILM (white arrow) compared with the adjacent retina in which the ILM was removed.
Fig. 6.
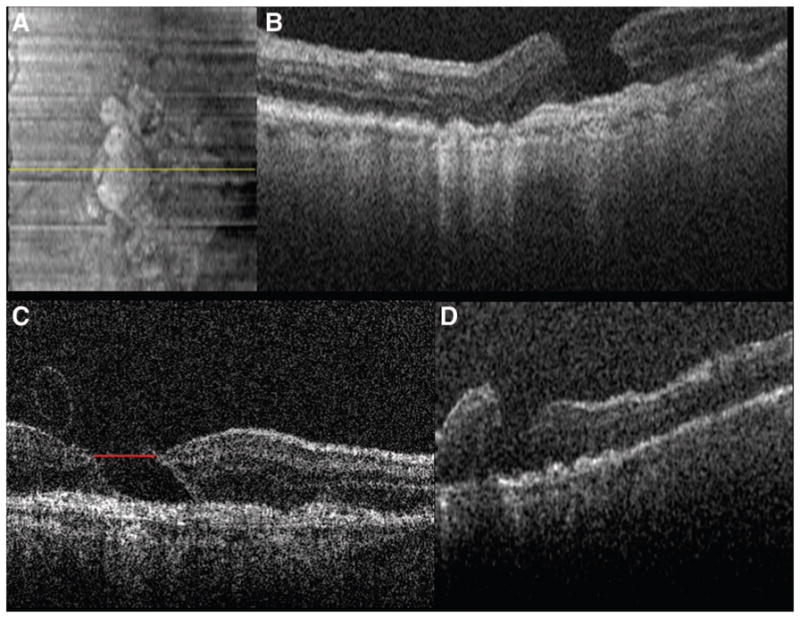
Spectral domain optical coherence tomography of Patient 2 captured preoperatively and after initial and complete ILM removal. A, SVP from a 5 × 5-mm volumetric scan. B, Preoperative image showing a FTMH in an area of perifoveal geographic atrophy. C, Intraoperative images obtained after initial ILM removal show a “scrolled,” partially separated ILM at the margin of the MH. Note the difference in retinal contour at the right side of the hole where the ILM is now absent compared with the left margin where the ILM persists. The red line depicts the maximum hole diameter. D, OCT scan after complete ILM removal shows a more elevated and less taut retinal morphology compared with previous scans with the MH approaching closure.
Among the patients undergoing MH surgery, there seemed to be a reduction in the mean size of the hole diameter (Table 4). This change was observed with the base diameter and with the minimum and maximum diameter (Figures 5 and 6). The MH height remained relatively stable, and there was only moderate change in most cases. In 3 of the 4 patients with FTMH (Patients 1–3), the retina at the edges of the hole seemed to move centrally (toward the center of the MH) after ILM removal, suggesting decreased tangential traction (Figures 5 and 6). In 2 of these patients (Patients 1 and 3), there was an increased vertical retinal elevation at the edges of the hole (Figure 5).
Table 4.
Measurement of Preincision and Intraoperative Hole Dimensions (in microns)
| Case | Base Diameter
|
Maximum Diameter
|
Minimum Diameter
|
Macular Hole Height
|
Macular Hole Index
|
||||||||||
|---|---|---|---|---|---|---|---|---|---|---|---|---|---|---|---|
| Preincision | Intraop | Change | Preincision | Intraop | Change | Preincision | Intraop | Change | Preincision | Intraop | Change | Preincision | Intraop | ||
| 1 | 840 | 670 | −170 | 960 | 800 | −160 | 700 | 511 | −189 | 485 | 584 | 99 | 0.58 | 0.87 | |
| 2 | 920 | 960 | 40 | 930 | 871 | −59 | 918 | 790 | −128 | 451 | 413 | −38 | 0.49 | 0.43 | |
| 3 | 1110 | 1080 | −30 | 1271 | 1157 | −114 | 590 | 650 | 60 | 758 | 841 | 83 | 0.68 | 0.78 | |
| 4 | 1090 | 1050 | −40 | 952 | 1060 | 108 | 330 | 480 | 150 | 699 | 714 | 15 | 0.64 | 0.68 | |
| Mean | 990 | 940 | −50 | 1028 | 972 | −56 | 635 | 608 | −27 | 598 | 638 | 40 | |||
| Median | 1005 | 1005 | 0 | 956 | 966 | 10 | 645 | 581 | −64 | 592 | 649 | 57 | |||
| S.D. | 131 | 187 | 162 | 165 | 245 | 142 | 153 | 183 | |||||||
Intraop, Intraoperative.
Among those undergoing surgery for ERM and VMT, definite alterations in the retinal contour were seen after ERM/ILM peeling (Figures 4 and 7). In one patient with ERM (Patient 6, Figure 7) and another with VMT (Patient 8, Figure 8), an immediate normalization of the retinal contour was seen. In Patient 7, there were multiple thin attachments between the retinal surface and the ERM (Figure 4A). After membrane peeling, there was persistence of an irregular and corrugated retinal contour (Figure 4B). This appearance improved significantly on subsequent SDOCT imaging over the ensuing 4 weeks. In another patient, an increased distortion of the retinal layers was observed. Interestingly, the intraoperative images identified residual membranes not visualized by the assistant surgeon during surgery in 2 patients, one undergoing surgery for MH (Patient 2; Case 2, described later) and another for ERM (Patient 7). No immediate postoperative complications were observed in any of the study patients. MH closure was attained with a single procedure in all patients undergoing MH repair.
Fig. 7.

Spectral domain optical coherence tomography of Patient 6. A, Epiretinal membrane with multiple attachments (white arrows) and traction. Note the corrugated retinal appearance between the attachments and the hyperreflective opacities anterior to the membrane. B, Decreased retinal traction after membrane peel (white arrows) with normalization of the retinal contour.
Fig. 8.

A, Preincision 5 × 5-mm SDOCT scan of Patient 8 demonstrating vitreomacular traction with cystic thickening of the retina. The white arrow demonstrates the attachment of the hyaloid to the fovea. B, Intraoperative 5 × 5-mm SDOCT scan showing the edge of the peeled hyaloid (white arrow). The hyperreflective spots along the retinal surface likely represent residual triamcinolone particles.
Case 1
A 58-year-old woman (Patient 1) with no ocular history presented with decreased vision and best-corrected visual acuity of 20/50. She was found to have a Stage 3 FTMH, which was confirmed by OCT, and underwent surgical repair.
Preincision, intraoperative SDOCT imaging confirmed a FTMH with cystic thickening at the edges (Figure 2). There is a partial vitreous separation with persistent attachments primarily inferiorly. Normal contour and hyperreflectivity of the inner retinal layers, including the ILM, can be appreciated.
Intraoperative images obtained after ILM removal showed an area of irregular retinal contour inferonasal to the fovea with persistent hyaloidal attachment, decreased reflectivity of the outer retinal layers, and shadowing (Figure 3). This area corresponds to the margin of ILM peeling and a focal intraretinal hemorrhage that was appreciated intraoperatively. Sharp contrast is observed between the hyperreflective areas with persistent ILM and the adjacent retina where the ILM was peeled. The intraoperative SDOCT images also show that both edges of the hole are more vertically elevated compared with the preoperative scans and seem to be approaching one another (Figure 5).
Case 2
A pseudophakic 81-year-old woman (Patient 2) with a history of age-related macular degeneration presented with vision loss in her better-seeing eye. On examination, visual acuity was 20/250 in the affected eye, and there was nonfoveal geographic atrophy and a Stage 4 FTMH, which was confirmed by SDOCT imaging.
She subsequently underwent surgical repair. After initial ILM removal, the surgeons disagreed as to whether further ILM remained at the upper margin of the hole. The intraoperative SDOCT images obtained after initial ILM removal demonstrated remaining membrane that was partially separated and scrolled at the temporal edge of the hole (Figure 6). On the basis of the indocyanine green angiography staining of the tissue and the scrolled appearance, the residual membrane was believed to be ILM. One feature of this image that is most striking is the contrast between the contour of the hole margin where there is persistent traction from remaining ILM and the hole edge that is free of ILM. Surgery was resumed and the residual ILM was removed. Repeat SDOCT intraoperative imaging verified absence of the remaining ILM and a hole contour that appeared more elevated and less taut, confirming reduced tangential traction.
Discussion
In this study, we report the use of a handheld SDOCT unit to obtain preincision and intraoperative images in patients undergoing macular surgery. To the best of our knowledge, this is the first report of the intraoperative use of such technology. Imaging obtained during surgery provided unique information regarding the location of persisting ILM or epiretinal membrane. This served as a valuable teaching tool during surgery to demonstrate findings to the surgical assistant that were difficult to identify visually. In addition, interesting observations were made that confirm and may expand our understanding of the pathophysiology of MHs. There was a learning curve in efficiently acquiring reliable images, and our ability to obtain high-quality images improved considerably with time. Artificial tears, improved ability to hold the probe, and the understanding of how SVPs were displayed were factors that enhanced our imaging capability.
Idiopathic FTMH affects approximately 0.3% of people and results in reduced central vision.13 Optical coherence tomography is currently considered the gold standard for the diagnosis of MHs and has greatly contributed to our understanding of its pathogenesis and response to therapy. Advances in MH surgery have led to improved surgical outcome and visual recovery. Surgical repair typically involves pars plana vitrectomy, removal of posterior cortical vitreous, and infusion of expansile gas with postoperative prone positioning. A meta-analysis on 1,654 eyes treated using different techniques reported an 87.5% anatomic success rate.14 Data suggest that removal of the ILM may improve the anatomic success of MH repair by relieving tangential traction and by preventing proliferation of epiretinal tissue.15–20 Accordingly, among eyes in which the ILM was not removed at the time of surgery, recurring ERMs seem to be the main cause of MH reopening.21 In our series, residual ILM not visualized by the assistant surgeon at the time of surgery was identified on the intraoperative SDOCT imaging in one of four patients undergoing MH repair. After removal of the residual ILM segment, there was a definite change in the MH morphology (Figure 6). Given the apparent role of ILM in MH pathogenesis, and the difficulty in visualizing this structure during surgery, intraoperative SDOCT may prove to be a useful adjunct in select cases. This may provide an alternative to the current technique of indocyanine green angiography staining, which has been associated with ocular toxicity and vision loss.17,22–25 Intraoperative SDOCT imaging also identified persistent traction and distortion from residual membranes in a patient undergoing vitrectomy for ERM (Patient 7). Surgery was resumed and additional peeling was performed with relief of traction. In a previous publication, we reported on a 6-month infant undergoing vitrectomy for a double layer of ERM.10 One month after the initial procedure, a deeper layer of remaining membrane was identified on SDOCT, and a second vitrectomy was performed. Intraoperative SDOCT may, therefore, also be valuable in the management of ERMs, in particular in cases with limited intra-operative visualization or double-layer (schisis) membranes.
In addition to clinical factors affecting surgical outcome, several studies have assessed the correlation between preoperative OCT findings and the anatomic and visual success of MH surgery. For example, OCT studies suggest that the base and minimum diameters of MHs are predictive of postoperative success and that visual results are adversely affected by increasing hole size.26,27 The significance of MH height and base diameter was addressed by Kusuhara et al,28 using OCT imaging, to calculate the MH index. The MH index, defined as the greatest height of the hole (from the retinal pigment epithelium to the vitreoretinal interface) divided by its base diameter, was the only factor identified in the study that significantly correlated with postoperative vision. This study found that a larger hole height and a smaller base diameter were associated with better visual outcome.28 These findings are supported by a study that showed a positive correlation between both the MH index and the tractional hole index (ratio of the maximal height to the minimum diameter) and visual outcome.29 On the contrary, a study by Haritoglou et al30 found a negative correlation between visual outcome and MH height.
The success of repeat vitrectomy surgery for patients with persistent FTMH has also been correlated with OCT configuration. Hillenkamp et al31 found that those with a cuff of subretinal fluid at the hole margin on OCT imaging had a higher success rate for anatomic closure and visual outcome. The size, type of tamponade, or duration of the hole before the initial surgery did not seem to correlate with surgical outcome. The authors explain that the elevated configuration may facilitate the centripetal movement of retinal tissue over the fovea that is presumably necessary for hole closure. As opposed to the “stuck down” appearance, the increased height may be an indicator of decreased traction on retinal tissue or evidence of traction elevation as a result of the upward peeling.
In the current study, we compared the SDOCT images taken immediately before surgery and immediately after the removal of ILM of four eyes undergoing MH repair. In three of these patients, there was a reduction in the base diameter of the hole and an increase in MH height after vitrectomy and ILM removal. Interestingly, the only patient who did not show such changes had a Stage 4 FTMH with an existing posterior vitreous separation (Patient 2). This finding highlights the role of persistent posterior cortical vitreous attachments in the pathogenesis of MHs. The earlier findings suggest an immediate alteration in the tangential and anteroposterior forces on the hole and provide additional insight into the role of vitrectomy and ILM removal in MH surgery. Given that the cortical vitreous and the ILM were both removed before repeat imaging, the individual role of these steps on MH morphology remains uncertain. Future studies may answer this question by obtaining intraoperative OCT imaging after both the removal of posterior cortical vitreous and the ILM.
The limitations of the current report include a small sample size and potential for investigator bias. Despite such limitations, we report a safe and efficient method of obtaining intraoperative SDOCT imaging in the supine patient using a handheld SDOCT unit. We also characterize, for the first time, intraoperative OCT images obtained immediately after macular surgery. Our study found a decrease in the base diameter of the MH among patients without complete posterior vitreous separation. We predict that SDOCT integration into surgical viewing, potentially into the microscope, may provide useful information during fine macular surgical maneuvers in the near future.
Acknowledgments
Supported by North Carolina Biotechnology Center Collaborative Funding Grant no. 2007-CFG-8005 with Bioptigen Inc., National Institutes of Health R21 EY017393, and the Duke Translational Medicine Institute Subcontract No. 12 of NIH Grant No. 5ULT-RR024128-03. Supported, in part, by a grant from the Heed Ophthalmic Foundation (to P.N.D.).
Dr. Toth receives other support from the following commercial entities: Alcon Laboratories (honorarium, research support, and royalties), Bioptigen (honorarium, research support, and license agreement), Genentech (honoraria and research grant), and Sirion Therapeutics (research grant). Dr. Dayani received an honorarium as a clinical consultant from OSI Therapeutics.
References
- 1.Huang D, Swanson EA, Lin CP, et al. Optical coherence tomography. Science. 1991;254:1178–1181. doi: 10.1126/science.1957169. [DOI] [PMC free article] [PubMed] [Google Scholar]
- 2.Hee MR, Puliafito CA, Wong C, et al. Optical coherence tomography of macular holes. Ophthalmology. 1995;102:748–756. doi: 10.1016/s0161-6420(95)30959-1. [DOI] [PubMed] [Google Scholar]
- 3.Gaudric A, Haouchine B, Massin P, Paques M, Blain P, Erginay A. Macular hole formation: new data provided by optical coherence tomography. Arch Ophthalmol. 1999;117:744–751. doi: 10.1001/archopht.117.6.744. [DOI] [PubMed] [Google Scholar]
- 4.Puliafito CA, Hee MR, Lin CP, et al. Imaging of macular diseases with optical coherence tomography. Ophthalmology. 1995;102:217–229. doi: 10.1016/s0161-6420(95)31032-9. [DOI] [PubMed] [Google Scholar]
- 5.Toth CA, Narayan DG, Boppart SA, et al. A comparison of retinal morphology viewed by optical coherence tomography and by light microscopy. Arch Ophthalmol. 1997;115:1425–1428. doi: 10.1001/archopht.1997.01100160595012. [DOI] [PubMed] [Google Scholar]
- 6.Gupta V, Gupta P, Singh R, Dogra MR, Gupta A. Spectral-domain cirrus high-definition optical coherence tomography is better than time-domain stratus optical coherence tomography for evaluation of macular pathologic features in uveitis. Am J Ophthalmol. 2008;145:1018–1022. doi: 10.1016/j.ajo.2008.01.021. [DOI] [PubMed] [Google Scholar]
- 7.Koizumi H, Spaide RF, Fisher YL, Freund KB, Klancnik JM, Jr, Yannuzzi LA. Three-dimensional evaluation of vitreo-macular traction and epiretinal membrane using spectral-domain optical coherence tomography. Am J Ophthalmol. 2008;145:509–517. doi: 10.1016/j.ajo.2007.10.014. [DOI] [PubMed] [Google Scholar]
- 8.Stopa M, Bower BA, Davies E, Izatt JA, Toth CA. Correlation of pathologic features in spectral domain optical coherence tomography with conventional retinal studies. Retina. 2008;28:298–308. doi: 10.1097/IAE.0b013e3181567798. [DOI] [PubMed] [Google Scholar]
- 9.Khanifar AA, Koreishi AF, Izatt JA, Toth CA. Drusen ultra-structure imaging with spectral domain optical coherence tomography in age-related macular degeneration. Ophthalmology. 2008;115:1883–1890. doi: 10.1016/j.ophtha.2008.04.041. [DOI] [PMC free article] [PubMed] [Google Scholar]
- 10.Scott AW, Farsiu S, Enyedi LB, Wallace DK, Toth CA. Imaging the infant retina with a hand-held spectral-domain optical coherence tomography device. Am J Ophthalmol. 2009;147:364.e2–373.e2. doi: 10.1016/j.ajo.2008.08.010. [DOI] [PubMed] [Google Scholar]
- 11.Chong G, Farsiu S, Freedman SF, et al. Abnormal foveal morphology in ocular albinism imaged with spectral domain optical coherence tomography. Arch Ophthalmol. 2009;127:37– 44. doi: 10.1001/archophthalmol.2008.550. [DOI] [PubMed] [Google Scholar]
- 12.Gordon RA, Donzis PB. Refractive development of the human eye. Arch Ophthalmol. 1985;103:785–789. doi: 10.1001/archopht.1985.01050060045020. [DOI] [PubMed] [Google Scholar]
- 13.la Cour M, Friis J. Macular holes: classification, epidemiology, natural history and treatment. Acta Ophthalmol Scand. 2002;80:579–587. doi: 10.1034/j.1600-0420.2002.800605.x. [DOI] [PubMed] [Google Scholar]
- 14.Mester V, Kuhn F. Internal limiting membrane removal in the management of full-thickness macular holes. Am J Ophthalmol. 2000;129:769–777. doi: 10.1016/s0002-9394(00)00358-5. [DOI] [PubMed] [Google Scholar]
- 15.Kwok AK, Lai TY, Yuen KS, Tam BS, Wong VW. Macular hole surgery with or without indocyanine green stained internal limiting membrane peeling. Clin Experiment Ophthalmol. 2003;31:470– 475. doi: 10.1046/j.1442-9071.2003.00709.x. [DOI] [PubMed] [Google Scholar]
- 16.Smiddy WE, Feuer W, Cordahi G. Internal limiting membrane peeling in macular hole surgery. Ophthalmology. 2001;108:1471–1476. doi: 10.1016/s0161-6420(00)00645-x. discussion 1477–1478. [DOI] [PubMed] [Google Scholar]
- 17.Tognetto D, Grandin R, Sanguinetti G, et al. Internal limiting membrane removal during macular hole surgery: results of a multicenter retrospective study. Ophthalmology. 2006;113:1401–1410. doi: 10.1016/j.ophtha.2006.02.061. [DOI] [PubMed] [Google Scholar]
- 18.Uemoto R, Yamamoto S, Aoki T, Tsukahara I, Yamamoto T, Takeuchi S. Macular configuration determined by optical coherence tomography after idiopathic macular hole surgery with or without internal limiting membrane peeling. Br J Ophthalmol. 2002;86:1240–1242. doi: 10.1136/bjo.86.11.1240. [DOI] [PMC free article] [PubMed] [Google Scholar]
- 19.Ando F, Sasano K, Ohba N, Hirose H, Yasui O. Anatomic and visual outcomes after indocyanine green-assisted peeling of the retinal internal limiting membrane in idiopathic macular hole surgery. Am J Ophthalmol. 2004;137:609– 614. doi: 10.1016/j.ajo.2003.08.038. [DOI] [PubMed] [Google Scholar]
- 20.Brooks HL., Jr Macular hole surgery with and without internal limiting membrane peeling. Ophthalmology. 2000;107:1939–1948. doi: 10.1016/s0161-6420(00)00331-6. discussion 1948 –1949. [DOI] [PubMed] [Google Scholar]
- 21.Yoshida M, Kishi S. Pathogenesis of macular hole recurrence and its prevention by internal limiting membrane peeling. Retina. 2007;27:169–173. doi: 10.1097/01.iae.0000224940.79223.fb. [DOI] [PubMed] [Google Scholar]
- 22.Engelbrecht NE, Freeman J, Sternberg P, Jr, et al. Retinal pigment epithelial changes after macular hole surgery with indocyanine green-assisted internal limiting membrane peeling. Am J Ophthalmol. 2002;133:89–94. doi: 10.1016/s0002-9394(01)01293-4. [DOI] [PubMed] [Google Scholar]
- 23.Gass CA, Haritoglou C, Schaumberger M, Kampik A. Functional outcome of macular hole surgery with and without indocyanine green-assisted peeling of the internal limiting membrane. Graefes Arch Clin Exp Ophthalmol. 2003;241:716–720. doi: 10.1007/s00417-003-0710-0. [DOI] [PubMed] [Google Scholar]
- 24.Kanda S, Uemura A, Yamashita T, Kita H, Yamakiri K, Sakamoto T. Visual field defects after intravitreous administration of indocyanine green in macular hole surgery. Arch Ophthalmol. 2004;122:1447–1451. doi: 10.1001/archopht.122.10.1447. [DOI] [PubMed] [Google Scholar]
- 25.Miura M, Elsner AE, Osako M, Iwasaki T, Okano T, Usui M. Dissociated optic nerve fiber layer appearance after internal limiting membrane peeling for idiopathic macular hole. Retina. 2003;23:561–563. doi: 10.1097/00006982-200308000-00024. [DOI] [PubMed] [Google Scholar]
- 26.Ip MS, Baker BJ, Duker JS, et al. Anatomical outcomes of surgery for idiopathic macular hole as determined by optical coherence tomography. Arch Ophthalmol. 2002;120:29–35. doi: 10.1001/archopht.120.1.29. [DOI] [PubMed] [Google Scholar]
- 27.Ullrich S, Haritoglou C, Gass C, Schaumberger M, Ulbig MW, Kampik A. Macular hole size as a prognostic factor in macular hole surgery. Br J Ophthalmol. 2002;86:390–393. doi: 10.1136/bjo.86.4.390. [DOI] [PMC free article] [PubMed] [Google Scholar]
- 28.Kusuhara S, Teraoka Escano MF, Fujii S, et al. Prediction of postoperative visual outcome based on hole configuration by optical coherence tomography in eyes with idiopathic macular holes. Am J Ophthalmol. 2004;138:709–716. doi: 10.1016/j.ajo.2004.04.063. [DOI] [PubMed] [Google Scholar]
- 29.Ruiz-Moreno JM, Staicu C, Piñero DP, Montero J, Lugo F, Amat P. Optical coherence tomography predictive factors for macular hole surgery outcome. Br J Ophthalmol. 2008;92:640–644. doi: 10.1136/bjo.2007.136176. [DOI] [PubMed] [Google Scholar]
- 30.Haritoglou C, Neubauer AS, Reiniger IW, Priglinger SG, Gass CA, Kampik A. Long-term functional outcome of macular hole surgery correlated to optical coherence tomography measurements. Clin Experiment Ophthalmol. 2007;35:208–213. doi: 10.1111/j.1442-9071.2006.01445.x. [DOI] [PubMed] [Google Scholar]
- 31.Hillenkamp J, Kraus J, Framme C, et al. Retreatment of full-thickness macular hole: predictive value of optical coherence tomography. Br J Ophthalmol. 2007;91:1445–1449. doi: 10.1136/bjo.2007.115642. [DOI] [PMC free article] [PubMed] [Google Scholar]