

Abstract
We report on an audit of 138 ME/CFS patients who attended a private practice and took the ATP Profile biomedical test. The results revealed that all of these patients had measureable mitochondrial dysfunction. A basic treatment regime, based on 1) eating the evolutionary correct stone-age diet, 2) ensuring optimum hours of good quality sleep, 3) taking a standard package of nutritional supplements, and 4) getting the right balance between work and rest, was recommended for all patients. Additions to the basic regime were tailored for each patient according to the results of the ATP Profile and additional nutritional tests and clues from the clinical history. Mitochondrial function is typically impaired in two ways: substrate or co-factor deficiency, and inhibition by chemicals, exogenous or endogenous. For the former, additional nutrients are recommended where there is a deficiency, and for the latter, improvement of anti-oxidant status and selective chelation therapy or far-infrared saunas are appropriate. We show case histories of nine patients who have taken the ATP Profile on three or four occasions, and a before-and-after treatment summary of the 34 patients who have had at least two ATP Profile tests separated by some months. Finally, we summarize the results for the 30 patients who followed all aspects of the treatment regime and compare them with the 4 patients who were lax on two or more aspects of the treatment regime. All patients who followed the treatment regime improved in mitochondrial function by on average a factor of 4.
Keywords: Myalgic encephalomyelitis, Chronic fatigue syndrome, Mitochondrial dysfunction, Adenosine triphosphate (ATP), Oxidative phosphorylation, Cellular energetics, Nutrition
Introduction
We recently reported on an initial audit of a cohort of 138 patients who attended a private practice specializing in the treatment of ME/CFS and who had taken the ATP Profile blood test [1]. All patients satisfied the widely used diagnostic criteria for chronic fatigue syndrome (CFS) [2], and most, if not all, satisfied the International Consensus Criteria for Myalgic Encephalomyelitis (ICCME) [3]. The ATP Profile consists of several measurements of ATP (Adenosine triphosphate) in neutrophils and their mitochondria. The mitochondria carry out the recycling of energy-spent ADP (Adenosine diphosphate) into energy-rich ATP by a series of biochemical reactions involving the link reaction, the Krebs citric acid cycle, and oxidative phosphorylation which uses the energy provided by the electron transfer chain (ETC) to complete the process. Two additional steps are required: the translocation of ADP into the mitochondria and the translocation of ATP out of the mitochondria where most of the energy is required. These processes occur, and provide the energy needed, in all cells in the body, apart from red blood cells.
As the first step in measuring the efficiency of oxidative phosphorylation, we added sodium azide to a suspension of neutrophils in order to inhibit this process. We found that for about ½ of the patients this process was already partially BLOCKED and that an alternative process must be contributing to ATP production. For the other ½ of the patients, the only ATP being made with the azide present was that expected by ongoing glycolysis in the cytosol, and there was NO BLOCK.
We concluded from this audit and a re-analysis of a previous audit of a cohort of 61 patients in the age range of 18-65 years (Cohort 1) and of 53 controls [4], the following features: 1) All patients of both Cohort 1 (n=61) and Cohort 2 (n=138) had measurable mitochondrial dysfunction. 2) The degree of mitochondrial dysfunction correlates with illness severity, as demonstrated in our analysis of Cohort 1 [4], and comparison with Cohort 2 [1]. 3) Patients divide into two main groups according to whether oxidative phosphorylation is not already blocked, Group A (NO BLOCK), or is already partially blocked, Group B (BLOCKED or ‘HI Blk’). We further sub-divide Group A into A1 and A2. 4) For patients in Group A, where there is no prior blocking of oxidative phosphorylation or the reactions leading up to it, cellular metabolism uses increased glycolysis to partially compensate for the dysfunction. 5) For patients in Group B, where there is partial blocking of oxidative phosphorylation or a reaction leading up to it, there is an alternative route to increased glycolysis which the cells use to partially compensate for the blocking. This route is most likely the adenylate kinase reaction in which two molecules of ADP combine to make one of ATP and one of AMP (Adenosine monophosphate). 6) Tests on isolated mitochondria (parameters TL OUT and TL IN) show that some of the blocking is due to partial blockages of the translocator proteins, either on the mitochondrial matrix side (TL IN) or the outer membrane (and cytosol) side (TL OUT). 7) Group A1: ‘no HIs’ patients appear not to suffer from substrate deficiencies in the processes leading to ATP delivery, while those in Group A2: ‘HI TL IN’ have substrate deficiencies. The latter conclusion comes from the measured super-normal values of the parameter TL IN. 8) Comparisons with some published exercise studies, which also indicate two groups, suggest that the dysfunction that we observe in neutrophils may also occur in other cells such as those of skeletal muscle [1]. 9) The degree of dysfunction in neutrophils correlates with auxiliary measurements of cell-free DNA in blood plasma which indicate levels of tissue damage up to 3.5 times the upper level of the normal reference range. This is clearly demonstrated in figure 6 of our previous paper on the pathophysiology [1]. The cell-free DNA is a measure of non-apoptotic tissue breakdown [5]. 10) The major immediate causes of the mitochondrial dysfunction are: a) lack of substrate, and b) partial blocking of the translocator protein sites and/or oxidative phosphorylation and the reactions leading up to it (link reaction and Krebs cycle).
In this paper we will show that the ATP Profile is a valuable diagnostic and clinical management tool for ME/CFS. This is possible because 34 of the 138 patients of Cohort 2 have undergone a repeat ATP Profile after some months of treatment and we can compare their subsequent test results with their initial ones.
The ATP Profile
Test procedure
Full details of the testing procedure and how the quantities are measured have been published [1,4] and will not be repeated here. However, we will list the main quantities: ATPMg: the whole cell concentration of ATP in units of fmol/cell, measured with the addition of excess magnesium (Mg); ATPend: the concentration of ATP complexed with endogenous Mg; ATP Ratio: the ratio ATPend/ATPMg which indicates whether or not there is a Mg deficiency; % ATP inhibited: the percentage decrease of whole cell ATP when an inhibitor of the ETC is added; Ox Phos: a measure of the efficiency of the oxidative phosphorylation process which is calculated by measuring the fraction of whole cell ATP recovered when the inhibitor is removed; TL OUT: a measure of the functionality of the translocator protein TL when its electrogenic antiport faces out to transport ADP into mitochondria for recycling; TL IN: a measure of the functionality of TL when its antiport faces into the mitochondrial matrix to transport recycled ATP into the cytosol. This is the situation when its value is in the normal region, or below normal. In some cases it has a super-normal value, and we interpret this as being due to lack of substrate within the mitochondria [1].
Each one of these quantities has an experimental minimum value and maximum value for the control group, and Ox Phos and % ATP inhibited are constrained to be not larger than unity (or 100%). Usually the values for patients are within the normal range or below it. The exception is TL IN which sometimes has super-normal values (hence the label ‘HI TL IN’) which we interpret as being due to lack of one or more substrates within the mitochondria.
The total cellular concentration of ATP is not a useful measure of mitochondrial dysfunction [6]. As an overall measure of the efficiency for ATP production and recycling, and one which correlates well with the degree of patient ability, we use 6 of these 7 quantities (ATPend is already included in ATPMg and ATP Ratio) to calculate what we call the Mitochondrial Energy Score, MESinh, by evaluating the product of these quantities, dividing this figure by the minimum value of the controls for this product and then finally multiplying by 100 to convert to %. All of the 53 controls have values of MESinh of 100% or more (up to 257%) with an average of (144 ± 29)% where the error is the standard deviation (SD). Figure 1A shows a histogram of the MESinh values for the control group, and the dotted vertical line indicates the mean value.
Figure 1.
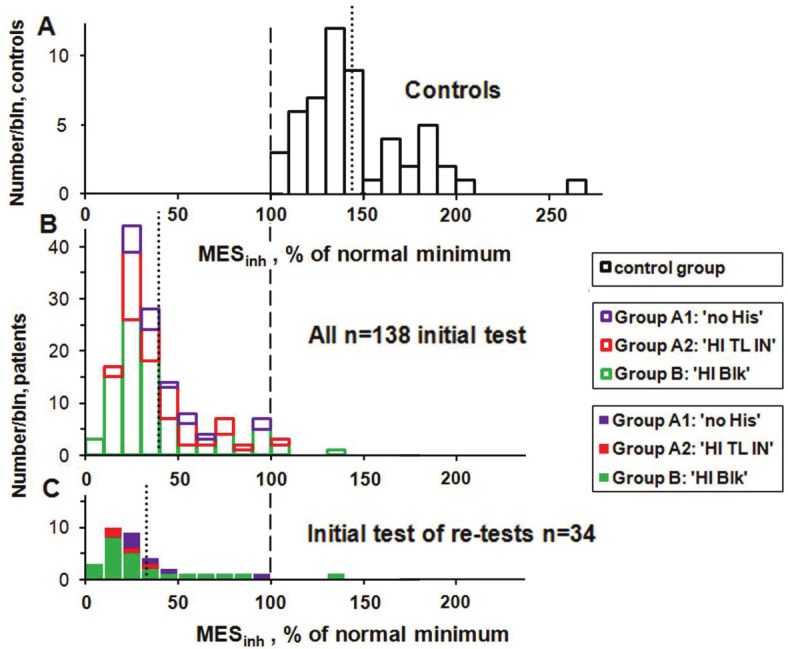
Histograms of MESinh for the control group (A), for the initial ATP Profile test for all 138 Cohort 2 patients (B), and on the same vertical scale for the 34 patients who had one or more subsequent tests (C). The vertical dashed line indicates the minimum value of MESinh for the control group (to which all results are normalized) and the vertical dotted lines indicate the mean value of MESinh for each histogram. The vertical scale for the controls has been adjusted to give the controls histogram approximately the same area as that of the n=138 patient group.
Auxiliary tests
As well as the ATP Profile, many of the patients take other tests including that of Cell free DNA in blood plasma. This test is a measure of cell damage, and we have already shown that this quantity correlates with the results of the tests on neutrophils, and suggests that the dysfunction we see in those cells must also occur in other cells [1]. Below we will report on the results of just a few of the other auxiliary tests, namely Red cell NAD, L-Carnitine and CoQ10.
Therapeutic interventions
Preliminaries and scale of the problem
In this section we present the results from those patients of Cohort 2 who have had the ATP Profile test after some months of therapy which has been individually tailored according to the results of their first tests. Because these results come from an audit and not a funded research study, the time intervals between tests are highly variable. Another complicating factor is that we have no way of confirming the extent to which the recommendations of the therapeutic protocol were actually carried out by individual patients. Nevertheless, the results indicate that nearly all patients show biochemical improvement, with dramatic improvements in some patients, provided they put in place the prescribed dietary, nutritional and lifestyle regimes. It is also notable that the patients who did not adhere to the regimes did not see biochemical progress.
We have altogether 34 multiple-test patients: two who have taken the ATP Profile four times, seven who have been tested three times and 25 who have been tested twice. We briefly report the case histories of the 3- and 4-test patients. These are also included in a before and after study with the 25 patients who have had the ATP Profile twice. Unfortunately we have no follow-up biomedical test results for the other 104 (75%) of the 138 patients of Cohort 2. This is an inevitable result of audit where clinical decisions are made for the benefit of the patient, not the clinician or researcher. All we can say is that those patients who have multiple tests have a strong tendency to be among the most ill patients at the first test. This is illustrated by comparing the histogram (Figure 1B) of the initial values of the revised Mitochondrial Energy Score (MESinh) for all 138 Cohort 2 patients with the histogram (Figure 1C) of the initial values of the 34 patients who had multiple tests. The multiple-test patients have a lower mean value (compare the vertical dotted lines), and 38% of the multiple-test patients are in the first two bins with the lowest values of MESinh at the initial test compared with less than 7% of those with no repeat test.
Note that the majority of the patients have values of MESinh well below the minimum value for the control group of 100% and further below the (144 ± 4)% average of the controls, where this error is the standard error of the mean (SEM). The four patients with MESinh values of greater than 100% (Figure 1B) all have at least two of the six ATP factors below the normal minimum values [1]. The mean value of MESinh for all of these 138 first test patients is (39.7 ± 2.1)% (SEM), and only (32.7 ± 4.7)% (SEM) for the initial value of the multiple-test patients. We cannot say whether or not the 104 patients who did not have a repeat test improved as much as those who did, and whose improvement (or lack of it) we have measured. However, because the feedback that we have had is so positive, and because it is mainly the most severely affected patients who have repeat tests, we think it likely that the improvements that we do measure are a lower limit, or at least an average, of those that have not been measured. A future properly funded research study could mitigate this problem.
Figure 1 illustrates the scale of the problem facing the patients and the clinician (in our case SM). The very ill patients who need to take subsequent tests peak at about 30 on the horizontal scale and the goal is to get them up among the control group which peaks at about 140, a very large difference. This large difference is measured with neutrophils which are the main effectors of the innate immune system. Our measurements of cell-free DNA suggest that there are also major effects in other cells [1].
Treatment protocol
The treatment protocol is largely based on two experimental facts: 1) A large fraction of people with ME/CFS (as diagnosed with the 1994 CDC criteria) [2] have mitochondrial dysfunction. We found measureable mitochondrial dysfunction in all of 61 patients in the age range 18-65 years (Cohort 1) [4], and in all of the 138 patients of Cohort 2 [1]. Every expenditure of energy in cells throughout the body requires the conversion of ATP into ADP and the patients we have studied have lower than normal levels of ATP. The mean value of ATPend for the Cohort 2 patients is only 0.88 fmol/cell compared with the mean of 1.37 fmol/cell for the control group. The patients are also inefficient in recycling the ADP back into ATP. If patients push themselves with respect to increased mental and/or physical activities which both make more energy demands, they will be forced to make ATP by an alternative route. One such route is anaerobic metabolism via glycolysis where pyruvate is converted to lactate. Biochemically the result is acidosis, and clinically these patients suffer pain. Patients in Group B (BLOCKED) have the additional problem of replenishing their supply of adenine nucleotides due to the loss of one molecule of ADP for each molecule of ATP hydrolyzed. 2) People with ME/CFS often have low cardiac output [7-11], and cerebral blood flow [12]. These features could be explained by mitochondrial dysfunction - mitochondria make up 25% by weight of cardiac muscle [13]. The low cardiac output could also contribute to mitochondrial dysfunction by decreasing the delivery of all substrates, but because they are so closely interrelated it is difficult to prove which comes first [14].
In the treatment of ME/CFS by one of us (SM) there is a basic protocol that applies to all patients regardless of the cause and the underlying biochemical abnormalities [15]. Indeed this basic protocol simply represents the lifestyles and dietary regimes all people should be following to optimise their health. The basic protocol is comprised of: 1) eating the evolutionary correct stone-age diet; 2) ensuring optimum hours of good quality sleep; 3) taking a standard package of nutritional supplements which at least meet the Recommended Daily Intakes of essential nutrients; 4) getting the right balance between work and rest.
Some aspects of the basic protocol tailored to mitochondrial dysfunction [16,17] and to ME/CFS [18,19] have already been reviewed. Details of the protocol used here are freely available [20].
Additions to the above regime are tailored for each patient according to the results of their mitochondrial function tests, together with other nutritional tests and clues from the clinical history. We have found that mitochondrial function is typically impaired in two ways - either 1) substrate or co-factor deficiency, or 2) inhibition by chemicals which may be exogenous or endogenous [1]. As well as the mitochondrial function tests, for most patients we also measure levels of minerals (magnesium, zinc, copper, selenium and manganese) and of specific co-factors such as Niacinamide (vitamin B3 status), Acetyl L-carnitine and Co-enzyme Q10. There may be several reasons why vitamin B12 by injection may be recommended [21]. If a patient has evidence of blocking of mitochondrial function then further tests can be used to ascertain the nature of that blocking which could include DNA adducts, fat biopsies, micro-respirometry studies or translocator protein studies. We often find deficiencies in glutathione (GSH) and glutathione peroxidase (GSH-PX} which are needed to protect cells from oxidative damage and to detoxify xenobiotics. Other appropriate detoxification regimes, as determined by standard practices of ecological medicine, can also be put into place. For example, high levels of pesticides or volatile organic compounds can be treated by far-infrared saunas (FIRS) which have also been shown to have other beneficial effects in fibromyalgia and other illnesses [22-24]. High levels of heavy metals can be tackled using selective chelation therapy, and evidence of immune-complex blocking may be treated by addressing issues of allergy and chronic infection. If there is evidence of mal-absorption of micro-nutrients then again there may be interventions to improve gut function or supply micronutrients parenterally [15].
Case histories
In carrying out this audit, all patients were given fictitious initials and their test results were blinded in the analysis and reporting. Here we give details of the two patients who have had the ATP Profile test on four occasions and the seven who have been tested three times. The initial and final test results of all 34 multiple test patients are included in the next subsection.
Figure 2 shows plots of the measured parameters ATPend, Ox Phos, TL OUT, TL IN and %ATPinh (% ATP inhibited) and the computed MESinh all normalized to the normal minimum of each taken as 100%. On this scale the maximum value of TL IN for the controls is 152% and the maximum possible value of %ATPinh is 119%. We absorb ATPMg and ATP Ratio into their product ATPend because the product of their normal minima is very close to the normal minimum of their products. The numbers below Test 2, Test 3 and Test 4 are the time intervals in months since Test 1. The fact that the computed MESinh appears to have a different normalization is just because none of the controls have the normal minimum value for all of the parameters making up MESinh, and the normal minimum of MESinh is 1.42 times the product of the 5 normal minimum values of ATPMg, ATP Ratio, Ox Phos, TL OUT and %ATPinh.
Figure 2.

Plots of the ATP Profile test results for the 9 patients who have had the ATP profile test on 3 or 4 occasions. The numbers below Test 2, Test 3 and Test 4 are the time intervals in months since Test 1. The fact that the computed MESinh appears to have a different normalization is just because none of the controls have the normal minimum value for all of the parameters making up MESinh, and the normal minimum of MESinh is 1.42 times the product of the 5 normal minimum values of ATPMg, ATP Ratio, Ox Phos, TL OUT and %ATPinh.
In Figure 2 we start with the Group B patients, those who comprise the ‘HI Blk’ category. However, during the treatment protocol we have found a few multiple-test patients who have switched from one category to another, so we need to introduce some transition categories. The first five patients (ZY, AG, AQ, AA and AM) started in the ‘HI Blk’ group and remained there for the following tests. We call this transition category B→B. We also indicate by (f) or (m) the sex of each patient.
Patient ZY (f) started with all factors very low. She made good progress by test 2 but with TL OUT still low. She discontinued the far-infrared saunas, showed little further improvement, but enough to resume work part time.
Patient AG (f) had very low TL IN and %ATPinh at the start and made good improvement between tests 1 and 2, but both TL values dropped between tests 2 and 3. She was surprised that the results were worse on the 3rd test.
Patient AQ (f) had very low %ATPinh and TL IN at test 1. By test 2 ATPend and Ox Phos improved, and moved into the normal region by the 3rd test, but % ATPinh and TL IN are still low.
Patient AA (m) may be considered as the “ideal patient” - steady improvement to near normal in all measured quantities in less than 18 months.
Patient AM (f) made steady improvement from being housebound at test 1 to all factors being almost at the normal minimum by test 3, but the normalised product MESinh is still well below the normal minimum.
Patient AJ (f) shows a new effect, a switch from Group B to Group A2 with a super-normal value of TL IN. We label this switch as B→A2. Between test 1 and test 2 she made good progress in all quantities, and at test 3 she shows the switch to Group A2: ‘HI TL IN’. This patient is now back at work 4 days per week.
Patient AL (m) is an example of Group A2: ‘HI TL IN’ who had a super-normal value of TL IN at the first test which stayed high in spite of the facts that ATPend, Ox Phos, TL OUT and MESinh all moved into the normal region. We label this transition category A2→A2. Test 3 was not really necessary but the patient requested it. The super-normal values of TL IN suggest lack of substrate, but in spite of this all parameters are in the normal region for tests 2 and 3.
Patient ZZ (f) also started in Group A2: ‘HI TL IN’, but switched to Group A1: ‘no HIs’ by test 4 (we label this switch as A2→A1). The biomedical results of tests 2-4 may reflect the common situation where a patient improves and then overdoes things and suffers a relapse which takes some time to recover from. However, by test 4 all parameters and MESinh are in the normal region but most just barely.
Patient AO (m) started in Group A1: ‘no HIs’, and made some progress between the first and second tests, but was not pacing and discontinued the detoxifying saunas after 7 months. The test results illustrate the importance of these parts of the treatment protocol. We label this patient as category F: ‘poor regime’.
These multi-test results help us to understand the immediate sources of dysfunction and, when supplemented by other appropriate measurements, enable one of us (SM) to fine-tune the treatment protocol for individual patients. They also show that clinical improvement follows the pattern of switching from Group B to Group A2 and then to Group A1. That is to say, these patients move from being blocked to unblocked, and then from substrate deficiency to no substrate deficiency. These transitions indicate biochemical improvements. Some of these cases show that the treatment protocol needs to be maintained as time goes on. However, this may not be necessary in all cases.
Patients with 2 test results
Here we summarize the test results of all 34 multiple test patients including the 25 patients who have had the ATP profile test on just two occasions. For the patients with more than two tests we take the initial and final tests. The time interval between the first and final tests ranges from 5 to 67 months with an average of 30 months. We have considered removing the results at the long time intervals, e.g. beyond 48 months, but this just reduces the sample size without changing any conclusions. Because there are a number of cases where a patient makes a transition from one Group to another, we order them according to the relevant transition category (Table 1).
Table 1.
Transition categories of patients with two or more ATP Profile tests.
| Category label | Transition category properties and number of entries |
|---|---|
| B→B | Group B: ‘HI Blk’ for both initial and final tests (n=16) |
| i.e. patients who started and remain blocked | |
| B→A2 | Group B: ‘HI Blk’ at initial test but switch to A2: ‘HI TL IN’ by final test (n=5) |
| i.e. patients who move from blocked to unblocked but substrate deficient | |
| A2→A2 | Group A2: ‘HI TL IN’ for both initial and final tests (n=2) |
| i.e. patients with no blocking but remain substrate deficient | |
| A2→A1 | Group A2: ‘HI TL IN’ for initial test but switch to A1: ‘no HIs’ by final test (n=2) |
| i.e. patients who move from substrate deficient to substrate replete | |
| A1→A1 | Group A1: ‘no HIs’ for both initial and final tests (n=5) |
| i.e. patients who start and finish with no blocking in Group A1 | |
| F | ‘poor regime’ (n=4) |
| i.e. patients who failed to implement 2 or more aspects of the treatment protocol |
Besides the patients in transition category F: ‘poor regime’, there are also a number of patients who were lax in just one aspect of the treatment protocol. In view of the fact that they still improved they have been included in the other transition categories where appropriate. Below we will refer to patients in the first five transition categories combined (B→B to A1→A1) as ‘good regime’. Patients of category F: ‘poor regime’ constitute a small, but important, internal control group. They show that there is little or no improvement (and even deterioration) when the treatment regime is not fully followed.
The results (Figure 3) are further sorted in each transition category by increasing value of % ATPinh.
Figure 3.

Plots of ATPend, % ATPinh, Ox Phos, TL OUT, TL IN and MESinh for the 34 of 138 patients of Cohort 2 who have had two or more ATP Profile tests. We show results of the initial test (Test 1) and the last test (Test f). The transition categories are defined in Table 1.
In interpreting these results we first consider % ATPinh for transition category B→B, the first 16 entries in the second row. All these patients increased in %ATPinh to 80% or more of the normal minimum, with the largest increases (as much as a factor of 3) observed for the lowest initial values. We can conclude that the treatment protocol is very effective in minimising and even removing the blocking of the normal mitochondrial pathway of the Krebs cycle and oxidative phosphorylation via the electron transfer chain [1]. Looking down Figure 3 we see that these increases are associated with increases in TL IN except for patient ZD, but as a possible compensation this patient’s value of TL OUT increased into the normal region. All patients showed increased ATPend (first row) up to 80% or more of the normal minimum except ZG (and ZD who was already in the normal region). For Ox Phos (third row) all 16 patients improved with 8 (50%) ending up in the normal region and correlating with increases in ATPend. The changes in TL OUT are variable but most patients show small increases. For TL IN, 15 of 16 show increases, some by more than a factor of 2. Finally the MESinh values all increase, some dramatically, by on average a factor of 3.5.
All five B→A2 patients moved into the normal region of %ATPinh and all show increases in ATPend and especially in Ox Phos. The TL IN changes are dramatic, but changes in TL OUT are mixed and mainly small. All these five patients improved in MESinh by on average a factor of 7.9 but all still well below the normal minimum. This makes biochemical sense if blocking problems have been corrected but substrate deficiency has not been adequately addressed.
The two patients in Group A2: ‘HI TL IN’ for both tests (transition category A2→A2) show increases in ATPend, Ox Phos, TL OUT, and MESinh. Of the two patients who moved to Group A1: ‘no HIs’ (transition category A2→A1) ZA’s value of TL IN became normal but AW’s value became sub-normal, possibly because of no increase in TL OUT. MESinh shows ZZ moving into the normal region, but AW barely improving in any of the parameters.
The five Group A1: ‘no HIs’ patients (transition category A1→A1) all show increases in most parameters except TL IN which is mixed. One (AN) moves well into the normal region of MESinh and ZJ just to the edge, most likely limited by how the low value of TL IN affects other parameters.
Finally transition category F: ‘poor regime’ shows the four patients who were lax in two or more aspects of the treatment protocol. Most of their parameters stayed about the same or decreased.
In order to summarize these before and after results in a straightforward way we will consider just the main quantities ATPend, Ox Phos and MESinh and in particular how much they change between the initial and final tests. We do this for the 30 patients who have followed most of the demanding treatment regime (‘good regime’) and separately for the four ‘poor regime’ patients. The results are shown in Figure 4.
Figure 4.

Histograms of the changes in ATPend, Ox Phos and MESinh between the initial and final ATP Profile tests. The bins labelled ‘good regime’ are for the 30 patients who carefully followed the treatment protocol, and those labelled ‘poor regime’ are for the 4 patients who were lax in two or more aspects. In the ATPend plot (A) the two negative entries for the ‘good regime’ patients are due to slight decreases (of 1.9% and 3.7%), while the other 28 improved, and all ‘good regime’ patients improved in the Ox Phos (B) and MESinh (C) plots. The vertical dashed lines and circular markers show the corresponding mean values of each histogram and the horizontal error bars indicate the 95% confidence intervals of the means for the ‘poor regime’ and ‘good regime’ patients.
The ATPend histograms show that 28 out of the 30 ‘good regime’ patients improved in this quantity and there is a clear separation between the 95% confidence intervals (CIs) for the means of the ‘good regime’ and ‘poor regime’ categories. The Ox Phos and MESinh plots show that all 30 ‘good regime’ patients improved, and for MESinh by large values especially compared with the ‘poor regime’ patients. If we prefer, we can compute the mean increase in MESinhfor the ‘good regime’ patients relative to that for the ‘poor regime’ patients. The result is 64% (95% CI 50% to 78%).
The means and standard errors of the differences and ratios of the initial and final test measurements are summarized in Table 2 also for the other quantities: % ATPinh, TL OUT and TL IN.
Table 2.
Summary of differences and ratios of initial and final ATP profile test results
| Transition categories and mean time (spread) between initial (i) & final (f) tests | Quantities calculated from test results | Mean value* and SEM** | ||||
|---|---|---|---|---|---|---|
|
| ||||||
| ATPend | %ATPinh | Ox Phos | TL OUT | MESinh | ||
| B→B (n=16) | Difference | 19.6 | 26.6 | 27.5 | 8.0 | 40.4 |
| ‘HI Blk’ to ‘HI Blk’ | f - i | 3.1 | 4.2 | 3.7 | 4.4 | 4.2 |
| (Group B) | Ratio f/i | 1.26 | 1.55 | 1.46 | 1.12 | 3.52 |
| 27 (5 to 59) mo. | 0.04 | 0.16 | 0.08 | 0.05 | 0.83 | |
| B→A2 (n=5) | Difference | 11.1 | 48.6 | 36.8 | 7.1 | 35.7 |
| ‘HI Blk to ‘HI TL IN’ | f - i | 6.1 | 7.5 | 12.1 | 10.2 | 6.0 |
| (Group B to Group A2) | Ratio f/i | 1.16 | 2.02 | 2.57 | 1.19 | 7.92 |
| 37 (14 to 66) mo. | 0.10 | 0.41 | 0.95 | 0.20 | 3.57 | |
| A2→A2 and A2→A1 | Difference | 19.4 | -2.4 | 27.5 | 38.5 | 54.7 |
| and A1→A1 (n=9) | f - i | 4.4 | 3.5 | 6.4 | 8.7 | 15.9 |
| ‘HI TL IN’ & ‘no His’ | Ratio f/i | 1.25 | 0.98 | 1.41 | 1.59 | 3.13 |
| 36 (12 to 67) mo. | 0.06 | 0.03 | 0.11 | 0.14 | 0.69 | |
| All above (n=30) | Difference | 18.1 | 21.6 | 29.1 | 17.0 | 43.9 |
| ‘good regime’ | f - i | 2.3 | 4.2 | 3.3 | 4.6 | 5.3 |
| (Groups A1, A2 and B) | Ratio f/i | 1.24 | 1.46 | 1.63 | 1.27 | 4.14 |
| 30 (5 to 67) mo. | 0.03 | 0.12 | 0.17 | 0.07 | 0.79 | |
| F (n=4) | Difference | -7.4 | -1.5 | -8.5 | -14.0 | -20.2 |
| ‘poor regime’ | f -i | 4.4 | 5.5 | 2.5 | 8.0 | 5.0 |
| (internal control group) | Ratio f/i | 0.93 | 0.98 | 0.91 | 0.90 | 0.74 |
| 20 (15 to 27) mo. | 0.04 | 0.06 | 0.03 | 0.06 | 0.03 | |
The differences are given as % of the normal minimum while the ratios are dimensionless.
Standard error of the mean. The 95% confidence intervals are approximately given by the mean ± 2 SEM.
Comparison of 2-test nutrient status
In addition to the ATP Profile and Cell-free DNA tests, the majority of Cohort 2 patients have other tests relevant to cellular metabolism and mitochondrial dysfunction such as red cell Niacinamide (NAD, a marker of vitamin B3 status), L-carnitine (L-C) and coenzyme Q10 (CoQ10 or Ubiquinone). These auxiliary tests use red cells and plasma and are independent of the ATP Profile which uses neutrophils and their mitochondria. NAD and CoQ10 are important electron carriers in the ETC, and CoQ10 is also an important antioxidant. One important function of L-C is to transport fatty acids across mitochondrial membranes where the beta-oxidation process performs a vitally important part of the energy supply chain, particularly in cardiac muscle. Most of the L-C is in muscle but numerous studies have shown that the 1% that is in plasma correlates well with the whole body status.
We use the results of these and other auxiliary tests in order to find out where the biochemical lesions are so that the nutritional supplement part of the treatment regime can be tailored for each patient. Most patients have deficits in more than one of these co-factors. As an example, we show in Figure 5 a summary of the results of the initial and final measurements of NAD, L-C and CoQ10 for those multi-test patients who have had these tests.
Figure 5.
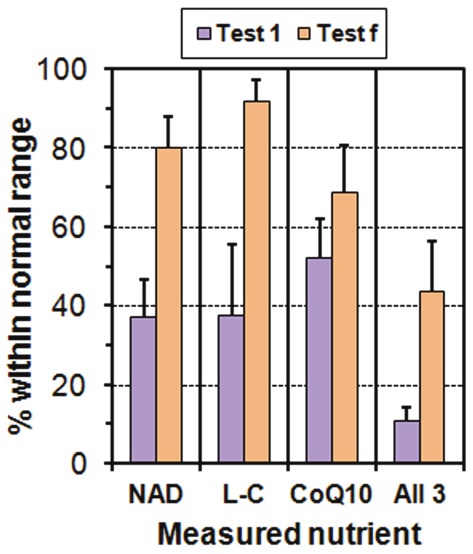
Chart showing percentage of patients with normal values of three of the essential co-factors involved in cellular ATP production: Niacinamide, L-Carnitine and CoQ10. For each co-factor we show the results (with binomial errors) from the initial test, Test 1 (before any therapeutic interventions), and the final test, Test f. We also show the percentage of patients who were in the normal region for all 3 co-factors.
We do not have a control group for these tests but we can use the well-established reference ranges (also, we use Biolab to perform the CoQ10 tests). In the initial test, only 40-50% of the patients have a value within the reference range of NAD or L-C or CoQ10, and between 1/5 and 1/3 of them are within the reference ranges for two of these quantities, but only 11% are within the reference ranges for all three quantities. For the final test, 44% have all three within the reference ranges, a substantial improvement.
We obtain similar results and conclusions for the important superoxide dismutase (SOD) antioxidants (4 measured quantities), and GSH and GSH-PX.
Comparison of 2-test ATP Profile results with Cell-free DNA
Of the 34 patients with two or more ATP Profile results there are 28 (including the four in transition category F) who have also had at least two tests of Cell-free DNA in plasma. As we showed in our paper on the pathophysiology [1], there are strong negative correlations of Cell-free DNA with ATPend and with Ox Phos and with MESinh and this suggests that the dysfunctions we observe in neutrophils also occur in other cells, because cell-free DNA reflects damage to cells of all types, not just neutrophils [5].
We find that for the ‘good regime’ patients, the mean increases in the ATP quantities on the scale shown in Figure 4 are accompanied by a decrease of Cell-free DNA. We illustrate this in Figure 6 where we show the mean changes in Cell-free DNA compared with the mean changes in Ox Phos for both ‘good regime’ and ‘poor regime’ patients. This shows that the therapeutic interventions provide marked improvement in both mitochondrial function and level of tissue damage.
Figure 6.
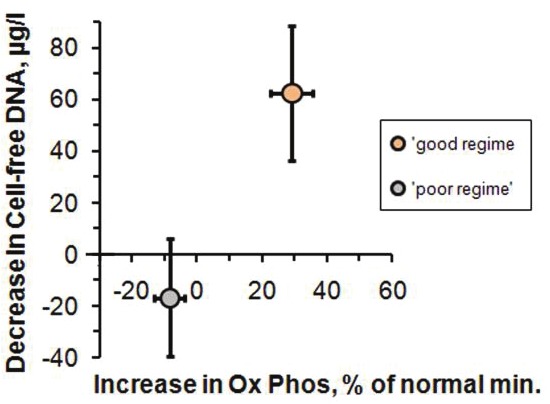
Plot of the mean value of the decrease in Cell-free DNA vs the mean value of the increase in Ox Phos for the 30 patients who had both Test 1 and Test f and followed the treatment regime, ‘good regime’, and for the 4 patients who did not rigorously follow the regime, ‘poor regime’. The error bars correspond to the 95% confidence intervals for the mean values.
Discussion
Efficacy of the treatment protocol
The most serious and frustrating shortcoming of this audit is that we have no follow-up results on 75% of the patients initially diagnosed with ME/CFS and who undertook the demanding treatment regime. This is due to the fact that this study is an audit and not a funded research project. Although some patients may not have continued the difficult regimes for any one of a number of reasons, the multiple-test results that we have on 34 of the 138 patients (25%) of Cohort 2 should represent at least an average, if not a lower limit, on the efficacy of the treatment protocol.
All 30 of the multiple test patients who followed the treatment protocol have increases in the major parameters of mitochondrial function and in the Mitochondrial Energy Score MESinh, some by as much as a factor of 20 and by an average of 44% on the 0 to 100% scale of Figures 1, 2, 3, 4 and 6. There is also a corresponding decrease in Cell-free DNA which suggests improved health [5].
Comparison with trials of nutrients
We may be open to criticism because we have not carried out a randomized controlled trial (RCT). This would be very difficult, if not impossible, with the multi-pronged and individualized treatment protocol that we use. However, a number of RCTs have been carried out on individual nutrients [19,25,26]. Nearly all RCTs include patients who have not been measurably deficient in the nutrient or remedy under trial, and other entrants may need it but also need one or more other nutrients. Such trials cannot yield useful results because repletion of one deficiency, when in the patient there are multiple deficiencies, simply creates another biochemical bottleneck. Because we measure levels of individual nutrients we have a good idea from the biomedical tests of which nutrients and supplements are needed for each patient. For example, we find that about 50% of the Cohort 2 patients have normal levels of CoQ10 at the initial test, but only about 10% have normal levels of all three of CoQ10, NAD and L-C (Figure 5). The only important nutrient (especially for Group B patients) that is not easily measureable is D-ribose, a moiety of the adenine nucleotides. However, one trial has been carried out [27]. Intracellular Mg is measured as part of the ATP profile and most patients have several other measurements carried out. As a result of the biochemical measurements, we can provide each patient with the most relevant combination of the nutrients and supplements that are deficient. Indeed it is self-evident that deficiencies need correcting. With repeat tests we can measure how well the nutrients have been absorbed and to what extent the biomedical lesions are improved. Practically none of the published RCTs have these capabilities and as a consequence most of their results are ambiguous or unreliable. A recent systematic review of RCTs confirms this, but also concludes that NADH and Mg have proven beneficial effects [19].
Other treatments
Many of our patients have tried a number of therapies without much success before contacting one of us (SM). So our patients are to some extent self-selected and really do have CFS/ME [2] or ME/CFS [3]. However, there are also people who have chronic fatigue for reasons that are not understood, and they may have some of the other symptoms of ME/CFS. At least some of these people can be helped by an integral approach which combines psychological and nutritional interventions [28]. There are also physical interventions which help some sufferers [29].
We feel obliged to comment on some other treatments and results, particularly those of the recent highly-publicized PACE trial [30]. This research trial compared four different treatments for CFS/ME: adaptive pacing therapy, cognitive behaviour therapy (CBT), graded exercise therapy (GET), and specialist medical care.
Fatigue is the symptom that patients experience when energy demand exceeds energy delivery. Correction of mitochondrial function addresses the issue of energy delivery. Attention to energy expenditure is also part of management, hence the importance of pacing of activity.
The pacing that we recommend to patients is NOT the adaptive pacing used in the PACE trial. We recommend the self-administered treatment which has been shown by a number of unpublished patient surveys to be an effective method of minimizing the severity of the symptoms of ME/CFS [31]. Biologically, pacing is expected not to make symptoms worse because it minimizes tissue damage by the effects of overexertion. Regarding CBT and GET which are favoured by PACE, we know of no proven mechanism by which either can ameliorate, let alone rectify, mitochondrial dysfunction, and in fact excessive exercise can result in further tissue damage. Finally, we note that the outcome measures described by the PACE authors as “moderate” are in fact miniscule in comparison to the improvements that we measure in our biomedical tests.
The claims in other studies for the efficacy of CBT and GET have already been reviewed and strongly criticized [32]. Another review documents the harms caused to patients by CBT and GET [33]. We can confidently state that no patient of Cohort 1 or Cohort 2 has reported any harm resulting from our prescribed treatments.
Children with ME/CFS
It has been known for many years that children and young people also suffer from ME/CFS and it is a major cause of extended absence from school [34]. A recent study in the UK on children in the age range 11-16 years has confirmed this [35]. We have not included children because we do not have a corresponding control group. We have therefore excluded a 14-year old from Cohort 1 and 4 children from Cohort 2 with ages 12-16. The ATP profile test results of these 5 children show that they have similar degrees of mitochondrial dysfunction to the adults. The authors of the recent UK study suggest that large scale trials of CBT and GET are needed. It is our conclusion that it is far more informative and cost-effective to perform an ATP Profile test and other relevant nutritional tests for each child. This would immediately identify the relevant biochemical lesions and allow appropriate tailored individual management regimes.
Conclusions
Mitochondrial function tests are a useful tool in managing ME/CFS patients for several reasons. They provide an objective measure of the level of clinical disability characterized by fatigue and, through measuring cell-free DNA, also of tissue damage. They clearly demonstrate that patients have serious biochemical pathology. These patients do not suffer from hypochondria - the problem is mitochondria.
Mitochondrial function tests identify the causes of the biochemical lesions which, for the most part, are immediately due to substrate deficiencies and blocking by endogenous or exogenous toxins.
In conjunction with routine measures of antioxidant status (superoxide dismutase, glutathione peroxidise and co-enzyme Q 10), the underlying pro-inflammatory aspects of ME/CFS are also addressed as part of the clinical work-up. Indeed there is an integral relationship between pro-inflammatory pathways and mitochondrial dysfunction. Poor mitochondrial function results in the production of inflammatory mediators via Pall’s NO/ONOO cycle [36]. Inflammatory mediators impact adversely on mitochondria and any such effect is potentiated further when there is poor antioxidant status [17,37-39]. We also note that a recent paper implicates mitochondrial deterioration in brain neurons via opportunistic infection [40]. This is consistent with our suggestion that cells other than neutrophils may suffer similar deficits in their ATP Profile.
Repeat tests are helpful in monitoring biochemical and clinical progress. For most patients, improvements in mitochondrial function test results are paralleled by clinical improvements. In the few patients where mitochondrial function test results improve but this is not paralleled clinically, the clinician must look for other causes of the fatigue and accompanying symptoms.
Finally, mitochondrial function tests do not constitute a diagnostic tool for chronic fatigue simply because the symptom of fatigue can result for many possible reasons. However in seriously afflicted ME/CFS patients, we find that poor mitochondrial function is invariably present as is a high level of cell-free DNA usually accompanied by poor anti-oxidant status.
Clinically we have found the mitochondrial function tests to be the single most useful diagnostic and therapeutic aid in the management of ME/CFS. They should be made available to all who need them.
Acknowledgment
We thank the patients and controls for their written permission to use their test results anonymously.
Conflicts of interest
None of the authors have conflict of interest in the measurements carried out on blood samples and any other aspects of this audit. Dr Myhill’s income arises from treating patients and full details of the treatment and management regime are freely available on the website www.doctormyhill.co.uk. Dr Booth is a retired academic physicist and contributes on a fully voluntary basis. Since his retirement from Biolab Medical Unit, Dr McLaren-Howard continues to carry out the ATP Profile and other biomedical tests at Acumen. All tests are based on published methods, and full details of the test procedures will be made available to anyone who is seriously interested by contacting acumenlab@hotmail.co.uk.
References
- 1.Booth NE, Myhill S, McLaren-Howard J. Mitochondrial Dysfunction and the Pathophysiology of Myalgic Encephalomyelitis/Chronic Fatigue Syndrome (ME/CFS) Int J Clin Exp Med. 2012;5:208–220. [PMC free article] [PubMed] [Google Scholar]
- 2.Fukuda K, Straus SE, Hickie I, Sharpe MC, Dobbins JG, Komaroff A. The chronic fatigue syndrome: a comprehensive approach to its definition and study. Ann Intern Med. 1994;121:953–959. doi: 10.7326/0003-4819-121-12-199412150-00009. [DOI] [PubMed] [Google Scholar]
- 3.Carruthers BM, van de Sande MI, De Meirleir KL, Klimas NG, Broderick G, Mitchell T, Staines D, Powles ACP, Speight N, Vallings R, Bateman L, Baumgarten-Austrheim B, Bell DS, Carlo-Stella N, Chia J, Darragh A, Jo D, Lewis D, Light AR, Marshall-Gradisbik S, Mena I, Mikovits JA, Miwa K, Murovska M, Pall ML, Stevens S. Myalgic encephalomyelitis: International Consensus Criteria. J Intern Med. 2011;270:327–338. doi: 10.1111/j.1365-2796.2011.02428.x. [DOI] [PMC free article] [PubMed] [Google Scholar]
- 4.Myhill S, Booth NE, McLaren-Howard J. Chronic fatigue syndrome and mitochondrial dysfunction. Int J Clin Exp Med. 2009;2:1–16. [PMC free article] [PubMed] [Google Scholar]
- 5.Wu T-L, Zhang D, Chia J-H, Tsao K-C, Sun C-F, Wu JT. Cell-free DNA: measurement in various carcinomas and establishment of normal reference range. Clin Chim Acta. 2002;321:77–87. doi: 10.1016/s0009-8981(02)00091-8. [DOI] [PubMed] [Google Scholar]
- 6.Brand MD, Nicholls DG. Assessing mitochondrial dysfunction in cells. Biochem J. 2011;435:297–312. doi: 10.1042/BJ20110162. [DOI] [PMC free article] [PubMed] [Google Scholar]
- 7.Peckerman A, Lamanca JJ, Dahl KA, Chemitiganti R, Qureishi B, Natelson BH. Abnormal impedance cardiography predicts symptom severity in chronic fatigue syndrome. Amer J Med Sci. 2003;326:55–60. doi: 10.1097/00000441-200308000-00001. [DOI] [PubMed] [Google Scholar]
- 8.Streeten D, Thomas D, Bell DS. The Roles of Orthostatic Hypotension, Orthostatic Tachycardia, and Subnormal Erythrocyte Volume in the Pathogenesis of the Chronic Fatigue Syndrome. Amer J Med Sci. 2000;320:1–8. doi: 10.1097/00000441-200007000-00001. [DOI] [PubMed] [Google Scholar]
- 9.Hollingsworth KG, Hodgson T, MacGowan GA, Blamire AM, Newton JL. Impaired Cardiac Function in Chronic Fatigue Syndrome measured using Magnetic Resonance Cardiac Tagging. J Intern Med. 2012;271:264–270. doi: 10.1111/j.1365-2796.2011.02429.x. [DOI] [PMC free article] [PubMed] [Google Scholar]
- 10.Hurwitz BE, Coryell VT, Parker M, Martin P, La-Perriere A, Klimas NG, Sfakianakis GN, Bilsker MS. Chronic fatigue syndrome: illness severity, sedentary lifestyle, blood volume and evidence of diminished cardiac function. Clin Sci. 2010;118:125–135. doi: 10.1042/CS20090055. [DOI] [PubMed] [Google Scholar]
- 11.Miwa K, Fujita M. Small Heart With Low Cardiac Output for Orthostatic Intolerance in Patients With Chronic Fatigue Syndrome. Clin Cardiol. 2011;34:782–786. doi: 10.1002/clc.20962. [DOI] [PMC free article] [PubMed] [Google Scholar]
- 12.Yoshiuchi K, Farkas J, Natelson BH. Patients with chronic fatigue syndrome have reduced absolute cortical blood flow. Clin Physiol Funct Imaging. 2006;26:83–86. doi: 10.1111/j.1475-097X.2006.00649.x. [DOI] [PubMed] [Google Scholar]
- 13.Marieb EN. Essentials of Human Anatomy and Physiology. Pearson Education; 2009. [Google Scholar]
- 14.Puddu P, Puddu GM, Galletti L, Cravero E, Muscari A. Mitochondrial Dysfunction as an Initiating Event in Atherogenesis: A Plausible Hypothesis. Cardiology. 2005;103:137–141. doi: 10.1159/000083440. [DOI] [PubMed] [Google Scholar]
- 15.Anthony H, Birtwistle S, Eaton K, Maberly J. Environmental Medicine in Clinical Practice. Br Soc Allergy and Environmental Medicine. 2002 [Google Scholar]
- 16.Fosslien E. Mitochondrial Medicine - Molecular Pathology of Defective Oxidative Phosphorylation. Ann Clin Lab Sci. 2001;31:25–67. [PubMed] [Google Scholar]
- 17.Orsucci D, Filosto M, Siciliano G, Mancuso M. Electron transfer mediators and other metabolites and cofactors in the treatment of mitochondrial dysfunction. Nutr Rev. 2009;67:427–438. doi: 10.1111/j.1753-4887.2009.00221.x. [DOI] [PubMed] [Google Scholar]
- 18.Werbach MR. Nutritional Strategies for Treating Chronic Fatigue Syndrome. Altern Med Rev. 2000;5:93–108. [PubMed] [Google Scholar]
- 19.Alraek T, Lee MS, Choi TY, Cao H, Liu J. Complementary and alternative medicine for patients with chronic fatigue syndrome: a systematic review. BMC Complement Altern Med. 2011;11:87. doi: 10.1186/1472-6882-11-87. [DOI] [PMC free article] [PubMed] [Google Scholar]
- 20.Myhill S. Diagnosing and treating chronic fatigue syndrome. Knighton: Sarah Myhill Ltd; 2012. <http://www.doctormyhill.co.uk/wiki/CFS_-_CFS_Book_published_by_Dr_Sarah_Myhill>. (last accessed 2012-08-09) [Google Scholar]
- 21.Turner MR, Talbot K. Functional vitamin B12 deficiency. Pract Neurol. 2009;9:37–45. doi: 10.1136/jnnp.2008.161968. [DOI] [PubMed] [Google Scholar]
- 22.Matsushita K, Masuda A, Tei C. Efficacy of Waon Therapy for Fibromyalgia. Inter Med. 2008;47:1473–1476. doi: 10.2169/internalmedicine.47.1054. [DOI] [PubMed] [Google Scholar]
- 23.Beever R. Far-infrared saunas for treatment of cardiovascular risk factors: Summary of published evidence. Can Fam Physician. 2009;55:691–696. [PMC free article] [PubMed] [Google Scholar]
- 24.Crinnion W. Sauna as a valuable clinical tool for cardiovascular, autoimmune, toxicant- induced and other chronic health problems. Altern Med Rev. 2011;16:215–225. [PubMed] [Google Scholar]
- 25.Marriage B, Clandinin MT, Glerum DM. Nutritional cofactor treatment in mitochondrial disorders. J Amer Diet Assoc. 2003;103:1029–1038. doi: 10.1016/s0002-8223(03)00476-0. [DOI] [PubMed] [Google Scholar]
- 26.Marriage BJ, Clandinin MT, Macdonald IM, Glerum DM. Cofactor treatment improves ATP synthetic capacity in patients with oxidative phosphorylation disorders. Mol Genet Metab. 2004;81:263–272. doi: 10.1016/j.ymgme.2003.12.008. [DOI] [PubMed] [Google Scholar]
- 27.Teitelbaum J, Jandrain J, McGrew R. Treatment of Chronic Fatigue Syndrome and Fybromyalgia with D-Ribose - An Open-label Multicenter Study. Open Pain J. 2012;5:32–37. [Google Scholar]
- 28.Howard A, Arroll M. The Application of Integral Medicine in the Treatment of Myalgic Encephalomyelitis/Chronic Fatigue Syndrome. J Integral Theory & Practice. 2011;6:25–40. [Google Scholar]
- 29.Perrin R. The Perrin Technique. London: Hammersmith Press; 2007. [Google Scholar]
- 30.White PD, Goldsmith KA, Johnson AL, Potts L, Walwyn R, DeCesare JC, Baber HL, Burgess M, Clark LV, Cox DL, Bavinton J, Angus BJ, Murphy G, Murphy M, O'Dowd H, Wilks D, McCrone P, Chalder T, Sharpe M. Comparison of adaptive pacing therapy, cognitive behaviour therapy, graded exercise therapy, and specialist medical care for chronic fatigue syndrome (PACE): a randomised trial. Lancet. 2011;377:823–836. doi: 10.1016/S0140-6736(11)60096-2. [DOI] [PMC free article] [PubMed] [Google Scholar]
- 31.Goudsmit EM, Nijs J, Jason LA, Wallman KE. Pacing as a strategy to improve energy management in myalgic encephalomyelitis/chronic fatigue syndrome: a consensus document. Disability and Rehabilitation. 2012;34:1140–1147. doi: 10.3109/09638288.2011.635746. [DOI] [PubMed] [Google Scholar]
- 32.Twisk FN, Maes M. A review on cognitive behavioural therapy (CBT) and graded exercise therapy (GET) in myalgic encephalomyelitis (ME)/ chronic fatigue syndrome (CFS): CBT/GET is not only ineffective and not evidence-based, but also potentially harmful for many patients with ME/CFS. Neuroendocrinol Lett. 2009;30:284–299. [PubMed] [Google Scholar]
- 33.Kindlon T. Reporting of Harms Associated with Graded Exercise Therapy and Cognitive Behavioural Therapy in Myalgic Encephalomyelitis/Chronic Fatigue Syndrome. Bull IACFS/ME. 2011;19:59–111. [Google Scholar]
- 34.Dowsett EG, Colby J. Long-term sickness absence due to ME/CFS in UK schools: an epidemiological study with medical and educational implications. J Chronic Fatigue Syndr. 1997;3:29–42. [Google Scholar]
- 35.Crawley EM, Emond AM, Sterne JAC. Unidentified Chronic Fatigue Syndrome/myalgic encephalomyelitis (CFS/ME) is a major cause of school absence: surveillance outcomes from school-based clinics. BMJ Open. 2011;1:e000252. doi: 10.1136/bmjopen-2011-000252. [DOI] [PMC free article] [PubMed] [Google Scholar]
- 36.Pall ML. Elevated, sustained peroxynitrite levels as the cause of chronic fatigue syndrome. Med Hypotheses. 2000;54:115–125. doi: 10.1054/mehy.1998.0825. [DOI] [PubMed] [Google Scholar]
- 37.Zeevalk GD, Bernard LP, Song C, Gluck M, Ehrhart J. Mitochondrial inhibition and oxidative stress: Reciprocating players in neurodegeneration. Antioxid Redox Signal. 2005;7:1117–1139. doi: 10.1089/ars.2005.7.1117. [DOI] [PubMed] [Google Scholar]
- 38.Golomb BA. Oxidative Stress and Mitochondrial Injury in Chronic Multisystem Conditions:From Gulf War Illness to Autism Spectrum Disorder. 2012. Available from Nature Precedings <http://hdl.handle.net/10101/npre.2012.6847.1>. [Google Scholar]
- 39.Shungu DC, Weiduschat N, Murrough JW, Mao X, Pillemer S, Dyke JP, Medow MS, Natelson BH, Stewart JM, Mathew SJ. Increased ventricular lactate in chronic fatigue syndrome. III. Relationships to cortical glutathione and clinical symptoms implicate oxidative stress in disorder pathophysiology. NMR Biomed. 2012;25:1073–1087. doi: 10.1002/nbm.2772. [DOI] [PMC free article] [PubMed] [Google Scholar]
- 40.Nishihara K. Disclosure of the major causes of mental illness-mitochondrial deterioration in brain neurons via opportunistic infection. J Biol Phys & Chem. 2012;12:11–18. [Google Scholar]