

Abstract
ALDH1A1 metabolizes a variety of endogenous and exogenous aldehyde, and also oxidizes retinol to synthesize retinoic acid and modulate cell differentiation. Moreover, ALDH1A1 is also suggested to participate in the maintenance of cancer stem cells. To investigate the potential role of ALDH1A1 in carcinogenesis of the lung, the present study examined two hundred and sixty eight cases of non-small cell lung carcinoma (NSCLC) for its immunohistochemical expression and analyzed associations between ALDH1A1 levels and a series of clinicopathologic parameters. Also, the biological significance of the aberrant expression of ALDH1A1 was investigated in vitro. ALDH1A1 expression was markedly reduced in 39.9% (107/268) of NSCLCs. The incidence of this reduction was significantly higher in adenocarcinomas (ADC: 41.6%, 85/207) and large cell carcinomas (61.1%, 11/18) than squamous cell carcinomas (25.5%, 11/43). Among ADCs, the downregulation tended to be more remarkable in high grade, poorly differentiated tumors, and tumors with stronger proliferating activity. It also occurred with a significantly higher incidence in smokers than non-smokers. Forced expression of ALDH1A1 in NSCLC cell lines, which had lost ALDH1A1 expression, markedly attenuated their growth. Taken together, loss of ALDH1A1 expression is suggested to promote carcinogenesis especially in the smoking-related ADCs.
Keywords: Non-small cell lung carcinoma, ALDH1A1, immunohistochemistry, tumor suppressor, smoking, cancer stem cell
Introduction
Lung cancer is one of the most common causes of cancer-related deaths in the developed world [1,2]. Even in the early stages of the disease, a substantial proportion of patients die due to recurrent disease (the 5-year survival rate is 66.0–83.9% in stage IA and 53.0–66.3% in stage IB among non-small cell lung carcinomas (NSCLC)) [3-5]. Understanding the molecular basis of its development and expansion is an important task for developing a novel therapeutic strategy.
The ALDH superfamily represents a divergent group of enzymes that metabolize and detoxify a wide variety of endogenous and exogenous aldehyde, and also oxidize retinol to synthesize retinoic acid, an important modulator of cell differentiation [6,7]. On the other hand, ALDH, especially ALDH1A1, activity and/or antigen expression have been demonstrated to be strong in stem cell fractions in a variety of cancers [8-13], suggesting that ALDH1A1 participates in the maintenance of cancer stem cells. Thus, ALDH1A1 could play diverse roles in carcinogenesis.
Our preliminary experiment examining the expression of ALDH1A1 in NSCLCs revealed that neoplastic cells tended to reduce the level of its immunohistochemical expression compared to the non-neoplastic count part (bronchial and alveolar epithelial cells). The finding implied that ALDH1A1 could act as a tumor suppressor, and prompted us to further investigate its potential involvement in carcinogenesis of the lung. The present study examined two hundred and sixty eight cases of NSCLC for the expression of ALDH1A1 and analyzed associations between ALDH1A1 levels and clinicopathologic parameters. Also, the potential molecular mechanism for and biological significance of the aberrant expression of ALDH1A1 were investigated in vitro.
Materials and methods
Primary lung cancer
All 268 tumors examined (207 adenocarcinomas (ADCs), 43 squamous cell carcinomas (SQCs), and 11 large cell carcinomas (LCCs)) were removed by radical surgical resection at Kanagawa Cardiovascular and Respiratory Center. Informed consent for research use of the resected materials was obtained from all the subjects. Disease stage was determined according to the international TNM classification system (seventh edition of UICC) [14]. The detailed clinical information for 177 cases of ADC at the pathologic disease stage I used for survival analyses was described as follows. Among the One-hundred-and-twenty-one cases (68.4%) were in stage IA and 56 (31.6%) were in stage IB. Lobectomy and segmentectomy were performed on 157 and 7 patients, respectively, which along with systemic lymphadenectomy, extended to the hilar and mediastinal lymph nodes. Thirteen patients (7.3%) underwent wedge resection along with intra-operative lymph-node sampling. A follow-up evaluation was performed every 2 months for the first 2 years after the operation, every 3 months in the third year, and every 6 months thereafter. The evaluation included physical examinations and chest radiography. Screening for serum tumor markers, computed tomography of the thorax and upper abdomen, and magnetic resonance imaging of the brain were conducted every 6 months for the first 3 years, and every 12 months thereafter. The median follow-up period was 35.9 (range, 1.1–82.5) months. Disease recurrence was found in 18 of 177 patients (10.2%), of whom 15 (8.5%) were affected by distant metastasis. Twelve patients (6.8%) died during the follow-up period, and the five-year overall survival (OS) rate was 91.5%. The median disease-free span of patients with recurrent disease was 12.0 months (range, 3.8–49.1 months). None of the patients received radiotherapy or chemotherapy preoperatively. None of the patients with stage IA disease, and 18 patients with stage IB disease, received postoperative adjuvant chemotherapy (3 patients received cisplatin or carboplatin-based chemotherapy, and 15 received oral uracil-tegafur chemotherapy). The 5-year disease-free survival (DFS) rate was 78.7% for the non-adjuvant IB patients vs. 70.0% for adjuvant IB patients (P=0.4806).
Immunohistochemistry
The largest tumor sections were cut from formalin-fixed, paraffin-embedded tissue blocks. The sections were deparaffinized, rehydrated, and incubated with 3% hydrogen peroxide, followed by 5% goat serum to block endogenous peroxidase activities and non-immunospecific protein binding. The sections were boiled in citrate buffer (0.01 M, pH 6.0) for 15 minutes to retrieve masked epitopes and then incubated with a primary antibody against ALDH1A1 (Abcam, Cambridge, UK) or Ki-67 (DAKO, Ely, UK). Immunoreactivity was visualized using an Envision detection system (DAKO), and the nuclei were counterstained with hematoxylin. Immunohistochemical expression of ALDH1A1 was evaluated by a scoring system as is described in the results section. The labeling index of MIB1 was calculated as the proportion of positive cells by counting 500–1000 cancer cells. A Ki-67 labeling index of <10% and ≥10% was taken to indicate low and high level, respectively, according to the results of our previous study [15].
Analysis of oncogenic mutations
Hematoxylin and eosin-stained tissue sections were checked microscopically. If a tumor was medullary, the tumorous and non-tumorous parts were macroscopically dissected with a razor blade. If a tumor contained abundant interstitial tissue, the tumorous part was captured using the PALM-MCB laser micro-dissection system (Carl Zeiss, Jena, Germany). The method of DNA extraction from formalin-fixed, paraffin-embedded tissue sections was previously described [16]. Fragments of EGFR (exon 19 and 21) and KRAS (exon 2) were PCRamplified and subjected to a cycle dye-terminator reaction. Primer sets and reagents used for PCR and DNA sequencing, were described elsewhere [16].
Statistical analysis
The possible associations between ALDH1A1 levels and various parameters were analyzed using Chi-square test. Differences in the means of the averaged scores among groups classified according to various clinicopathologic subjects were analyzed with Student’s t test or one-way ANOVAs. The recurrence curves were plotted using the Kaplan-Meier method, and the absolute risk of recurrence at five years was estimated from the curves. The post-operative disease-free span was defined as the period from the date of surgery to the date when the recurrence of disease was diagnosed. An observation was censored at the last follow-up if the patient was alive or had died of a cause other than lung cancer. Differences in the disease-free survival (DFS) span and rate were analyzed using the log-rank test. Hazard ratios and 95% confidential interval (CI) were calculated using Cox’s proportional hazards model. P values less than 0.05 were considered significant. All statistical analyses were performed using SPSS software (SPSS for Windows Version 10.0; SPSS; Chicago, IL, USA).
Cell lines and culture
An immortalized human airway epithelial cell line (16HBE14o, Simian virus 40 (SV40)-transformed human bronchial epithelial cells) described by Cozens AL et al. [17] was kindly provided by Grunert DC (California Pacific Medical Center Research institute). A sub-clone of 16HBE14o cells, described as NHBE-T in this paper, was used for experiments. Human lung cancer cell lines (A549, H358, H2087, H23, EKVX, H226, H827, H1819, H441, H4006, HOP62 H1299 and H460) and a human embryonic kidney cell line (HEK293T) were purchased from American type culture collection (ATCC, Manassas, VA). The human lung cancer cell line LC2/ad was purchased form Riken cell bank (Tsukuba, Japan). Human lung cancer cells, PC1, PC9 and HARA were from Immuno-Biological laboratories Co. (Gunma, Japan). Human lung cancer cell lines, TKB1, TKB2, TKB4, TKB5, TKB6, TKB7, TKB8, TKB14, and TKB20, were obtained from Dr. Kamma H via Dr. Yazawa T (Kyorin University School of Medicine). Primary small airway epithelial cells (SAEC) were purchased from SANKO Kagaku (Tokyo, Japan).
Western blotting
Whole cell protein lysate was prepared as described elsewhere [18], and subjected to SDS-polyacrylamide gel electrophoresis, and transferred onto PVDF membranes (Amersham, Piscataway, NJ). The membranes were incubated with nonfat dry milk in Tris-buffered saline containing Tween-20 (TBS-T) to block non-immunospecific protein binding, and then with primary antibody against ALDH1A1 (Abcam) or b-actin (Sigma, St. Louis, MO). After washing with TBS-T, the membranes were incubated with animal-matched HRP-conjugated secondary antibodies (Amersham). Immunoreactivity was visualized with the enhanced chemiluminescence system (ECL, Amersham).
Quantitative RT-PCR
First-strand cDNA was synthesized from total RNA using the SuperScript First-Strand Synthesis System according to the protocols of the manufacturer (Invitrogen, Carlsbad, CA). The cDNA generated was used as a template in real-time PCR with SYBR Premix EXTaq (Takara, Kyoto, Japan) and run on a Thermal Cycler DICE real-time PCR system (Takara). The primer set used for the detection of ALDH1A1 was F, 5’-AGTGCCCCTTTGGTGGATTC; R, 5’- AAGAGCTTCTCTCCACTCTTG. That for GAPDH was F, 5’- GGTCGTATTGGGCGCCTGGT; R, 5’- TACTCAGCGCCAGCATCGCC. The means and standard deviations of the copy number of ALDH1A1 normalized to the value for ACTB mRNA were statistically obtained from triplicate reactions.
Treatment with 5-azacytidine and trichostatin A
To validate the potential involvement of the epigenetic molecular modification in the reduction of ALDH1A1 level, cells were treated either with a DNA methyltransferase inhibitor (10 μM of 5-azacytidine (Sigma)) for 72 hours by exchanging the medium everyday or with a histone deacetylase inhibitor (300 ng/ml of trichostatin A (Wako, Osaka, Japan)) for 24 hours. In addition, cells were treated also with 5-azacytidine for 48 hours and then with a combination of 5-azacytidine and trichostatin A for an additional 24 hours.
Plasmid construction
The ALDH1A1 cDNA (NM_000689) was PCR-amplified and inserted into pro-retrovirus vector pQCXIP (BD Clontech, Palo Alto, CA). Vectors bearing a sense and antisense strand of cDNA were obtained.
Retroviral-mediated gene transfer
The pQCXIP-based expression vectors and the pCL10A1 retrovirus-packaging vector (IMGE-NEX, San Diego, CA) were cotransfected into HEK293T cells with Lipofectoamine 2000 reagent (Invitrogen). At 24 hours after the transfection, conditioned medium was recovered as a viral solution. Desired genes were introduced by incubating cells with the viral solution containing 10 μg/ml of polybren (Sigma) for 24 hours. Cells stably expressing desired genes were selected with 5.0 μg/ml of Puromycin (Invitrogen) for 3 days. The pooled clones were used for biological analyses as follows.
Colony formation assays
The puromycin-cells (1.0×10⁴ or 5.0×10⁴) were seeded onto a 10 cm culture dish (Iwaki, Tokyo, Japan), and grown for 10 days. The cells were fixed with methanol and Giemsa-stained, and colonies visible in scanned photographs were counted.
Growth curve assays
Cells (2.5×10⁵) were seeded onto a 10 cm culture dish, and grown to a semi-confluent state. The cells were counted, and 2.5×10⁵ cells were seeded again onto a 10 cm dish. Several passages were repeated in the same manner. The cumulating population doubling was plotted.
Results
Immunohistochemical expression of ALDH1A1 in primary NSCLCs
Non-cancerous airway epithelial cells, both the bronchial, bronchiole and alveolar epithelial cells, exhibited strong immunohistochemical expression of ALDH1A1 protein in their cytoplasm (Figure 1A). Neoplastic cells expressed it at various levels among individual cases and individual neoplastic cells. Some showed a strong level equivalent to that of non-cancerous epithelia (Figure 1A), and others showed only a faint level (Figure 1A) or almost lost its expression (Figure 1A). The intensity of immunohistochemical signals was classified as negative (point 0), faint (point 0.5), and strong (point 1). A strong level was defined as similar to that in bronchial epithelial cells. A faint level was defined as an unequivocally weaker signal. The expression score was calculated as the averaged point. For example, if a tumor consisted of components of 20% of negative (0), 50% of faint (1), and 30% of strong (2) expresser, a expression score was calculated as (20×0 + 50×0.5 + 30×1) = 55. Scores of < 10 and ≥ 10 were classified as low and high, respectively. The expression scores of all the tumors examined were plotted (Figure 1B).
Figure 1.

Immunohistochemical expression of ALDH1A1: A. Representative photographs of non-cancerous airway epithelia (upper panels; bronchus, bronchiole and alveolus) and lung cancers (middle panels; adenocarcinoma (ADC), lower panels, squamous cell carcinoma (SQC)). A strong level was defined as a level similar to that in bronchial epithelial cells. A faint level was defined as an unequivocally weaker signal. Magnifications are ×200 in each. B. The expression score was calculated as a percentile of the averaged point. The expression scores of all tumors examined were plotted. Scores of < 10 and ≥ 10 (threshold, dashed line) were classified as low and high, respectively. NC, non-cancerous airway epithelia, such as bronchus, bronchiole, and alveolus; NSCLC, non-small cell lung carcinoma.
Association with clinicopathologic parameters in whole NSCLCs
ALDH1A1 expression tended to be lower among smokers (Table 1). The proportion of ALDH1A1 low expressers was larger among smokers than non-smokers (Table 1). Brinkman index (smoking index, cigarette smoking/day × years) was significantly higher among low expressers than high expressers (Table 1). ALDH1A1 scores were also associated with tumor histology. The average score was significantly lower in ADCs and LCCs than those SQCs (Figure 1B and Table 1). The score decreased in parallel with the dedifferentiation process, as a large proportion of poorly differentiated neoplasms exhibited significantly lower scores of ALDH1A1 than well and moderately differentiated neoplasms (Table 1). Moreover, ALDH1A1 score inversely correlated with the growth activity of neoplastic cells measured by Ki-67 immunohistochemical labeling (Table 1). No significant association between the score and age, sex, T factor, N factor, or disease stage was found (Table 1).
Table 1.
Correlation between ALDH1A1 expression and clinicopathologic parameters in NSCLCs
| Low | High | Score (Mean ± SD) | |
|---|---|---|---|
| Age (268) | Chi square test, P = 0.0530 | Student’s t test, P = 0.5598 | |
| Older (181) | 65 (35.9%) | 116 (64.1%) | 42.8 ± 37.6 |
| Younger (87) | 42 (48.3%) | 45 (51.7%) | 39.9 ± 39.9 |
| Gender (268) | Chi square test, P = 0.0794 | Student’s t test, P = 0.4162 | |
| Male (158) | 70 (42.4%) | 88 (57.6%) | 44.1 ± 37.7 |
| Female (110) | 37 (32.7%) | 73 (67.3%) | 39.7 ± 38.7 |
| Smoking History (244) | Chi square test, P = 0.0120 | Student’s t test, P = 0.3440 | |
| Smoker (140) | 68 (48.6%) | 72 (51.4%) | 38.8 ± 49.2 |
| Non-somoker (104) | 34 (33.7%) | 70 (66.3%) | 43.5 ± 37.5 |
| Student’s t test, P = 0.0164 | |||
| Brinkman Index (244) | 692 ± 637 | 494 ± 637 | |
| T factor (268) | Chi square test, P = 0.1640 | ANOVA, not significant in any | |
| T1 (179) | 66 (27.8%) | 113 (72.2%) | 42.9 ± 38.2 |
| T2 (83) | 40 (48.8%) | 43 (51.2%) | 38.2 ± 38.8 |
| T3 (3) | 1 (33.3%) | 2 (66.7%) | 44.4 ± 41.7 |
| T4 (3) | 0 (0.0%) | 3 (100.0%) | 80.6 ± 14.4 |
| N factor (265) | Chi square test, P = 0.2144 | ANOVA, not significant in any | |
| N0 (246) | 97 (39.4%) | 149 (60.6%) | 42.9 ± 38.2 |
| N1 (6) | 2 (33.3%) | 4 (66.7%) | 42.0 ± 35.8 |
| N2 (12) | 6 (50.0%) | 6 (50.0%) | 39.6 ± 40.0 |
| N3 (1) | 1 (100.0%) | 0 (0.0%) | 0.0 ± 0.0 |
| Stage (268) | Chi square test, P = 0.5388 | ANOVA, not significant in any | |
| I (248) | 97 (39.1%) | 151 (60.9%) | 42.2 ± 38.4 |
| II (5) | 2 (40.0%) | 3 (60.0%) | 40.3 ± 41.1 |
| III (14) | 7 (50.0%) | 7 (50.0%) | 39.0 ± 39.4 |
| IV (1) | 1 (100.0%) | 0 (0.0%) | 3.3 ± 0.0 |
| Histology (268) | Chi square test, P = 0.0278 | ||
| ADC (207) | 85 (41.6%) | 122 (58.4%) | ANOVA, *significant in some |
| SQC (43) | 11 (25.5%) | 32 (74.5%) | 39.8 ± 37.9 |
| LCC (18) | 11 (61.1%) | 7 (38.9%) | 58.7 ± 37.4 |
| Grade (268) | Chi square test, P = 0.0180 | ANOVA, #significant in some | |
| WEL (129) | 43 (33.3%) | 86 (66.7%) | 44.4 ± 38.2 |
| MOD (79) | 31 (39.2%) | 48 (60.8%) | 46.1 ± 39.4 |
| POR (60) | 33 (55.0%) | 27 (45.0%) | 30.9 ± 38.2 |
| Growth activity (268) | Chi square test, P = 0.0273 | Student’s t test, P = 0.1989 | |
| High (151) | 69 (45.7%) | 82 (54.3%) | 38.9 ± 38.2 |
| Low (117) | 38 (32.5%) | 79 (67.5%) | 45.0 ± 39.3 |
NSCLCs, non-small cell lung carcinomas; ADC, adenocarcinoma; SQC, squamous cell carcinoma; LCC, large cell carcinoma; WEL, well differentiated; MOD, moderately differentiated; POR, poorly differentiated carcinomas; Older, defined as more than 65 years-old; Growth activity high, defined as tumors with MIB1 labeling index equial to or more than 10%.
ADC versus SQC (P = 0.0032); LCC versus SQC (P = 0.0022);
WEL versus POR (P = 0.0222); #MOD versus POR (P = 0.0207).
Association with clinicopathologic parameters in ADCs
ALDH1A1 expression tended to be lower among males and smokers (Table 2). The proportion of low expressers was larger for males/smokers than females/non-smokers (Table 2). The Brinkman index was significantly higher among low than high expressers (Table 2). ALDH1A1 score were also associated with histological subtypes. The average score was significantly lower than those in papillary and solid subtypes (Table 2). The scores also decreased in parallel with the dedifferentiation process, as a large proportion of poorly differentiated ADCs exhibited significantly lower scores than well and moderately differentiated ADCs (Table 2). Moreover, the ALDH1A1 scores inversely correlated with growth activity of neoplastic cells measured by Ki-67 immunohistochemical labeling (Table 2). No significant association between the score and age, T factor, N factor, disease stage, or oncogene mutations (One hundred forty nine ADCs were availably examined. Among, 32 EGFR mutation (19 deletiontype mutations in exon 19 and 13 t2573g [L858R] point mutations in exon 21) and 26 KRAS mutations (12 g34t [G12C], 8 g35t [G12V], 4 g35a [G12D], 2 g35c [G12A]) were found). Among KRAS mutations, was found (Table 2). Moreover, in stage I disease, there was no significant association between the ALDH1A1 expression and 5-year DFS (94.3% in ALDH1A1 low expresser versus 82.1% in high expresser) (Figure 2), recurrent rate (5.5% (2/74) in ALDH1A1 low expresser versus 13.5% 14/104) in high expresser, P = 0.084) or recurrent risk (hazard ratio 2.36 in ALDH1A1 high expresser, 95% CI 0.78-7.17, P = 0.119).
Table 2.
Correlation between ALDH1A1 expression and clinicopathologic parameters in adenocarcinomas
| Low | High | Score (Mean ± SD) | |
|---|---|---|---|
| Age (207) | Chi square test, P = 0.0683 | Student’s t test, P = 0.6864 | |
| Older (132) | 48 (36.4%) | 84 (63.6%) | 40.6 ± 37.1 |
| Younger (75) | 34 (33.3%) | 38 (50.7%) | 38.4 ± 39.3 |
| Gender (207) | Chi square test, P = 0.0347 | Student’s t test, P = 0.1776 | |
| Male (106) | 51 (48.1%) | 55 (51.9%) | 36.3 ± 38.0 |
| Female (101) | 34 (33.7%) | 67 (66.3%) | 43.4 ± 37.6 |
| Smoking History (194) | Chi square test, P = 0.0080 | Student’s t test, P = 0.1406 | |
| Smoker (92) | 48 (52.2%) | 44 (47.8%) | 34.6 ± 37.2 |
| Non-smoker (102) | 34 (33.3%) | 58 (66.7%) | 42.6 ± 38.2 |
| Student’s t test, P = 0.0246 | |||
| Brinkman Index (194) | 567 ± 603 | 383 ± 631 | |
| T factor (207) | Chi square test, P = 0.3121 | ANOVA, not significant in any | |
| T1 (138) | 54 (27.8%) | 84 (72.2%) | 39.2 ± 37.2 |
| T2 (66) | 30 (27.8%) | 36 (72.2%) | 40.4 ± 39.5 |
| T3 (1) | 1 (100.0%) | 0 (0.0%) | 3.3 ± 0.00 |
| T4 (2) | 0 (0.0%) | 2 (100.0%) | 79.2 ± 20.0 |
| N factor (205) | Chi square test, P = 0.3153 | ANOVA, not significant in any | |
| N0 (195) | 97 (39.4%) | 149 (60.6%) | 40.1 ± 37.8 |
| N1 (1) | 2 (33.3%) | 4 (66.7%) | 0.0 ± 0.0 |
| N2 (9) | 6 (50.0%) | 6 (50.0%) | 38.3 ± 42.4 |
| Stage (207) | Chi square test, P = 0.2860 | ANOVA, not significant in any | |
| I (196) | 78 (39.8%) | 118 (60.2%) | 42.2 ± 37.7 |
| II (1) | 1 (100.0%) | 0 (0.0%) | 0.0 ± 0.0 |
| III (9) | 5 (55.6%) | 4 (44.4%) | 38.3 ± 42.3 |
| IV (1) | 1 (100.0%) | 0 (0.0%) | 3.3 ± 0.00 |
| Subtype (207) | Chi square test, P = 0.0182 | ANOVA, *significant in some | |
| BAC (123) | 43 (35.0%) | 80 (65.0%) | 41.1 ± 37.2 |
| MUC (6) | 2 (33.3%) | 4 (66.7%) | 55.0 ± 41.6 |
| PAP (34) | 19 (39.2%) | 15 (60.8%) | 31.6 ± 36.1 |
| ACN (23) | 7 (30.4%) | 16 (69.6%) | 54.8 ± 41.1 |
| SOL (21) | 14 (66.7%) | 7 (33.3%) | 24.9 ± 34.4 |
| Grade (207) | Chi square test, P = 0.0094 | ANOVA, #significant in some | |
| WEL (120) | 43 (33.3%) | 80 (66.7%) | 42.4 ± 38.0 |
| MOD (62) | 26 (39.2%) | 36 (60.8%) | 41.9 ± 39.4 |
| POR (25) | 17 (55.0%) | 8 (45.0%) | 22.1 ± 32.2 |
| Growth activity (207) | Chi square test, P = 0.0061 | Student’s t test, P = 0.0277 | |
| High (91) | 47 (51.6%) | 44 (48.4%) | 33.3 ± 36.3 |
| Low (116) | 38 (25.9%) | 78 (74.1%) | 44.9 ± 38.4 |
| Oncogenic mutation (149) | Chi square test, P = 0.4482 | ANOVA, not significant in any | |
| EGFR (32) | 10 (51.6%) | 22 (48.4%) | 38.7 ± 34.7 |
| KRAS (26) | 11 (25.9% | 15 (74.1%) | 38.1 ± 38.2 |
| NONE (91) | 40 (25.9%) | 51 (74.1%) | 37.0 ± 37.3 |
NSCLCs, non-small cell lung carcinomas; ADC, adenocarcinoma; SQC, squamous cell carcinoma; LCC, large cell carcinoma; WEL, well differentiated; MOD, moderately differentiated; POR, poorly differentiated carcinomas; Older, defined as more than 65 years-old; Growth activity high, defined as tumors with MIB1 labeling index equial to or more than 10%.
ADC versus SQC (P = 0.0032); LCC versus SQC (P = 0.0022);
WEL versus POR (P = 0.0222); #MOD versus POR (P = 0.0207).
Figure 2.
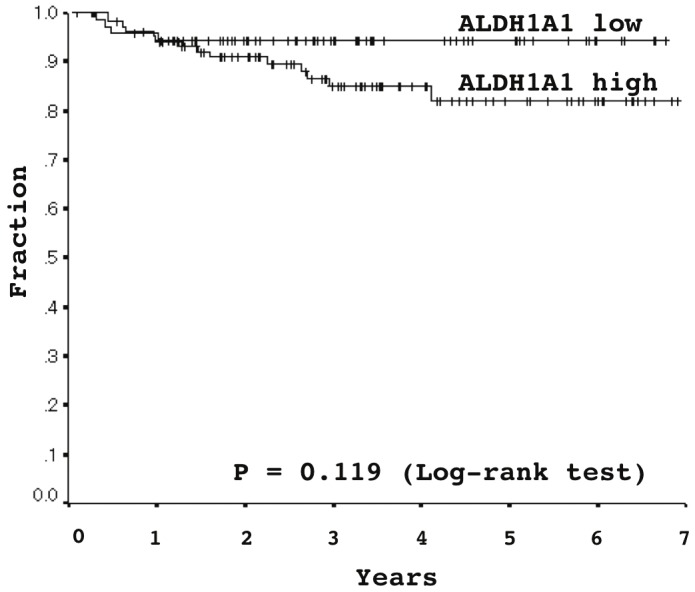
Association between ALDH1A1 expression and disease-free survival in stage I lung adenocarcinomas, analyzed using Kaplan-Meier survival curves: Five-year disease-free survival rates were 94.3% and 82.1% in ALDH1A1 low- and high-expressers, respectively (Log-rank test, P = 0.119).
ALDH1A1 protein and mRNA expression in NSCLC cell lines
Among the NSCLC cell lines examined, only A549 (ADC) and PC1 (SQC) strongly expressed the ALDH1A1 protein and mRNA (Figure 3). Non-cancerous epithelial cells, SAEC and NHBE-T, faintly (very weakly) expressed the protein and mRNA (Figure 3). The level of protein and mRNA well paralleled each other. Treatment for some of the cell lines that lost ALDH1A1 expression (LC2ad, H2087, HARA, TKB14, H1819, H441) with inhibitors for DNA methyltransferase (5-Aza-dc) and/or histone deacetylase (trichostatin A) did not restore expression of the protein or mRNA (data not shown).
Figure 3.

Expression of the ALDH1A1 protein and mRNA in non-cancerous airway epithelial cells and non-small cell lung carcinoma (NSCLC) cell lines: A. ALDH1A1 and β-actin (ACTB) protein expression was analyzed by Western blotting. Levels of the ALDH1A1 and ACTB proteins were semi-quantified with a densitometer (NIH Image; National Institute of Mental Health at Bethesda, MD). The level of ALDH1A1 normalized to that of ACTB is plotted in a graph. B. The mRNA level of ALDH1A1 normalized to that of GAPDH was measured by quantitative RT-PCR and plotted in a graph. NEC, non-cancerous airway epithelial cells; ADC, adenocarcinoma cell lines; SQC, squamous cell carcinoma cell lines; LCC, large cell carcinoma cell lines; NSCLC, non-small cell lung carcinoma cell lines.
Effect of forced expression of ALDH1A1 on growth activity
The forced expression of ALDH1A1 markedly reduced clonogenicity (Figure 4A) and prolonged doubling time (Figure 4B) in a NSCLC cell line lost ALDH1A1 expression (representative results in TKB5 cells were shown in Figure 4). Similar results were also seen in some of the other cell lines examined (H1299, H2087, LC2ad) (data not shown).
Figure 4.

Effect of forced expression of ALDH1A1 on growth activity: Empty vector (MOCK), sense strand of ALDH1A1 (SS), or antisense strand of ALDH1A1 (AS) was retrovirally transduced into TKB5 cells. Three days after the selection process, cells were harvested and counted, and 2.0×10⁴ were re-seeded onto a 10-cm dish. After 10 days, the cells were fixed with methanol and stained with Giemsa. A. Representative photographs of colony formation. B. The means and standard deviations (error bars) of colony counts from triplicate experiments. C. The selected cells were cultured, grown and passed. The cumulated population doublings are presented. D. The cells harvested immediately after the selection process were examined for the expression of ALDH1A1 and β-actin (ACTB) by Western blotting. Representative results are shown.
Discussion
Severe downregulation of ALDH1A1 expression was found in 107 out of 268 primary NSCLCs (Table 1). The downregulation tended to occur more often in cases of ADC and LCC than SQC. Among the ADCs, it was more remarkable in high-grade tumors, poorly differentiated tumors, and tumors with strong proliferating activity (Table 1 and Table 2). Thus, ALDH1A1 is a potential tumor suppressor whose downregulation promotes carcinogenesis, especially in cases of ADC. The finding that the restoration of ALDH1A1 expression markedly suppressed the growth of some lung cancer cell lines supports this possibility.
Other studies have found that ALDH1A1 expression was not detected in 40% (12/30) to 56.1% (38/66) of NSCLCs [19,20], and in 35% (7/20) of lung ADCs [20]. Among lung ADCs, its level was reported to be lower in invasive tumor than in premalignant or non-invasive ones [21]. Also, ALDH1A1 expression was reported to be reduced in other malignancies: 76.9% (970/1287) of colorectal cancers [22], 21.1% (4/19) of pancreatic cancers, and 70.8% (46/65) of ovarian cancers [19]. As mentioned in the introduction section, some ALDH proteins (ALDH1A1 and ALDH1A2) oxidize retinol to synthesize retinoic acid and induce growth arrest and differentiation [6,7]. ALDH1A2, a family member closely similar to ALDH1A1, was reported to be epigenetically silenced through the hypermethylation of its promoter region in prostatic cancer cells, and forced expression of ALDH1A2 markedly suppressed the growth of the prostatic cancer cells, implying ALDH1A2 to be a tumor suppressor, loss of which could result in an impairment of retinoic acid synthesis to interfere with cellular differentiation and promote the progression of carcinogenesis [23]. Thus, it is reasonable to consider that a loss of ALDH1A1 would promote carcinogenesis of the lung through the same mechanism.
Aside from such a suppressive role, studies in vitro demonstrated that ALDH activity or ALDH1A1 protein expression was strong in stem cell fractions in a variety of malignancies including lung cancer [8-13,24-26], and suggested that ALDH1A1 could participate in the maintenance of cancer stem cells. Also, silencing experiments in vitro showed that a forced reduction of ALDH1A1 attenuated growth and migration in some lung cancer cell lines, suggesting an oncogenic role [26]. Such observations argued against our suggestion that ALDH1A1 would be a tumor suppressor. Although the reason for the discrepancy is unclear, ALDH1A1 might play diverse and directly opposed roles in different situations.
Interestingly, the downregulation of ALDH1A1 expression occurred with a significantly higher incidence in smokers than non-smokers. It is possible that this association is a result of smoking and also a mechanism promoting smoking-related carcinogenesis. As is discussed below, potential carcinogens in cigarette smoke might directly attack regulatory elements of the ALDH1A1 gene or indirectly attack certain genes controlling ALDH1A1 expression. On the other hand, regardless of the mechanism, severe downregulation of ALDH1A1 expression inevitably results in the intracellular accumulation of acetaldehyde inhaled from cigarette smoke. Acetaldehyde is a putative carcinogen that produces DNA adducts (N 2-ethylidene-dG) to cause genetic mutations [27]. Thus, ALDH1A1 might act as a tumor suppressor especially in smoking-related carcinogenesis. It is of great interest to investigate a possible association between acetaldehyde levels and ALDH1A1 activity in lung cancer.
A nitrosamine in cigarette smoke (4-(methylnitrosamino)-1-(3-pyridyl)-1-butanone (NNK)) was reported to induce DNA methyltransferase-1 accumulation [28]. Also, the level of DNA methylation in esophageal mucosa was reported to be higher in smokers than in non-smokers, suggesting that cigarette smoke could cause an epigenetic silencing of important tumor suppressors [29,30]. These findings let us hypothesize that epigenetic silencing through the DNA hypermethylation could be a possible mechanism of ALDH1A1 downregulation in NSCLCs. However, our experiment using inhibitors for DNA methyltransferase (5-Aza-dc) and histone deacetylase (trichostatin A) unexpectedly did not restore ALDH1A1 expression in any NSCLC cell lines examined, suggesting that the epigenetic silencing was unlikely to cause the downregulation of ALDH1A1 expression. Recent studies revealed that the expression of C/EBPα, a transcription factor crucial to ALDH1A1 expression, was lost in most lung cancer cells [31,32]. Functional disruption of factors controlling ALDH1A1, such as C/EBPα, would be involved. Further investigation is required to reveal the actual molecular mechanism responsible for the downregulation of ALDH1A1 expression in lung cancer.
In summary, the present study has demonstrated that ALDH1A1 expression was markedly downregulated in a considerable proportion of NSCLCs through an as yet unidentified mechanism and suggested the loss of ALDH1A1 could promote the progression of lung cancer, especially smoking-related ADCs.
Acknowledgments
This work was supported by the Japanese Ministry of Education, Culture, Sports, and Science (Tokyo Japan), Smoking Research Foundation (Tokyo, Japan), and by a grant from Yokohama Medical Facility (Yokohama, Japan). We especially thank Emi Honda and Misa Otara (Division of Pathology, Kanagawa Prefectural Cardiovascular and Respiratory Center Hospital, Yokohama, Japan) for assistance.
References
- 1.Hoffman PC, Mauer AM, Vokes EE. Lung cancer. Lancet. 2000;335:479–485. doi: 10.1016/S0140-6736(00)82038-3. [DOI] [PubMed] [Google Scholar]
- 2.Spira A, Ettinger DS. Multidisciplinary management of lung cancer. N Engl J Med. 2003;350:379–392. doi: 10.1056/NEJMra035536. [DOI] [PubMed] [Google Scholar]
- 3.Yang P, Allen MS, Aubry MC, Wampfler JA, Marks RS, Edell ES, Thibodeau S, Adjei AA, Jett J, Deschamps C. Clinical features of 5,628 primary lung cancer patients: experience at Mayo Clinic from 1997 to 2003. Chest. 2005;128:452–462. doi: 10.1378/chest.128.1.452. [DOI] [PubMed] [Google Scholar]
- 4.Ou SH, Zell JA, Ziogas A, Anton-Culver H. Prognostic factors for survival of stage I non-small cell lung cancer patients: a population-based analysis of 19,702 stage I patients in the California Cancer Registry from 1989 to 2003. Cancer. 2007;110:1532–1541. doi: 10.1002/cncr.22938. [DOI] [PubMed] [Google Scholar]
- 5.Asamura H, Goya T, Koshiishi Y, Sohara Y, Eguchi K, Mori M, Nakanishi Y, Tsuchiya R, Shimokata K, Inoue H, Nukiwa T, Miyaoka E. Japanese Joint Committee of Lung Cancer Registry. A Japanese Lung Cancer Registry study: prognosis of 13,010 resected lung cancers. J Thorac Oncol. 2008;3:46–52. doi: 10.1097/JTO.0b013e31815e8577. [DOI] [PubMed] [Google Scholar]
- 6.Yoshida A, Rzhetsky A, Hsu LC, Chang C. Human aldehyde dehydrogenase gene family. Eur J Biochem. 1998;251:549–557. doi: 10.1046/j.1432-1327.1998.2510549.x. [DOI] [PubMed] [Google Scholar]
- 7.Sophos NA, Vasiliou V. Aldehyde dehydrogenase gene superfamily: the 2009 update. Chem Biol Interact. 2003;143-144:5–22. doi: 10.1016/s0009-2797(02)00163-1. [DOI] [PubMed] [Google Scholar]
- 8.Huang EH, Hynes MJ, Zhan T, Ginestier C, Dontu G, Appelman H. Aldehyde dehydrogenase 1 is a marker for normal and malignant human colonic stem cells (SC) and tracks SC overpopulation during colon tumorigenesis. Cancer Res. 2009;69:3382–3389. doi: 10.1158/0008-5472.CAN-08-4418. [DOI] [PMC free article] [PubMed] [Google Scholar]
- 9.Jones RJ, Barber JP, Vala MS, Collector MI, Kaufmann SH, Ludeman SM, Colvin OM, Hilton J. Assessment of aldehyde dehydrogenase in viable cells. Blood. 1995;85:2742–2746. [PubMed] [Google Scholar]
- 10.Armstrong L, Stojkovic M, Dimmick I, Ahmad S, Stojkovic P, Hole N, Lako M. Phenotypic characterization of murine primitive hematopoietic progenitor cells isolated on basis of aldehyde dehydroganse activity. Stem Cells. 2004;22:1142–1151. doi: 10.1634/stemcells.2004-0170. [DOI] [PubMed] [Google Scholar]
- 11.Corti S, Locatelli F, Papadimitriou D, Donadoni C, Salani S, Del Bo R, Strazzer S, Bresolin N, Comi GP. Identification of a primitive brain-derived neural stem cell population based on aldehyde dehydrogenase activity. Stem Cells. 2006;24:975–985. doi: 10.1634/stemcells.2005-0217. [DOI] [PubMed] [Google Scholar]
- 12.Ginestier C, Hur MH, Charafe-Jauffret E, Monville F, Dutcher J, Brown M, Jacquemier J, Viens P, Kleer CG, Liu S, Schott A, Hayes D, Birnbaum D, Wicha MS, Dontu G. ALDH1 is a marker of normal and malignant human mammary stem cells and a predictor of poor clinical outcome. Stem Cell. 2007;1:555–567. doi: 10.1016/j.stem.2007.08.014. [DOI] [PMC free article] [PubMed] [Google Scholar]
- 13.Dylla SJ, Beviglia L, Park IK, Chartier C, Raval J, Ngan L, Pickell K, Aguilar J, Lazetic S, Smith-Berdan S, Clarke MF, Hoey T, Lewicki J, Gurney AL. Colorectal cancer stem cells are enriched in xenogeneic tumors following chemotherapy. PLoS ONE. 2008;3:e2428. doi: 10.1371/journal.pone.0002428. [DOI] [PMC free article] [PubMed] [Google Scholar]
- 14.Sobin LH, Gospodarowicz MK, Wittekind C. TNM Classification of Malignant Tumors. 7th Edition. Oxford: Wiley-Blackwell; 2009. [Google Scholar]
- 15.Woo T, Okudela K, Yazawa T, Wada N, Ogawa N, Ishiwa N, Tajiri M, Rino Y, Kitamura H, Masuda M. Prognostic value of KRAS mutations and Ki-67 expression in stage I lung adenocarcinomas. Lung Cancer. 2009;65:355–362. doi: 10.1016/j.lungcan.2008.11.020. [DOI] [PubMed] [Google Scholar]
- 16.Okudela K, Woo T, Mitsui H, Yazawa T, Shimoyamada H, Tajiri M, Ogawa N, Masuda M, Kitamura H. Morphometric profiling of lung cancers-its association with clinicopathologic, biologic, and molecular genetic features. Am J Surg Pathol. 2011;34:243–255. doi: 10.1097/PAS.0b013e3181c79a6f. [DOI] [PubMed] [Google Scholar]
- 17.Cozens AL, Yezzi MJ, Kunzelmann K, Ohrui T, Chin L, Eng K, Finkbeiner WE, Widdicombe JH, Gruenert DC. CFTR expression and chloride secretion in polarized immortal human bronchial epithelial cells. Am J Respir Cell Mol Biol. 1994;10:38–47. doi: 10.1165/ajrcmb.10.1.7507342. [DOI] [PubMed] [Google Scholar]
- 18.Okudela K, Yazawa T, Woo T, Sakaeda M, Ishii J, Mitsui H, Shimoyamada H, Sato H, Tajiri M, Ogawa N, Masuda M, Takahashi T, Sugimura H, Kitamura H. Downregulation of DUSP6 expression in lung cancer: its mechanism and potential role in carcinogenesis. Am J Pathol. 2009;175:867–881. doi: 10.2353/ajpath.2009.080489. [DOI] [PMC free article] [PubMed] [Google Scholar]
- 19.Deng S, Yang X, Lassus H, Liang S, Kaur S, Ye Q, Li C, Wang LP, Roby KF, Orsulic S, Connolly DC, Zhang Y, Montone K, Bützow R, Coukos G, Zhang L, Cao Y. Distinct expression levels and patterns of stem cell marker, aldehyde dehydrogenase isoform 1 (ALDH1), in human epithelial cancers. PLoS One. 2010;5:e10277. doi: 10.1371/journal.pone.0010277. [DOI] [PMC free article] [PubMed] [Google Scholar]
- 20.Shien K, Toyooka S, Ichimura K, Soh J, Furukawa M, Maki Y, Muraoka T, Tanaka N, Ueno T, Asano H, Tsukuda K, Yamane M, Oto T, Kiura K, Miyoshi S. Prognostic impact of cancer stem cell-related markers in non-small cell lung cancer patients treated with induction chemoradiotherapy. Lung Cancer. 2012;77:162–167. doi: 10.1016/j.lungcan.2012.02.006. [DOI] [PubMed] [Google Scholar]
- 21.Patel M, Lu L, Zander DS, Sreerama L, Coco D, Moreb JS. ALDH1A1 and ALDH3A1 expression in lung cancers: correlation with histologic type and potential precursors. Lung Cancer. 2008;59:340–349. doi: 10.1016/j.lungcan.2007.08.033. [DOI] [PubMed] [Google Scholar]
- 22.Lugli A, Iezzi G, Hostettler I, Muraro MG, Mele V, Tornillo L, Carafa V, Spagnoli G, Terracciano L, Zlobec I. Prognostic impact of the expression of putative cancer stem cell markers CD133, CD166, CD44s, EpCAM, and ALDH1 in colorectal cancer. Br J Cancer. 2010;103:382–390. doi: 10.1038/sj.bjc.6605762. [DOI] [PMC free article] [PubMed] [Google Scholar]
- 23.Kim H, Lapointe J, Kaygusuz G, Ong DE, Li C, van de Rijn M, Brooks JD, Pollack JR. The retinoic acid synthesis gene ALDH1a2 is a candidate tumor suppressor in prostate cancer. Cancer Res. 2005;65:8118–8124. doi: 10.1158/0008-5472.CAN-04-4562. [DOI] [PubMed] [Google Scholar]
- 24.Jiang F, Qiu Q, Khanna A, Todd NW, Deepak J, Xing L, Wang H, Liu Z, Su Y, Stass SA, Katz RL. Aldehyde dehydrogenase 1 is a tumor stem cell-associated marker in lung cancer. Mol Cancer Res. 2009;7:330–338. doi: 10.1158/1541-7786.MCR-08-0393. [DOI] [PMC free article] [PubMed] [Google Scholar]
- 25.Ucar D, Cogle CR, Zucali JR, Ostmark B, Scott EW, Zori R, Gray BA, Moreb JS. Aldehyde dehydrogenase activity as a functional marker for lung cancer. Chem Biol Interact. 2009;178:48–55. doi: 10.1016/j.cbi.2008.09.029. [DOI] [PMC free article] [PubMed] [Google Scholar]
- 26.Moreb JS, Baker HV, Chang LJ, Amaya M, Lopez MC, Ostmark B, Chou W. ALDH isozymes downregulation affects cell growth, cell motility and gene expression in lung cancer cells. Mol Cancer. 2008;7:87. doi: 10.1186/1476-4598-7-87. [DOI] [PMC free article] [PubMed] [Google Scholar]
- 27.Singh R, Sandhu J, Kaur B, Juren T, Steward WP, Segerbeck D, Farmer PB. Evaluation of the DNA damaging potential of cannabis cigarette smoke by the determination of acetaldehyde derived N2-ethyl-2’-deoxyguanosine adducts. Chem Res Toxicol. 2009;22:1181–1188. doi: 10.1021/tx900106y. [DOI] [PubMed] [Google Scholar]
- 28.Lin RK, Hsieh YS, Lin P, Hsu HS, Chen CY, Tang YA, Lee CF, Wang YC. The tobacco-specific carcinogen NNK induces DNA methyltransferase 1 accumulation and tumor suppressor gene hypermethylation in mice and lung cancer patients. J Clin Invest. 2010;120:521–532. doi: 10.1172/JCI40706. [DOI] [PMC free article] [PubMed] [Google Scholar]
- 29.Oka D, Yamashita S, Tomioka T, Nakanishi Y, Kato H, Kaminishi M, Ushijima T. The presence of aberrant DNA methylation in noncancerous esophageal mucosae in association with smoking history: a target for risk diagnosis and prevention of esophageal cancers. Cancer. 2009;115:3412–3426. doi: 10.1002/cncr.24394. [DOI] [PubMed] [Google Scholar]
- 30.Shigaki H, Baba Y, Watanabe M, Iwagami S, Miyake K, Ishimoto T, Iwatsuki M, Baba H. LINE-1 Hypomethylation in Noncancerous Esophageal Mucosae is Associated with Smoking History. . Ann Surg Oncol. 2012 Jul 6; doi: 10.1245/s10434-012-2488-y. [Epub ahead of print: PMID: 22766991] [DOI] [PubMed] [Google Scholar]
- 31.Halmos B, Huettner CS, Kocher O, Ferenczi K, Karp DD, Tenen DG. Down-regulation and antiproliferative role of C/EBPalpha in lung cancer. Cancer Res. 2002;62:528–534. [PubMed] [Google Scholar]
- 32.Tada Y, Brena RM, Hackanson B, Morrison C, Otterson GA, Plass C. Epigenetic modulation of tumor suppressor CCAAT/enhancer binding protein alpha activity in lung cancer. J Natl Cancer Inst. 2006;98:396–406. doi: 10.1093/jnci/djj093. [DOI] [PubMed] [Google Scholar]